Bitcoin (BTCUSD) - 10th March 2025 | @ 725 Hours (~ 30 Days) | + 14.41%
Last trade: + 14.41% | 'C' class signal detected in Bitcoin (BTC/USD). Running at an average wavelength of 725 hours (~ 30 days) over 7 iterations since August 14th, 2024. Currently troughing


ΣL Cycle Summary
As we await the progress and resolution in the battle for the dominant daily cycles, outlined in February (60/80 day waves), the smaller waves continue to influence to a good degree. This wave’s previously sideways up-leg a potent warning for a good short to come during late February and into early March - which manifested well. We also saw a significant rise in amplitude at even shorter cycles after much macro speculation surrounded cryptocurrency. This turned out to be another bull trap, sprung March 2nd.
This cycle, around 30 days average wavelength is due a trough. If the previously mentioned 60 day wave is indeed still dominant, it is in phase and should combine with the smaller wave to increase bullish power. If, however, the 80 day wave is reasserting it’s dominance, the move from this smaller wave is likely to be relatively benign as the phase of these two are inverted, as shown below.
Trade Update
Summary of the most recent trade enacted with this signal and according to the time prediction detailed in the previous report for this instrument, linked below.
Type: Early Sell - Bitcoin 18th February 2025
Entry: 18th February 2025 @ 95607.40
Exit: 10th March 2025 @ 81832.78
Gain: 14.41%
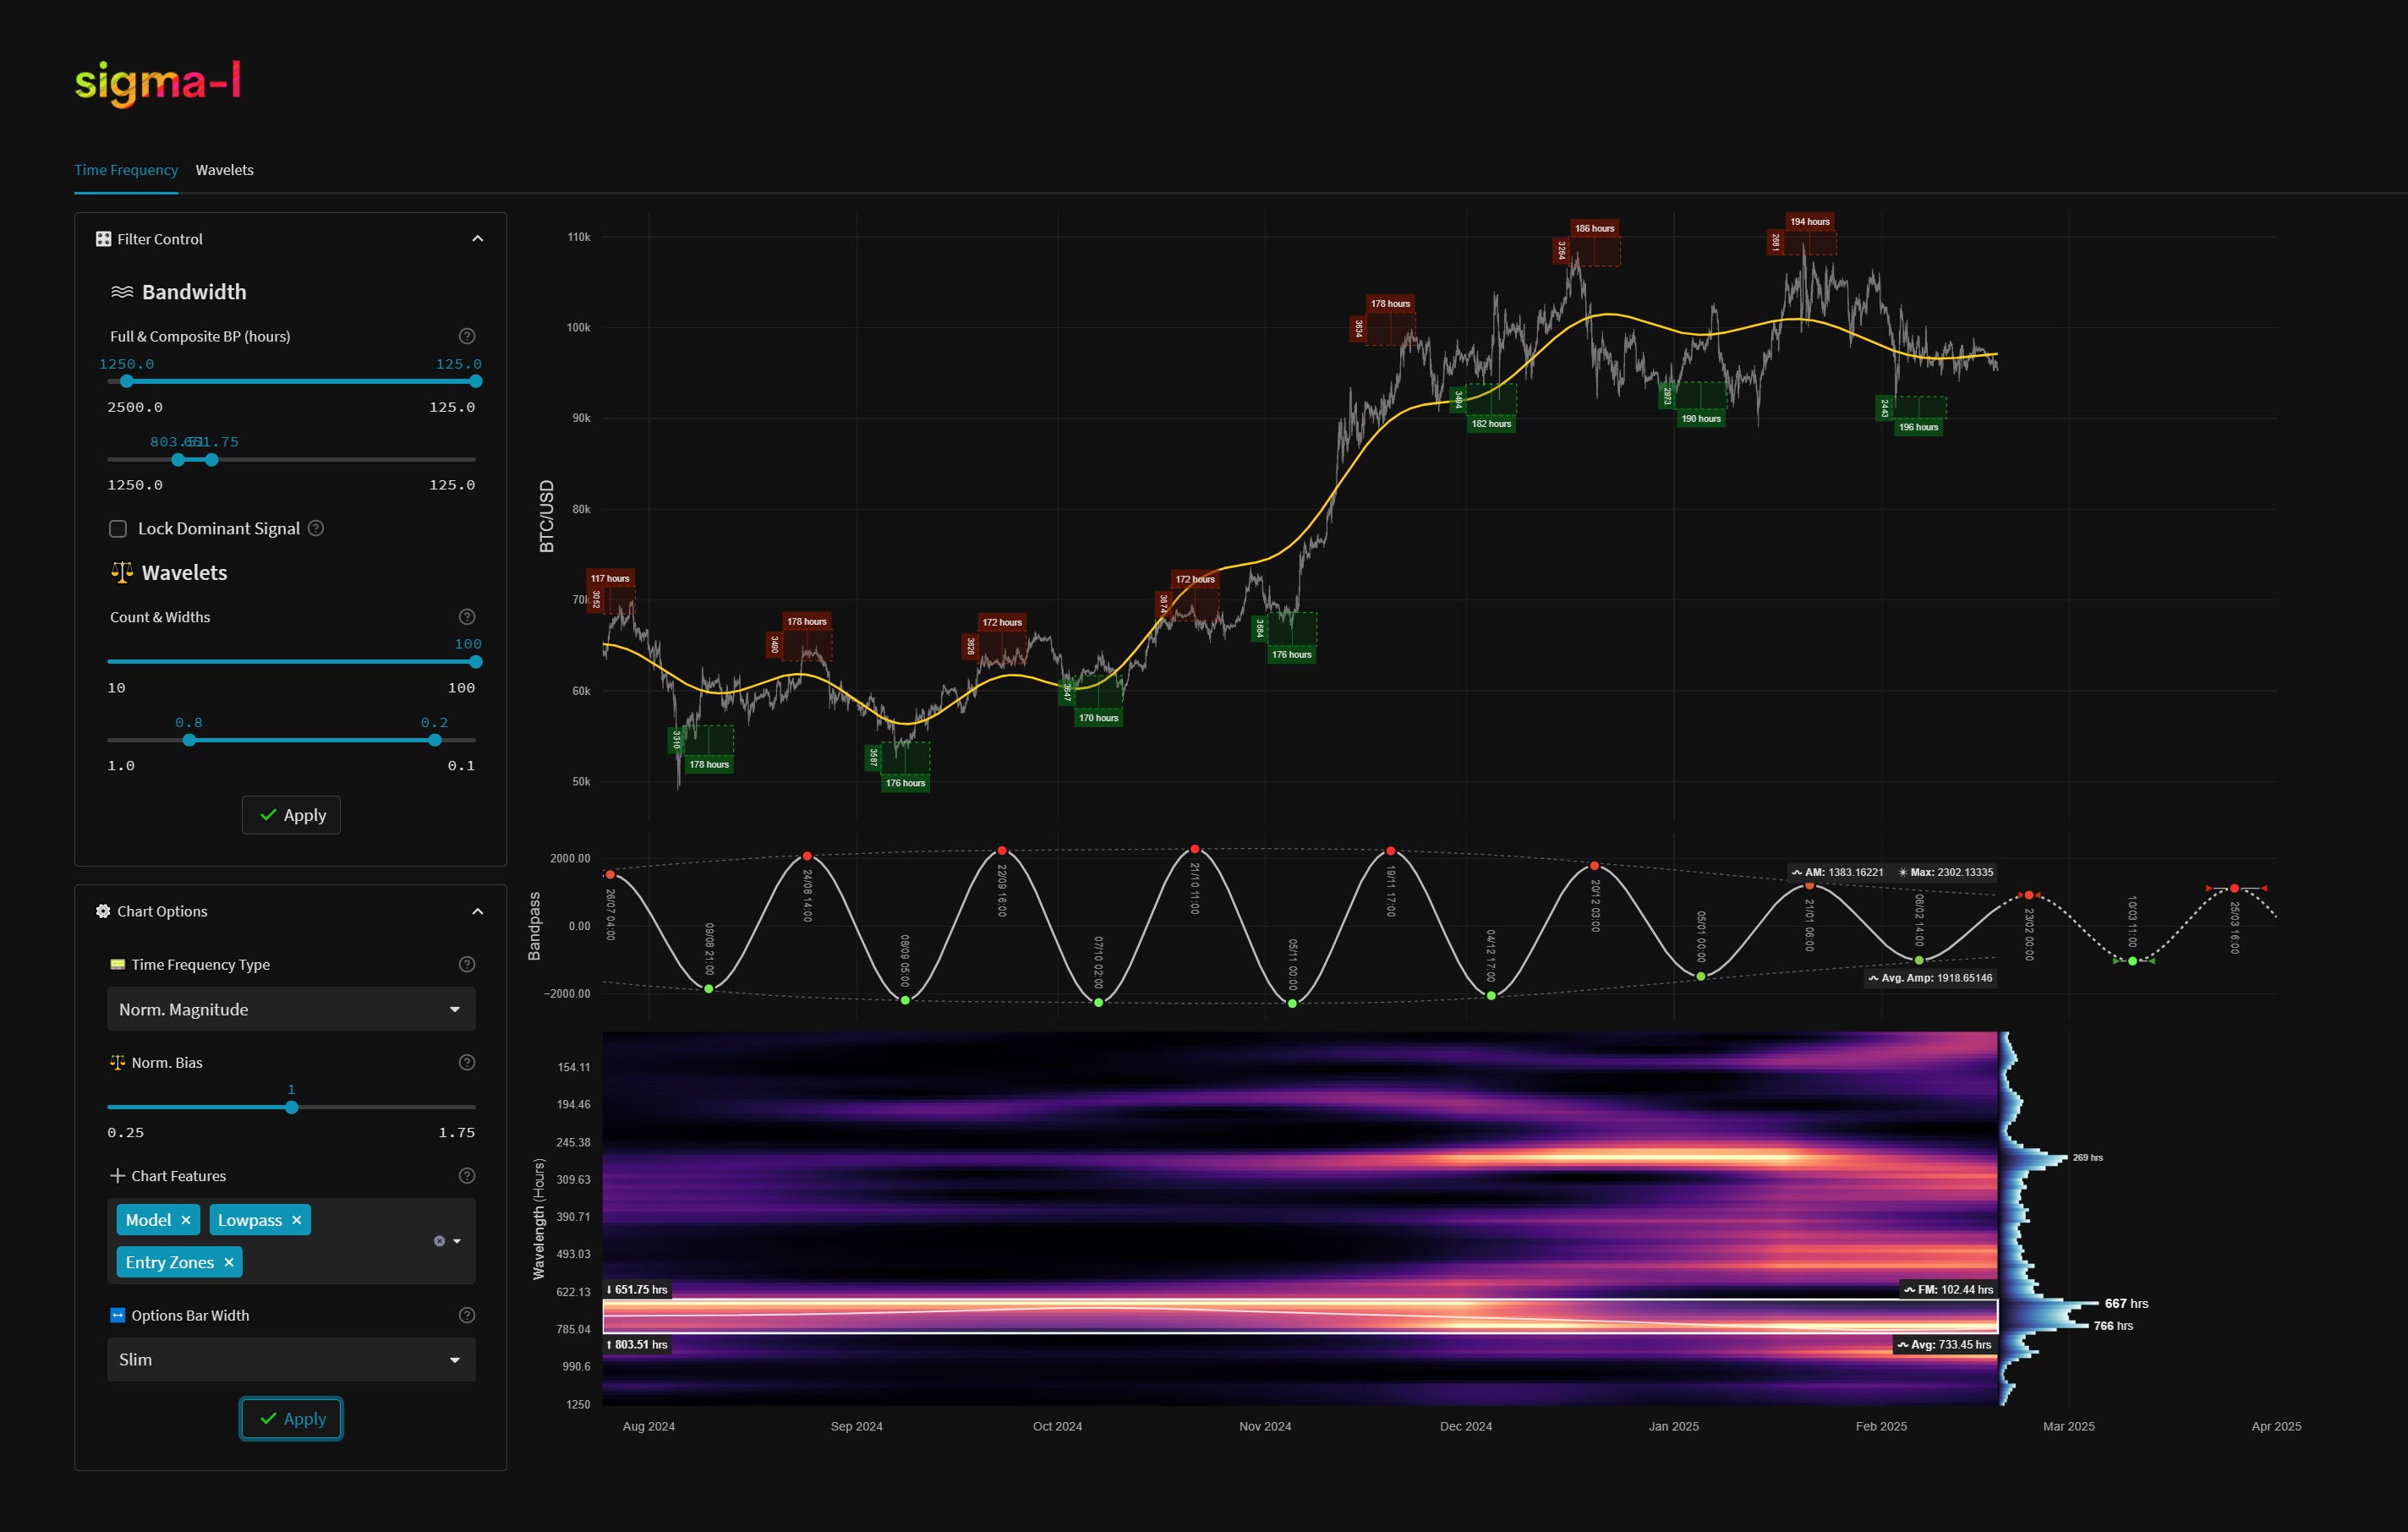
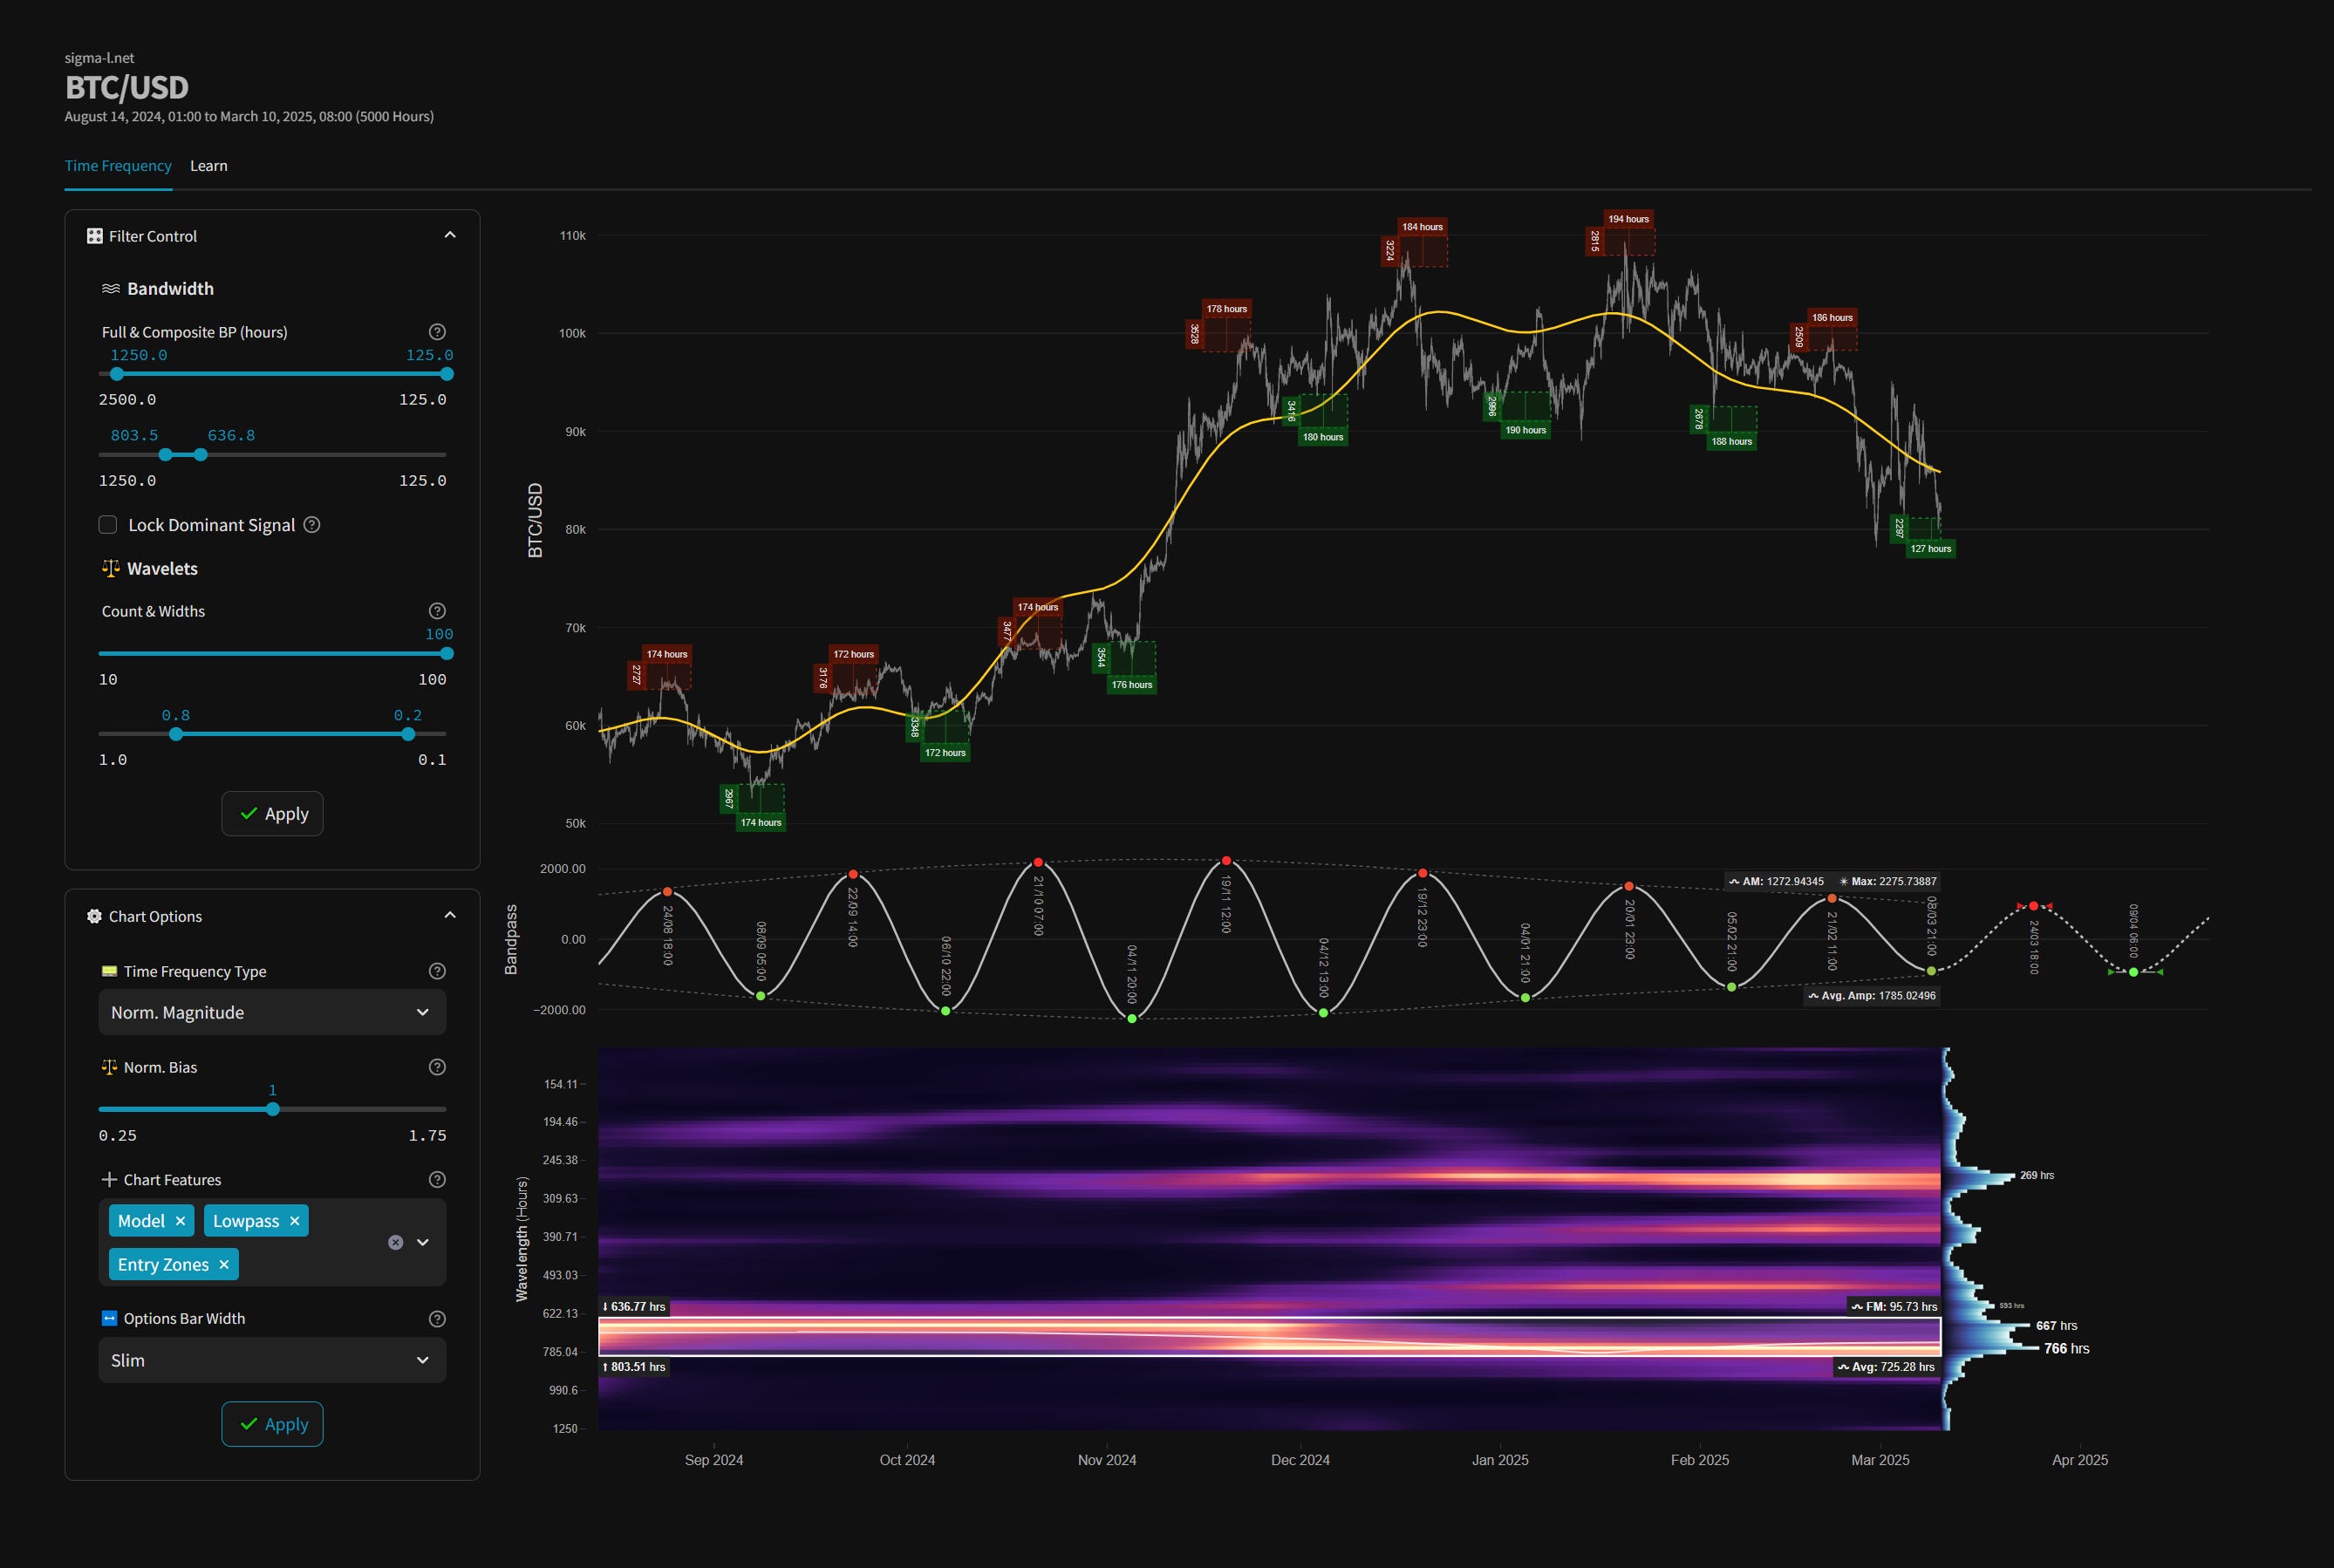
Time Frequency Analysis
Time frequency charts (learn more) below will typically show the cycle of interest against price, the bandpass output alone and the bandwidth of the component in the time frequency heatmap, framed in white.
Before and After
Signal comparison between our last report and the current time, in chart format.