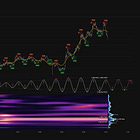
Bitcoin (BTCUSD) - 24th March 2025 | @ 85 Days | + 10.48%
Last trade: + 10.48% | 'C' class signal detected in Bitcoin (BTC/USD). Running at an average wavelength of 85 days over 13 iterations since May 2022. Currently troughing
ΣL Cycle Summary
At the medium term cycle range the 80 day wave is now at the troughing stage, according to the latest phasing. Interference from the power at around 60 days, outlined in the last report, is still present and therefore this signal maintains a ‘C’ rating in our system. Keen readers will note the out of phase alignment with the recently updated and excellent 30 day cycle, which, on the objective evidence from our time frequency analysis, has peaked.
This is the point where the distribution of power in the frequency domain becomes important - lower frequency (longer wavelength) cycles have more influence (a higher amplitude) over price than smaller waves. This can be seen in the ~ 1/f spectra (power decreases with increasing frequency) when looking at financial market spectra, a phenomenon common in natural systems and which implies a fractal structure. There can be occasions, usually transitory, where higher frequencies exhibit equal or more power than their lower frequency counterparts. This is often observed when the phase of the larger component is at or near an inflection point such as a peak or trough - where it approaches zero power. Think of consolidation or sideways ranges in traditional technical analysis terms, these are periods in which a lower frequency cycle is either peaking or troughing.
So, in this case the larger cycle (~ 80 days) should have more power and therefore nullify the bearish influence from the smaller (~ 30 day) wave somewhat. In contrast, when cycles of significant power across the spectra are in phase, a recent example being mid February (30 & 80 both hard down), more powerful moves occur.
Trade Update
Summary of the most recent trade enacted with this signal and according to the time prediction detailed in the previous report for this instrument, linked below.
Type: Sell - Bitcoin 13th February 2025
Entry: 13th February 2025 @ 97509.03
Exit: 26th March 2025 @ 87291.29
Gain: 10.48%


