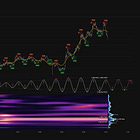
Bitcoin (BTCUSD) - 7th April 2025 | @ 799 Hours (~ 33 Days) | + 10.61%
Last trade: + 10.61% | 'B' class signal detected in Bitcoin (BTC/USD). Running at an average wavelength of 799 hours (~ 33 days) over 6 iterations since September 2024. Approaching a trough
ΣL Cycle Summary
Once again this shorter term wave in Bitcoin has dictated price action through a relatively mild down leg in comparison to other major markets, macro news increasing amplitude in equity indices serving as one example. It is worth noting that this wave (around 30-35 days) also exists in equity indices, varying more by amplitude, not timing (frequency). Clearly the equity indices took a much bigger hammering via the news catalyst than Bitcoin recently and this resilience was definitely interesting to note. Some analysts have deemed it a ‘de-coupling’ moment. In the context of our analysis we see the couple walking together, but one is swinging their legs wildly!
We are slightly early into reporting the next trough for this cycle so readers should bear that in mind. However, we are well within the margin of error for the frequency modulation attached to this component which serves as a vital guide in the context of financial market cycle analysis. We have upgraded this signal to a ‘B’ category given it’s continued stationarity.
Trade Update
Summary of the most recent trade enacted with this signal and according to the time prediction detailed in the previous report for this instrument, linked below.
Type: Early Sell - Bitcoin (BTCUSD) 21st March 2025
Entry: 21st March 2025 @ 84061.96
Exit: 7th April 2025 @ 75146.19
Gain: 10.61%


