


Copper (XG/USD) - 26th March 2025 | @ 156 Days
'A' class signal detected in Copper (XG/USD). Average wavelength of 156 days over 8 iterations since September 2021. Currently peaking


ΣL Cycle Summary
This sublime cycle in copper (XG/USD) is a signal that we have had our eye on for some time, awaiting the now imminent peak. It is also ubiquitous in other metals, such as uranium, aluminium and steel. Running at around 155 days average wavelength in our sample over the last ~ 4 years, it is well spectrally separated and exhibits exquisite stationarity, worthy of an ‘A’ class rating in our system. There is little more to add aside from to say this component is currently peaking, more details are given below in the signal targets section.
Time Frequency Analysis
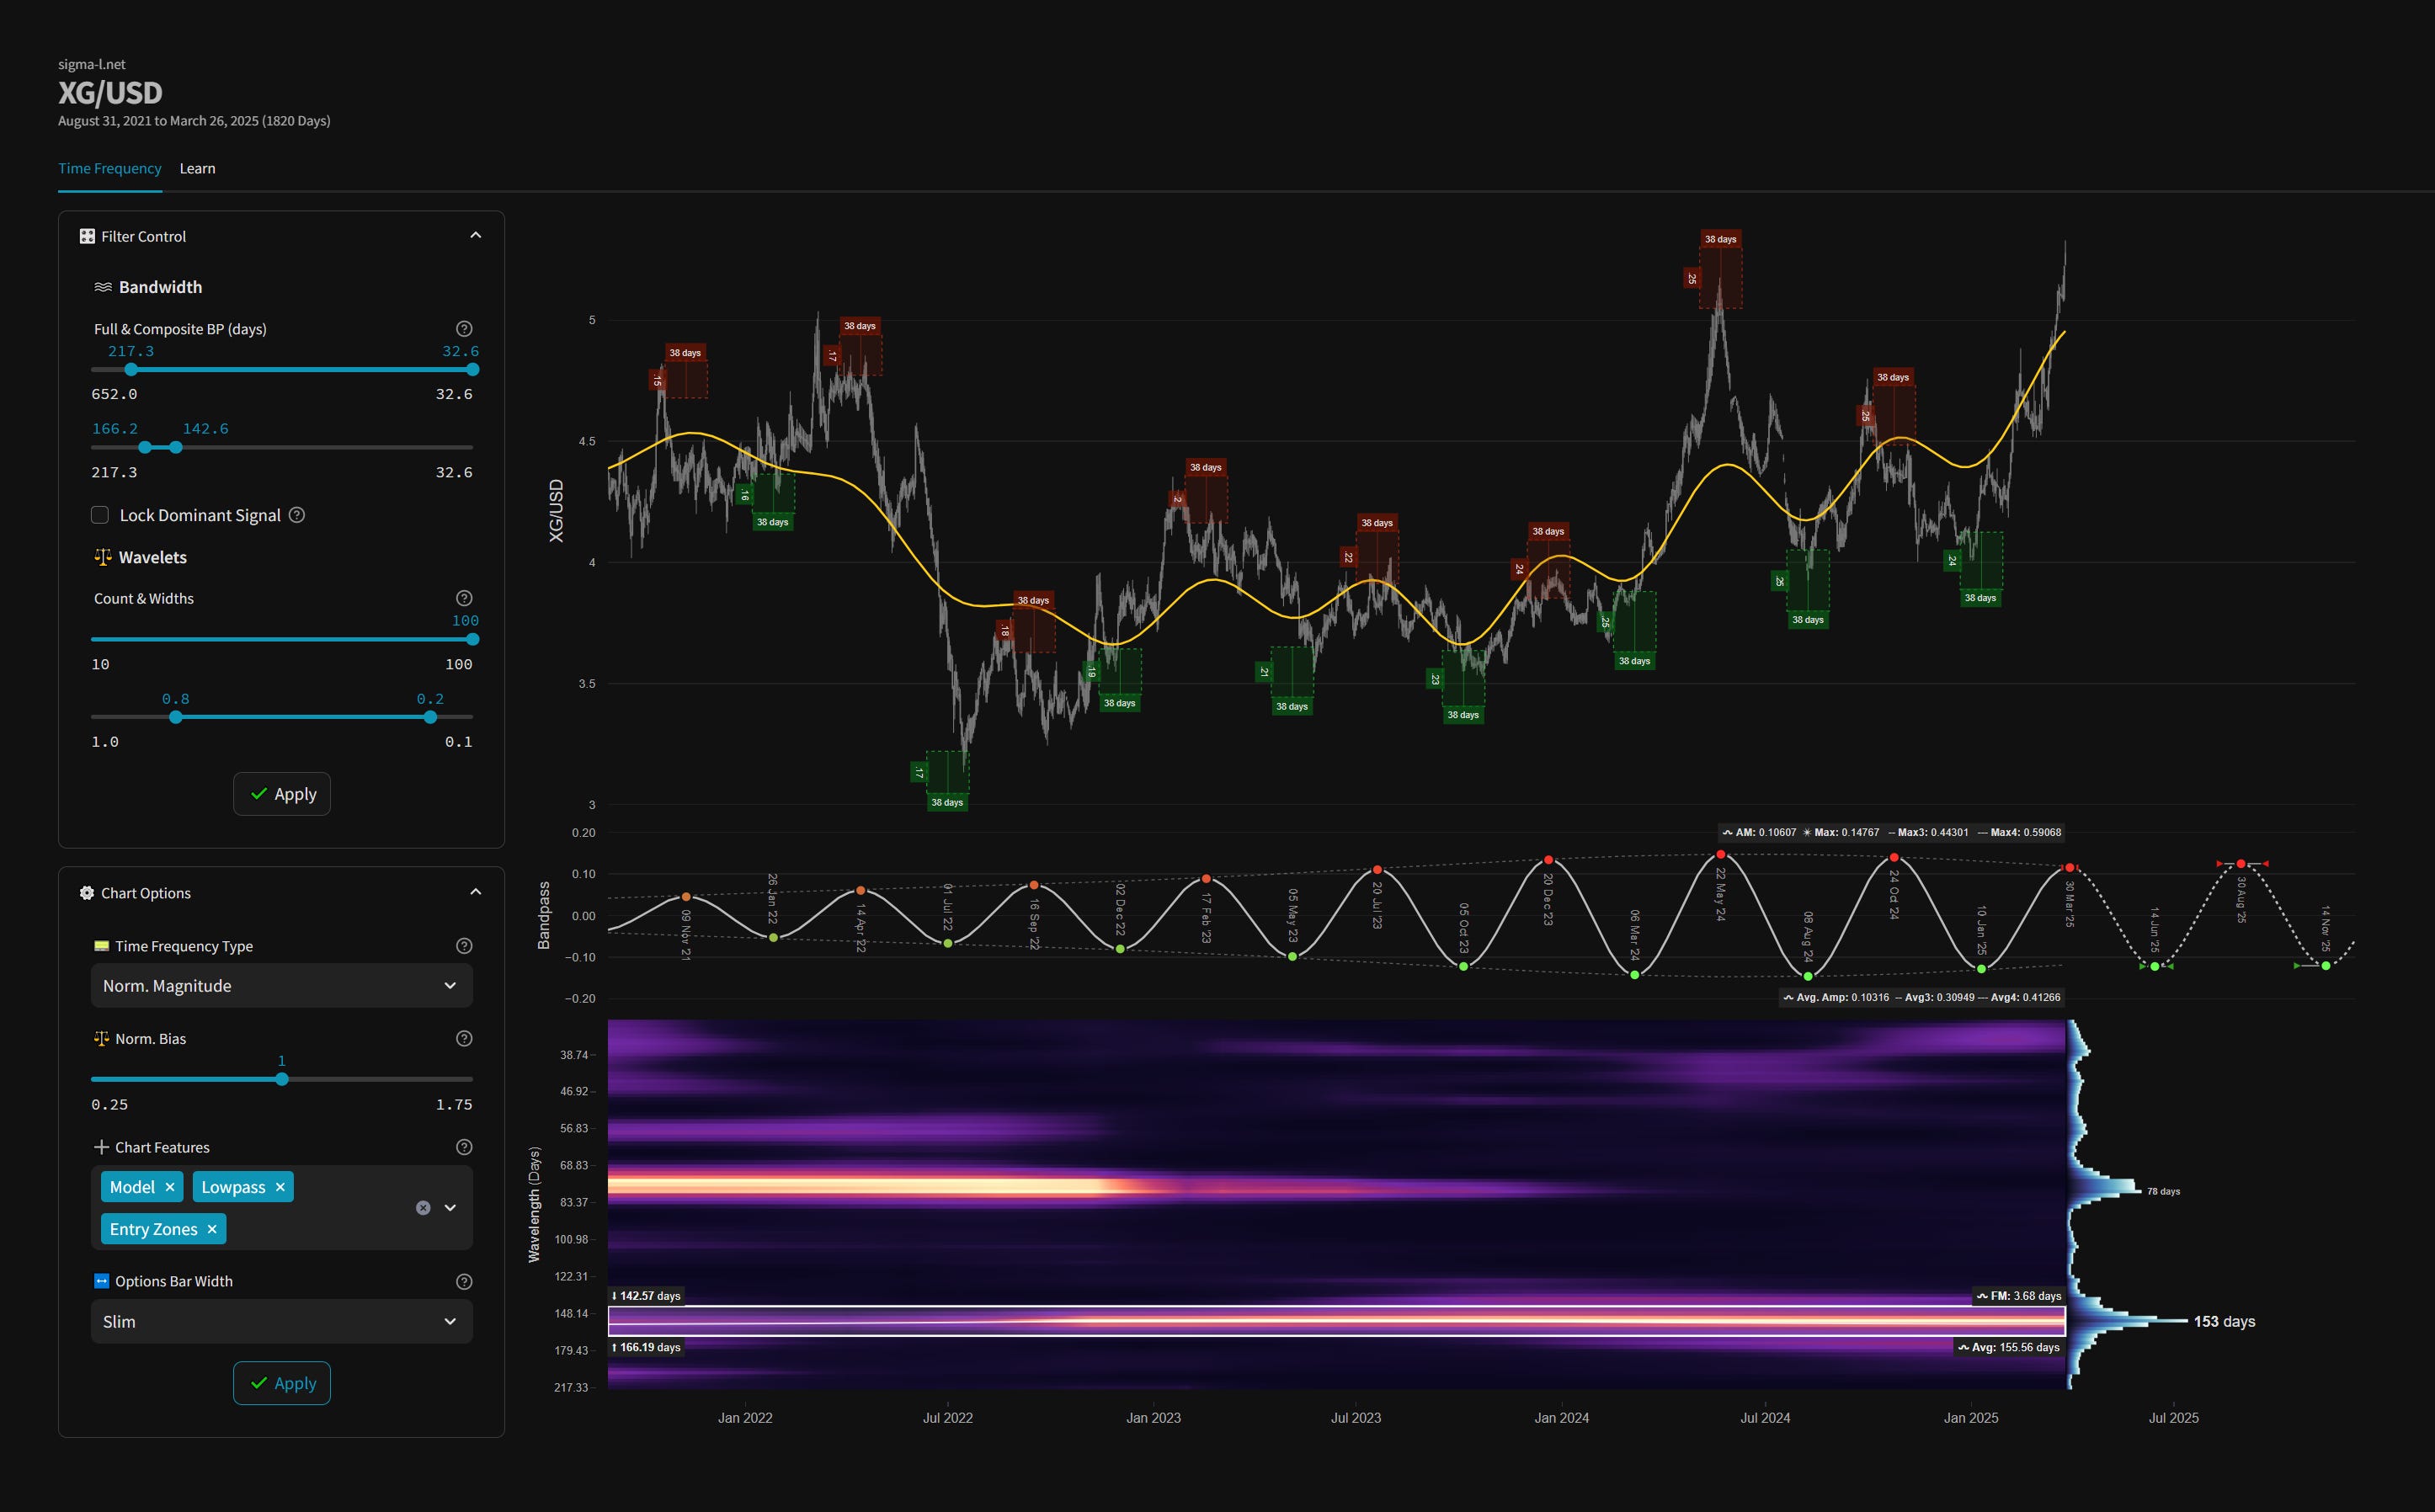
Time frequency charts (learn more) below will typically show the cycle of interest against price, the bandpass output alone and the bandwidth of the component in the time frequency heatmap, framed in white.
High-Pass Filtered Price
Our high-pass filter isolates the component of interest from underlying trend and presents buy and sell threshold envelopes (green and red). The envelopes are based upon the amplitude envelope of the bandpass filter +- 2 standard deviations. Breaches of either by high-passed price is a strong reversal action signal.
Current Signal Detail & Targets
Here we give more detail on the signal relative to speculative price, given the detected attributes of the component. In most cases the time target to hold a trade for is more important, given we focus on cycles in financial markets. Forthcoming trough and peak ranges are based upon the frequency modulation in the sample (learn more).
Detected Signal Class: A - learn more
Average Wavelength: 155.56 Days (~ 22 Weeks)
Completed Iterations: 8
Component Yield Over Sample: 131.58% - learn morePhase: Peaking
FM: +- 4 Days
AM: 0.10607
Next Trough Range: 10th - 18th June, 2025
Sigma-L Recommendation: Sell
Time Target: ~ 14th June, 2025
Current Signal Phase
This is ‘how far along’ the cycle is in it’s period at now time and is related to the predicted price action direction.
Current Signal Frequency Modulation (FM)
This is how much, on average, the signal detected varies in frequency (or wavelength) over the whole sample. A lower variance is better and implies better profitability for the component. Frequency usually modulates relatively slowly and over several iterations.
Current Signal Amplitude Modulation (AM)
This is how much the component gains or loses power (price influence) across the sample, on average. Amplitude modulation can happen quite quickly and certainly is more evident than frequency modulation in financial markets. The more stable the modulation the better.