Amplitude Modulation in Crypto
Amplitude modulation is common in most financial markets. However, using Hurst's 'Principle of Commonality' we can take advantage, especially in the relatively new market of cryptocurrency.
Amplitude Modulation?
Put simply amplitude modulation is the effect that one signal has on another. A composite modulated signal, generally imagined through summation of simple sine waves, is the result of combining two (or more) different signals together.
The recent move in July, from what is likely an 18 month nominal low in most cryptocurrencies, gives us a chance to look at a few of the main players and compare apples to apples amplitude modulation. Cryptocurrency is fantastic in that at the 18 month nominal degree and below the frequency modulation of the components is extremely low. Hurst included frequency modulation in the ‘principle of variation’ and it can be a tricky concept to accept. Inherent in this approach to technical analysis is the acceptance that some portion of price motion is infact random and some portion driven by fundamental events. This is manifested somewhat as the principle of variation in a formal phasing analysis. More concretely and numerically, variation is the change in period of components around the nominal average period and is always changing to some extent. A market with minimal change in period/frequency is a good one for us. Even better is a collection of markets in commonality with a very low measure of frequency modulation..
Below we will use Hurst Cycles software Sentient Trader to look at some of the main crypto markets, starting, of course, with Bitcoin.
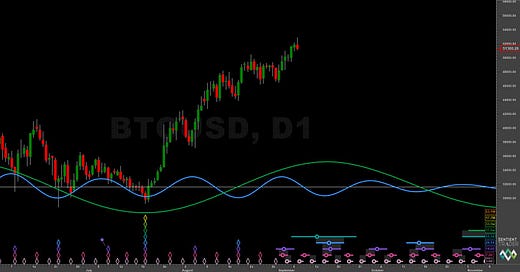
Bitcoin BTCUSD
The phasing above for Bitcoin demonstrates the most recent proposed 18 month nominal low in July 2020. Sinusoidal representations at the foot of the chart represent the 40 day (blue) and 20 week (green) components respectively. We will see that the 40 day component is precisely aligned across all the instruments we look at in this report, as are higher degree components. This will serve as our baseline for comparison. Taking Bitcoin as the marker, let’s look at Ethereum and compare.
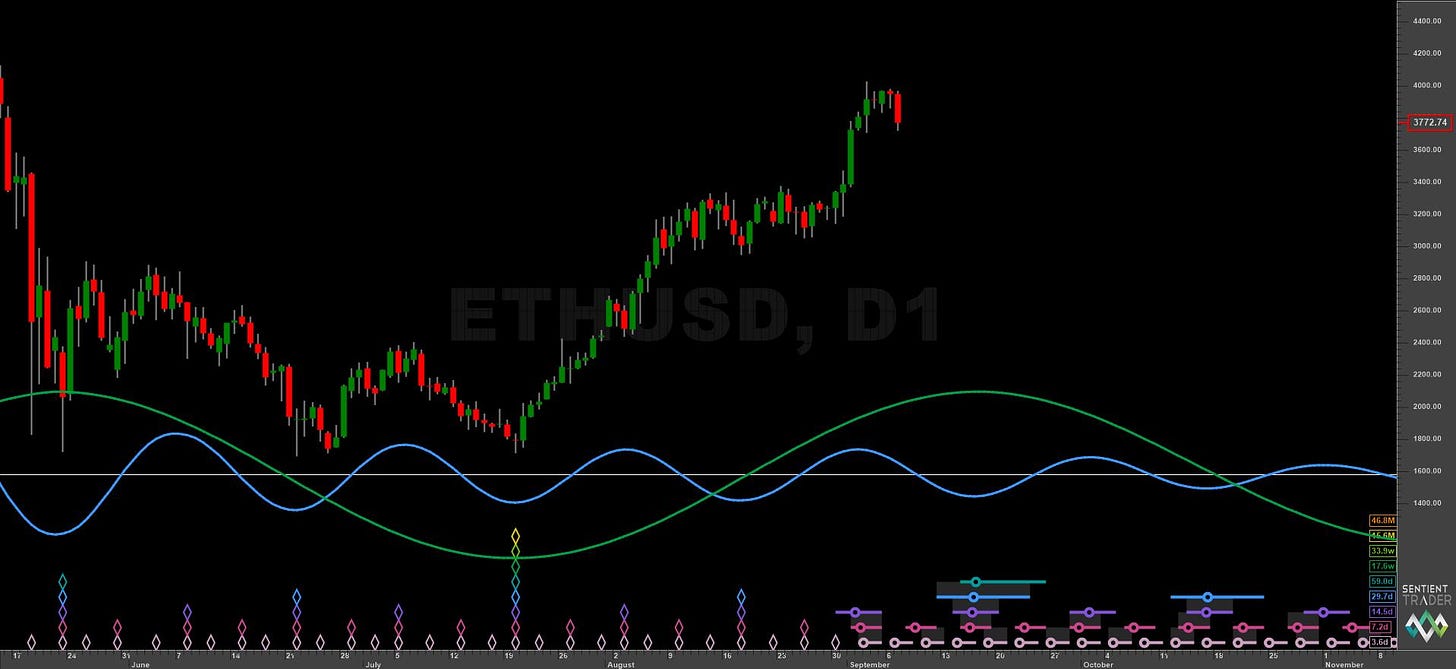
Ethereum ETHUSD
This pair displays amplitude modulation as variation to Bitcoin via components above the 40 day degree, which influence price action to reach higher. It can be noted also that the 20 day component is being attenuated somewhat compared to Bitcoin, most notably at the 20 day low early August. This is a sign that components higher than the 20 day component are becoming dominant. As we will see in Litecoin, the 20 day component that occurred early in September was marked in it’s variation of amplitude to Bitcoin. This is where a lot of modulation happened in the Cryptocurrency market.
Note the almost exact same frequency of the 40 day component!
Litecoin LTCUSD
Again we see the commonality that is very useful for trading purposes in Litecoin. The 40 day component is infact phased with exactly the same wavelength as Bitcoin. This leads us onto the conclusion that if we are sure about the frequency profile of an instrument we can maximise profits by selecting either a selection of outliers in a common market OR studying past amplitude modulation (volatility) with the premise that it will continue. We are confident in the direction of price motion but we can increase our yield over time with knowledge of commonality! Now, let us move onto something wilder..
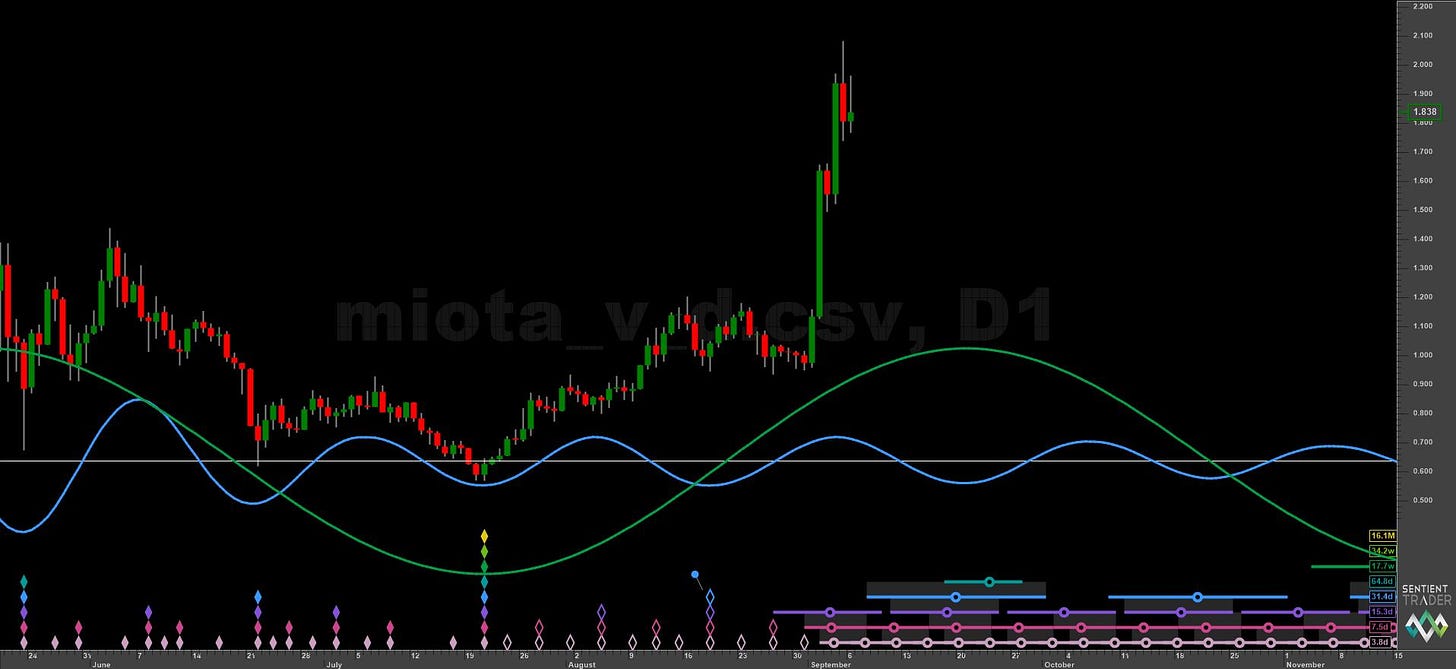
IOTA
IOTA was actually lagging behind the market until the point of the 20 day nominal low in late August. At that point the 20 day component experienced a huge boost in amplitude, likely due to a fundamental event occurring in this particular cryptocurrency. Hurst notes that most short term amplitude modulation amongst markets in commonality is caused by fundamental factors (earnings calls, company metrics, political decisions).
Again, as Hurst traders we would have been positioned correctly due to the excellent lack of frequency modulation around the 40 day component! In this case the yield would have been handsome.
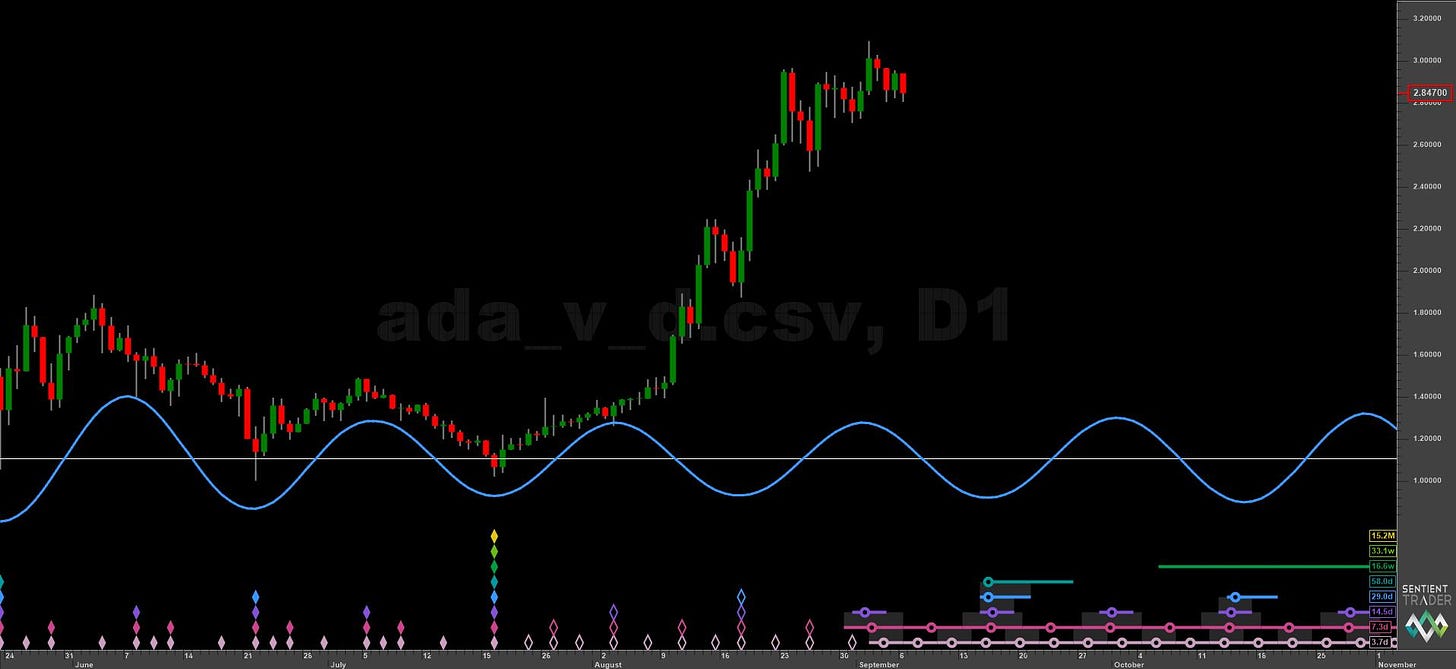
Cardano ADAUSD
Our final pair to look at is Cardano, which actually made significant new highs over the 18 month peak back in May 2020. This was tremendous amplitude modulation to the 40 day component, price being bent upward in an extreme manner by higher degree cycles as sigma-l turned bullish. Note the extreme attenuation of the 20 day component in early August, giving a hint of the upside to come.
Once again though we see the 40 day component (and others, not shown) retained a consistent and common frequency throughout the sample period, allowing any trader/investor who was positioned long at the 40 day low mid August in most crypto pairs to enjoy gains. The only difference between coins was the yield of those gains due to amplitude modulation!
Summary
It is clear that the cryptocurrency market is driven by money flow into Bitcoin and the phasing analysis from this vital pair is reflected in commonality across many of the leading coins. However, what differs from coin to coin is the volatility (or amplitude modulation).
If we have a solid phasing analysis with commonality of frequency modulation we can choose a varied range of these relatively new instruments, confident in the premise that one or two will outperform Bitcoin. Since we know the nature of the time component with a good degree of confidence it serves to removes a huge amount of uncertainty for us.
Even better is to look back at past volatility as a guide (not strictly Hurstonian..!) and select investment strategy with a view to it continuing alongside the timing analysis.
Even better still is to anticipate potential fundamental announcements that will co-incide with cycle lows, via close association with a project or an inside track on decisions within the project. This is the the ultimate setup!
If you enjoyed this article please consider sharing it with friends and colleagues.
For full Hurst cycles analysis of major cryptocurrencies, including Bitcoin, Ethereum and Litecoin, please consider subscribing! Featuring long & short term overviews, composite modelling, vital price levels and trading signals - all based upon Hurst’s cyclic principles.


