


DAX - 9th April 2024 | @ 79 Days | - 3.75%
Last trade: - 3.75% | 'B' class signal detected in the German DAX. Running at an average wavelength of 79 days over 13 iterations since July 2021. Currently troughing


ΣL Cycle Summary
In a similar manner to US Stock Markets, the DAX price continued higher into March, spurred on seemingly by the power of the 40 week nominal wave. That longer cycle last troughed in October 2023 and is now in the process of peaking. This shorter wave has likely put in a very right translated price peak and is now in the process of forming the latest trough. The power of the larger components is now waning, subscribers should be alert to short opportunities moving through the next 6 months in stock markets, globally.
Trade Update
Summary of the most recent trade enacted with this signal and according to the time prediction detailed in the previous report for this instrument, linked below.
Type: Sell - DAX 26th February 2024
Entry: 26th February 2024 @ 17423.43
Exit: 9th April 2024 @ 18076.68
Gain: - 3.75%
Before and After
Signal comparison between our last report and the current time, in chart format.

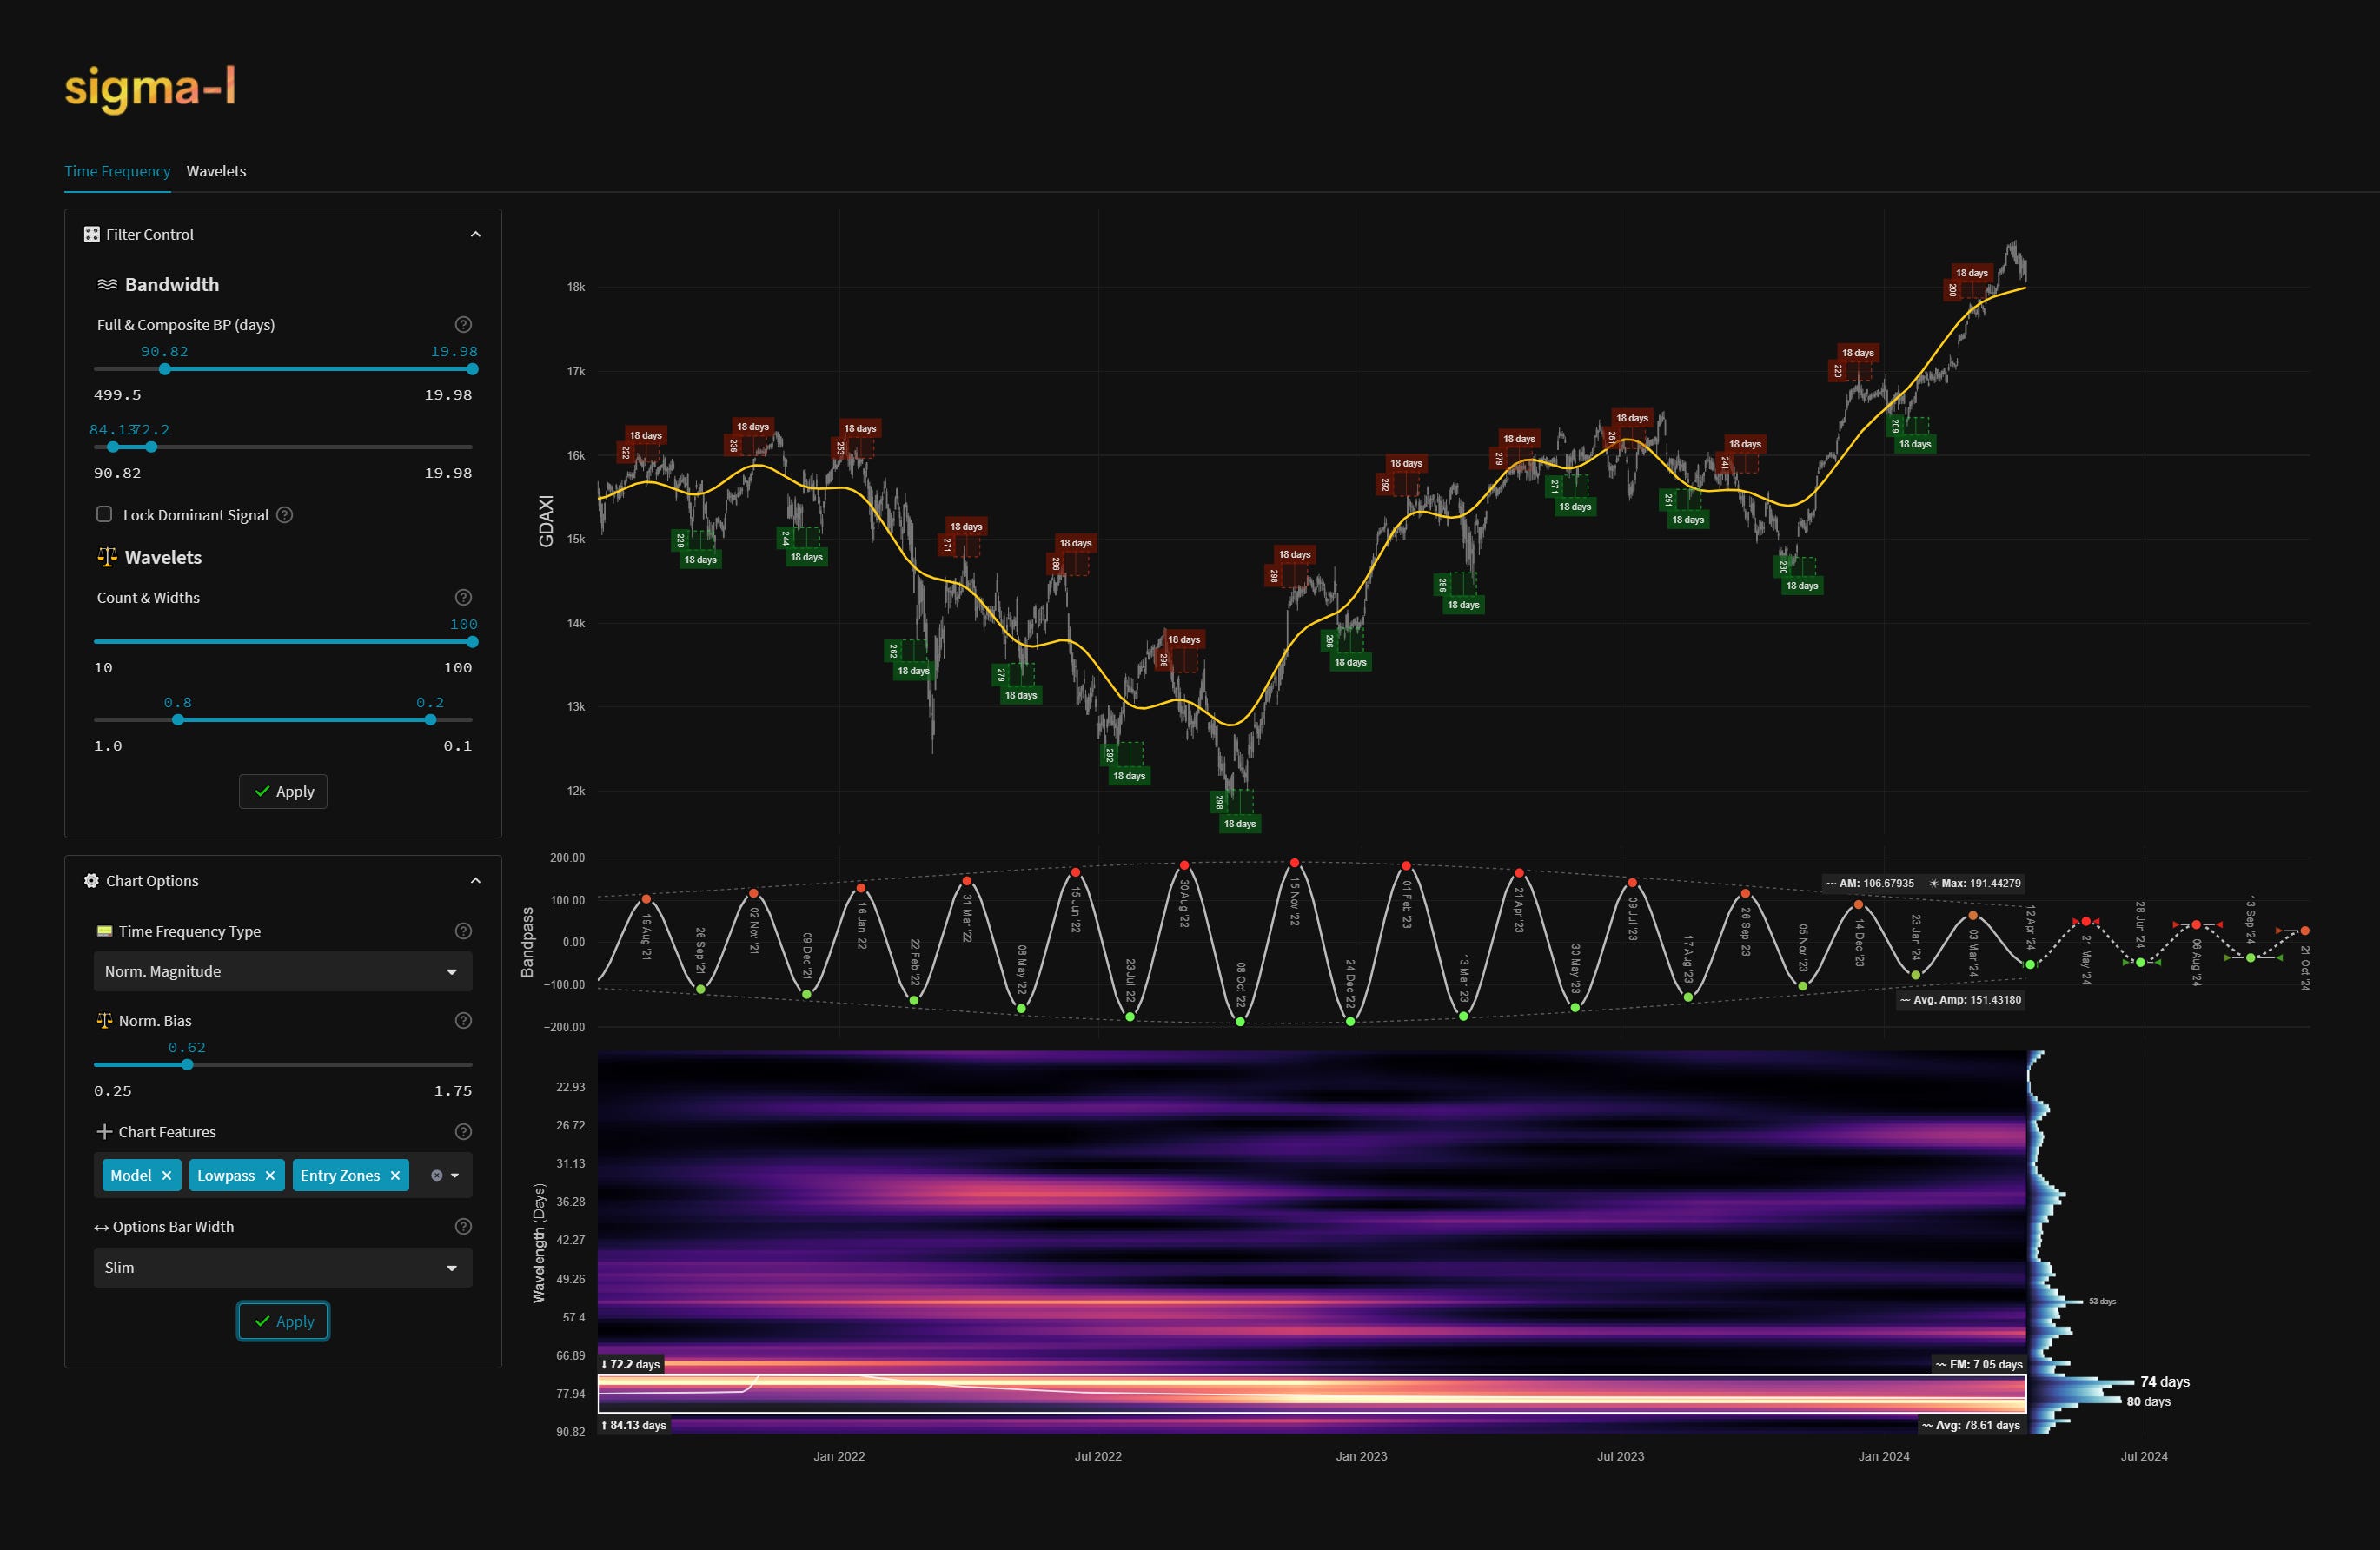
Time Frequency Analysis
Time frequency charts (learn more) below will typically show the cycle of interest against price, the bandpass output alone and the bandwidth of the component in the time frequency heatmap, framed in white. If a second chart is displayed it will usually show high-passed price with the extracted signal overlaid for visual clarity.