ΣL December 2023 Results & January 2024 Preview
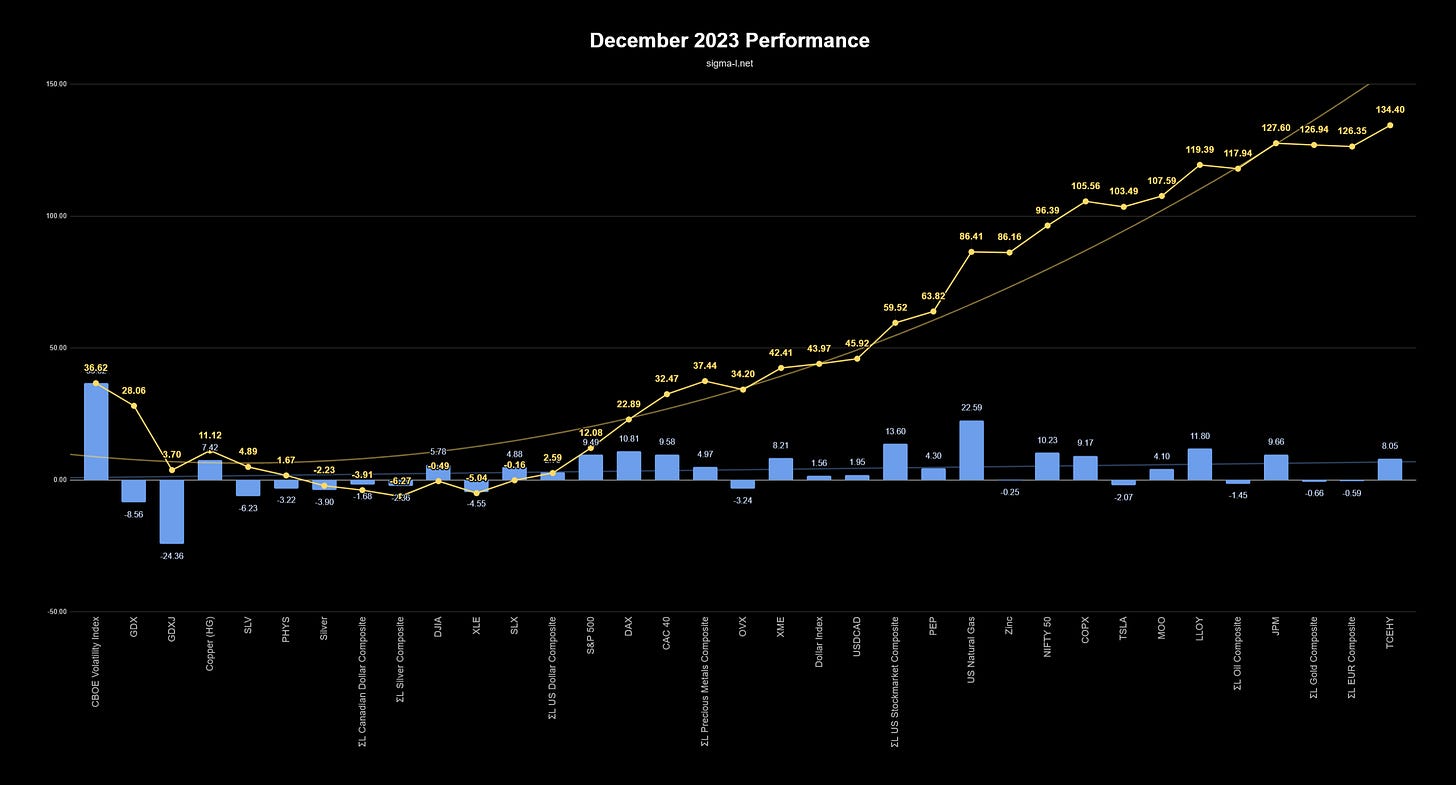
The Sigma-L portfolio saw a nominal gain of 134.40% (normalised 17.74%) in December 2023, across 35 trades. We take a look at the detail in this report and look forward to January 2024
ΣL December 2023 Performance
Covering trade reports posted in December 2023 on Sigma-L.
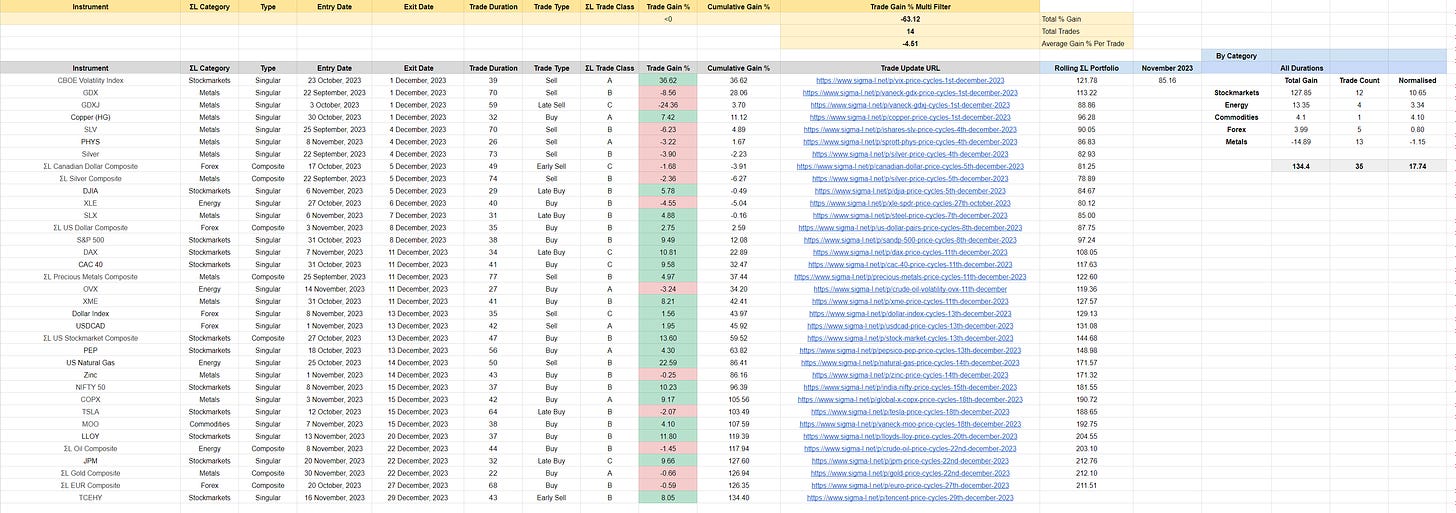
View the full trade list and details in Google Sheets
Headline Numbers
Sigma-L Nominal vs Benchmarks - December 2023
S&P 500 (4.46%): 129.94%
Gold (-0.47%): 134.87%
WTI Crude Oil (-6.06%): 140.46%
Bitcoin (12.58%): 121.82%
Monthly Breakdown


Total Nominal Gain: 134.40%
Total Normalised Gain: 17.74%
Total Trades: 35
Win:Loss Ratio: 1.5:1 (21:14)
Average Gain Per Trade: 3.84%
Win Percentage: 67%
Average Win: 9.41% / Average Loss: -4.51%
Average Duration: 45 Days
Breakdown by Direction & ΣL Category

Sell Side (Nominal)
Total Gain: 25.43% / Trade Count: 13 / Win:Loss Ratio: 1.2:1 (7:6)
Average Gain Per Trade: 1.96%
Win Percentage: 54%
Average Win: 12.62% / Average Loss: -7.19%
Average Duration: 54 Days
Biggest Win: 36.62% → Sell - CBOE Volatility Index 1st December 2023
Biggest Loss: -24.36% → Late Sell - GDXJ 1st December 2023
Buy Side (Nominal)
Total Gain: 108.97% / Trade Count: 22 / Win:Loss Ratio: 2.1:1 (15:7)
Average Gain Per Trade: 4.95%
Win Percentage: 68%
Average Win: 8.12% / Average Loss: -1.83%
Average Duration: 40 Days
Biggest Win: 13.60% → Buy - ΣL US Stock Market Composite 13th December 2023
Biggest Loss: -4.55% → Buy - XLE 27th October 2023Nominal / Normalised Gain By ΣL Category (Trade Count)
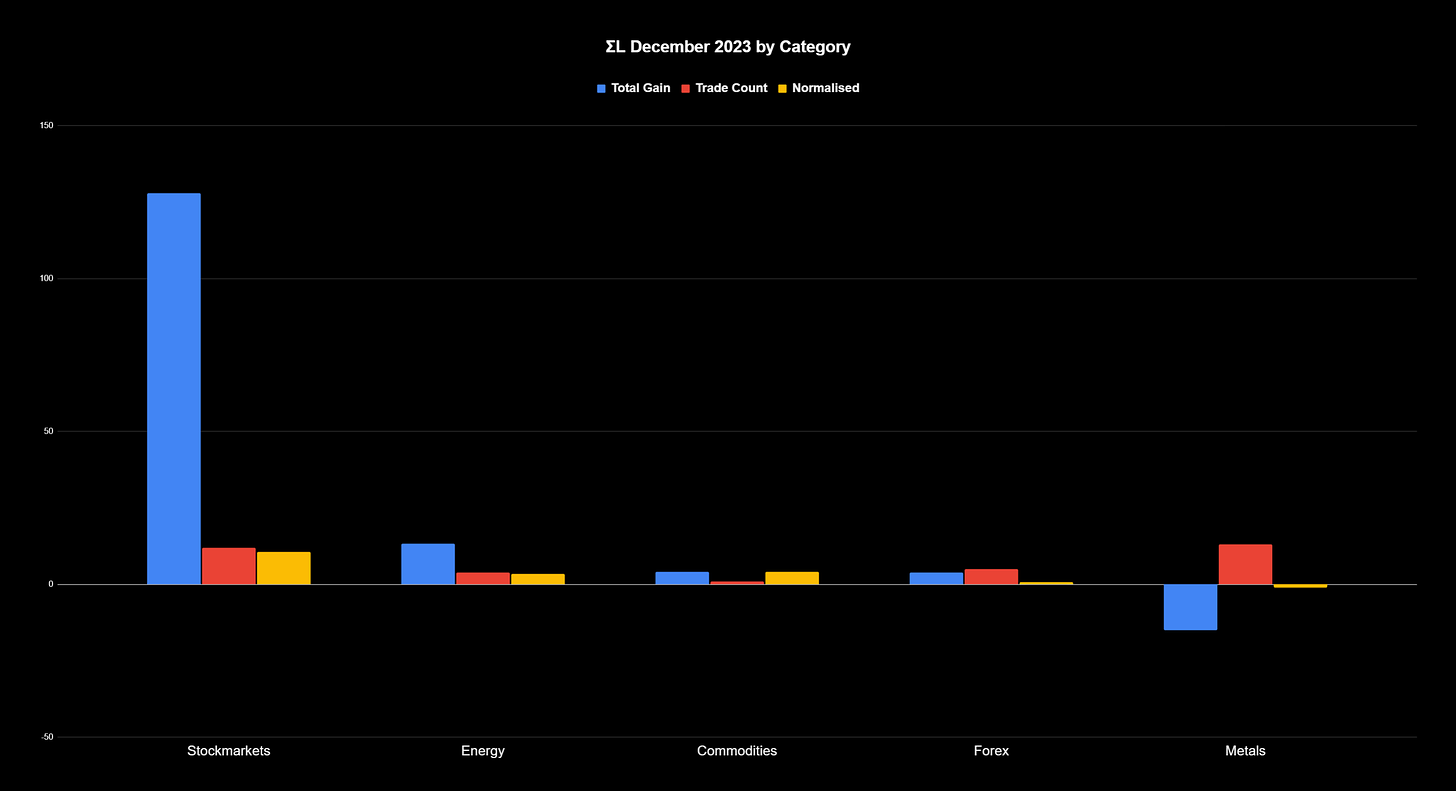
Stock Markets: 127.85% / 10.65% (12)
Energy: 13.35% / 3.34% (4)
Commodities: 4.10% / 4.10% (1)
Forex: 3.99% / 0.80% (5)
Metals: -14.89% / -1.15% (13)
Cryptocurrency: no trades
Dates for your Diary - January 2024
December 2023 Recap
A busy December was dominated by the move up in stock markets, from which subscribers would have benefited via the excellent 80 day nominal wave, shown here for the S&P 500 in late October. This wave, easily discerned on a time frequency analysis, likely troughed in late October / early November, in synchrony with larger components, most notably the 20 and 40 week nominal waves. The move from the incoming trough (~ 77 days) of the aforementioned shorter wave will be interesting to watch in January.
We begin 2024 with a streamlined list of instruments/assets, from which the vast majority of markets derive their price action and which should provide some excellent opportunities as the year unfolds. If you have not already, please join us for the duration and support this kind of unique analysis - you will be most welcome.
Don’t Miss..
Tuesday 9th January - S&P 500 77 Days
After the tremendous up leg of this component from late October, price has started, in recent days, the move to the next trough. Highly likely to be a higher low than the trough in late October, the subsequent move up will be one to watch for. Amongst our list of stock markets we report on, the S&P 500 is the first of the month.
Monday 15th January - US Dollar Index 78 Days
The Dollar Index is on it’s way down but of course price never moves in a linear fashion (well, unless it’s the stock market through November/December 2023!). Following a trough of this component recently we will be looking at the peak mid January. Clearly the USD affects many other instruments so this will be key to note.
Friday 19th January - Copper 165 Days
Subscribers are likely familiar with the shorter wave in Copper, a superb signal around 78 days average wavelength. It’s longer brother, however, is equally superb, last troughing in October and nearing a peak mid - late January. Watch out for an update on this one.
Wednesday 24th January - ΣL Gold Composite 56 Days
The beacon signal in gold over the last couple of years has encountered a brief period of modulation in the last few iterations. Peaking recently and due a trough mid-late January, subscribers will be keen to get in on a potential long for the coveted metal.


Very Interesting, how do you trade these? Position sizing all the same?