


DJIA: Hurst Cycles - 1st November 2022
A bullish move from a low on the 13th October increases the likelihood of the much anticipated 18 month nominal low having occurred. We look at the new evidence and the phasing outlook

Tools required: Nominal Model | FLD | FLD Trading Strategy | FLD Trading Strategy (Advanced) | Principle of Nominality | Underlying Trend
Analysis Summary
In our last report we anticipated the low of the 18 month component and discussed whether it may actually be at the proposed 40 day nominal component low in mid October.
This has now proved likely to be the case with a very bullish move up in late October befitting a low of at least 20 week magnitude. By the principle of synchronicity, this may well also be the 18 month nominal low:
From 30th September Report:
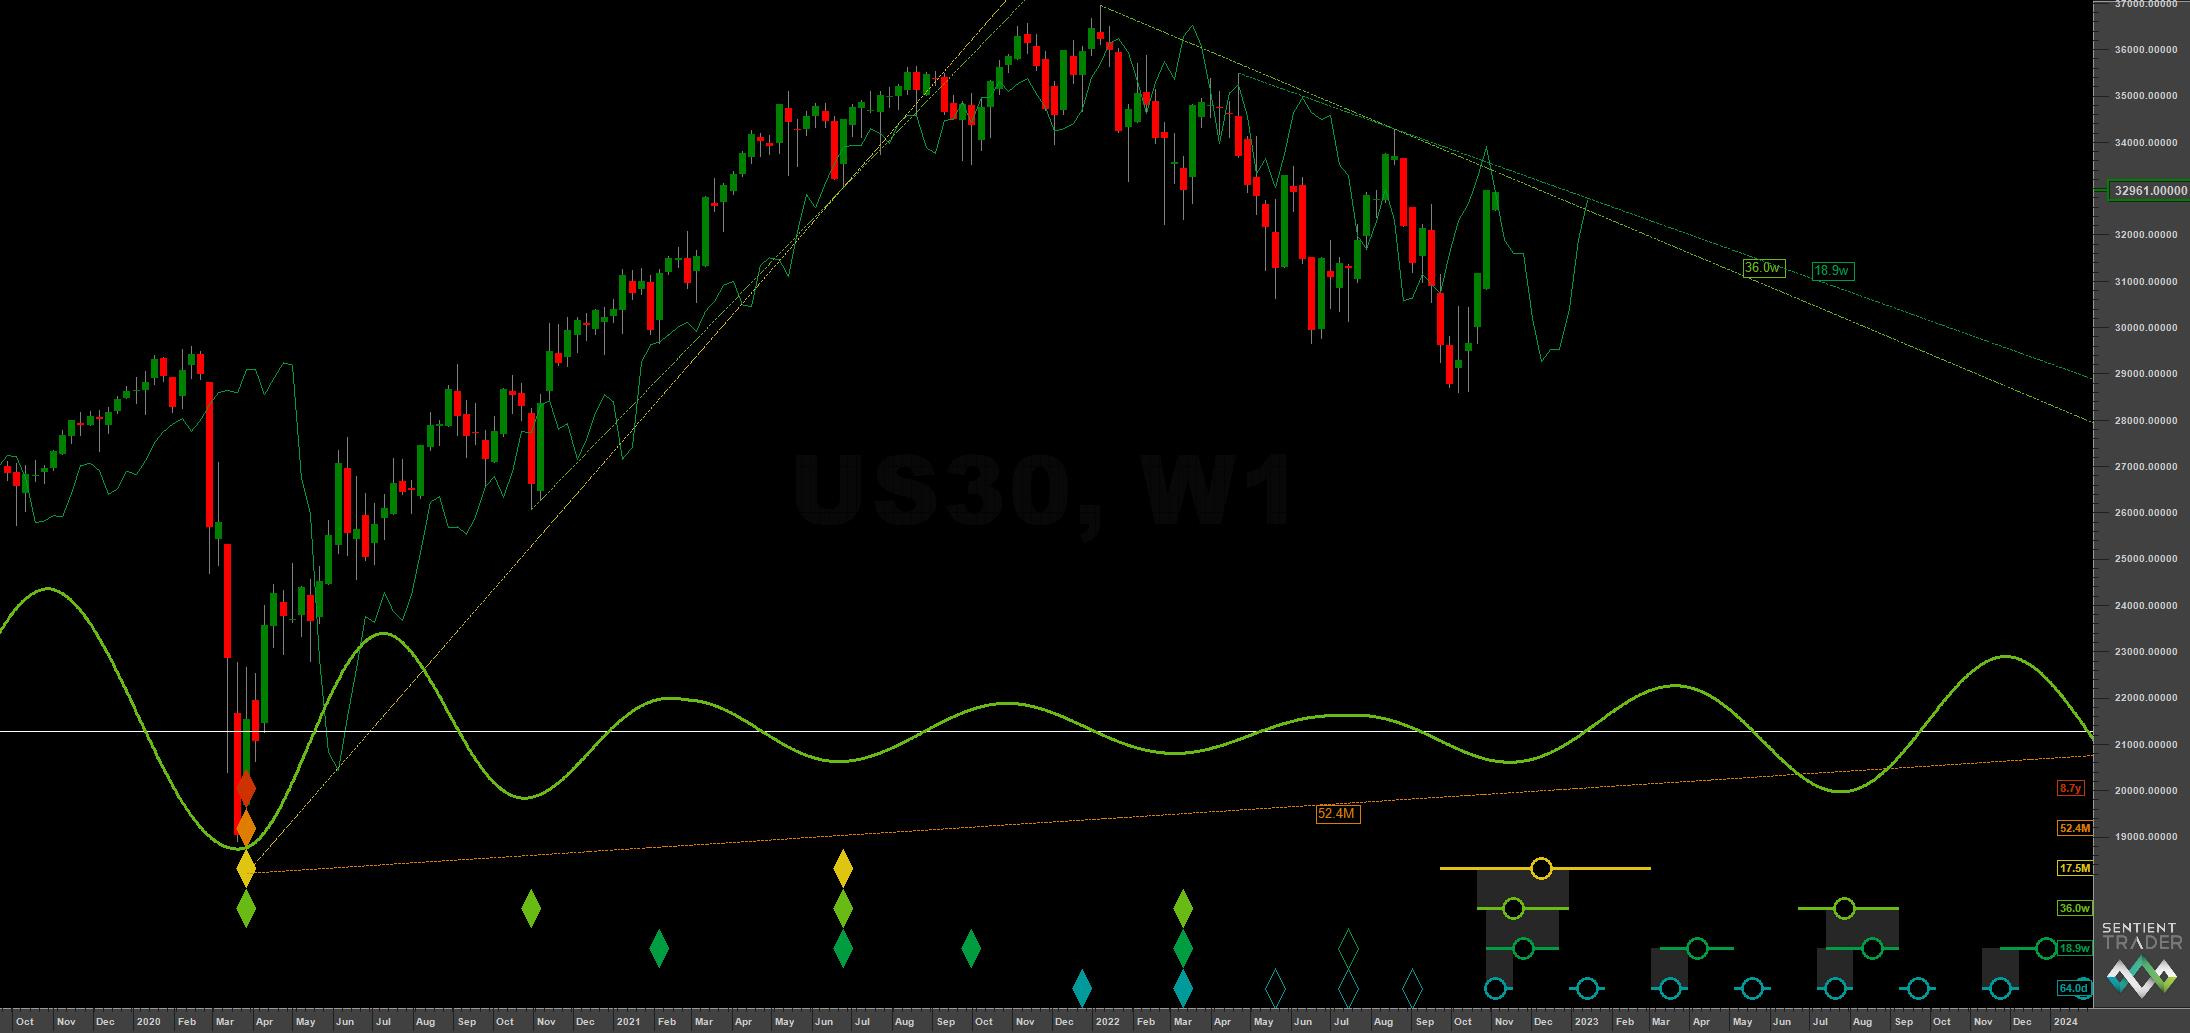
At the medium term the 20 week component is visually apparent in the decline from early 2022 and is expected to trough with support from the 54 month FLD (orange) mid-late October. By the principle of synchronicity this should also be the 18 month nominal low, according to the current phasing.
What is interesting now is how this next 20 week component unfolds in cyclical terms via price action. The initial move has been exuberant, in fact the DJIA has had one of the most bullish reactions of all global equity indices, due to it’s composition. If price forms a fairly neutral 20 week component (perhaps a slightly higher low) then the longer term bearish outlook via the current long term phasing is likely correct.
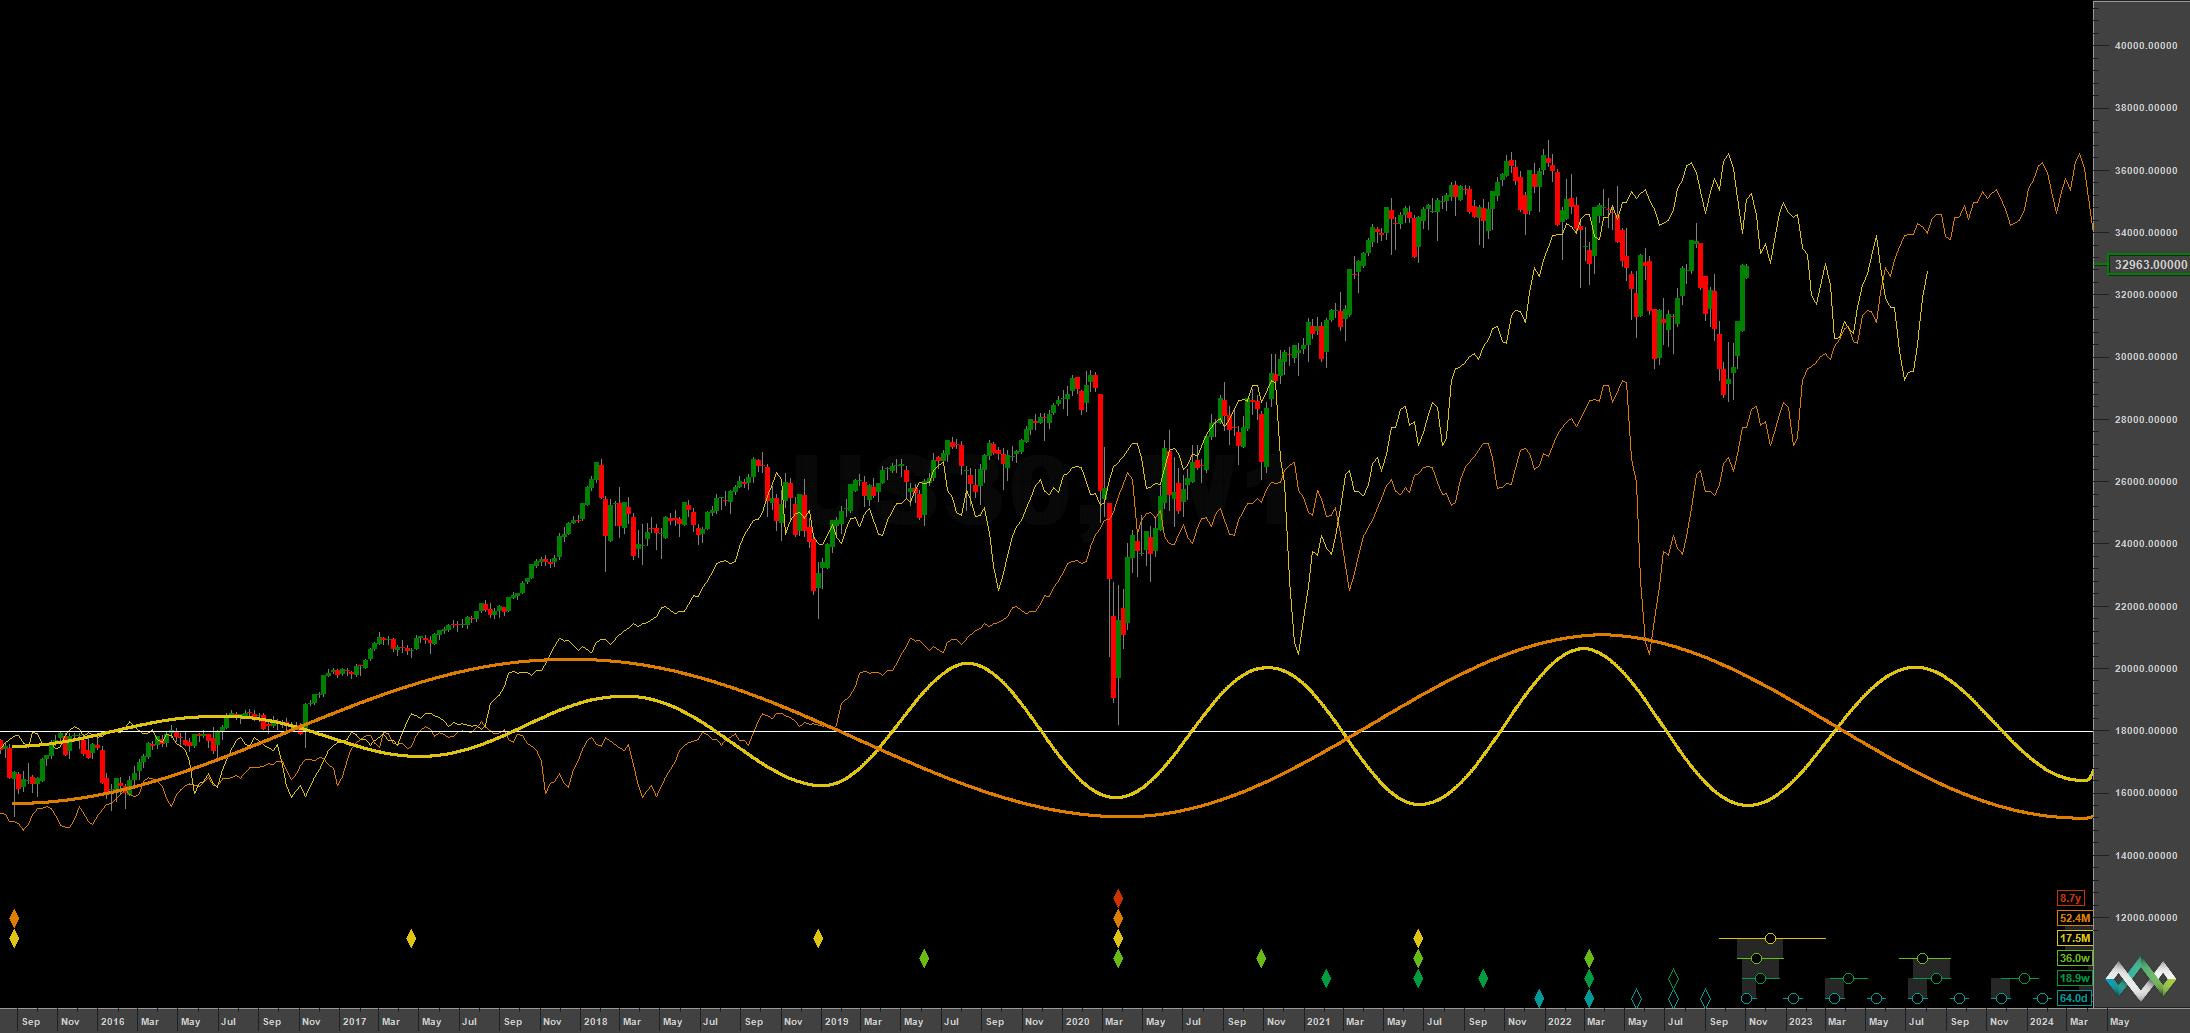
Price is currently at the 20 week FLD and will likely find resistance here. A significant further move up to test the highs would be unlikely and call into question the longer term phasing. The 18 month FLD (yellow, long term chart) is likely to form significant resistance in this cycle, prefacing the final move down through 2023 into early 2024 for the anticipated 54 month nominal low as phased.
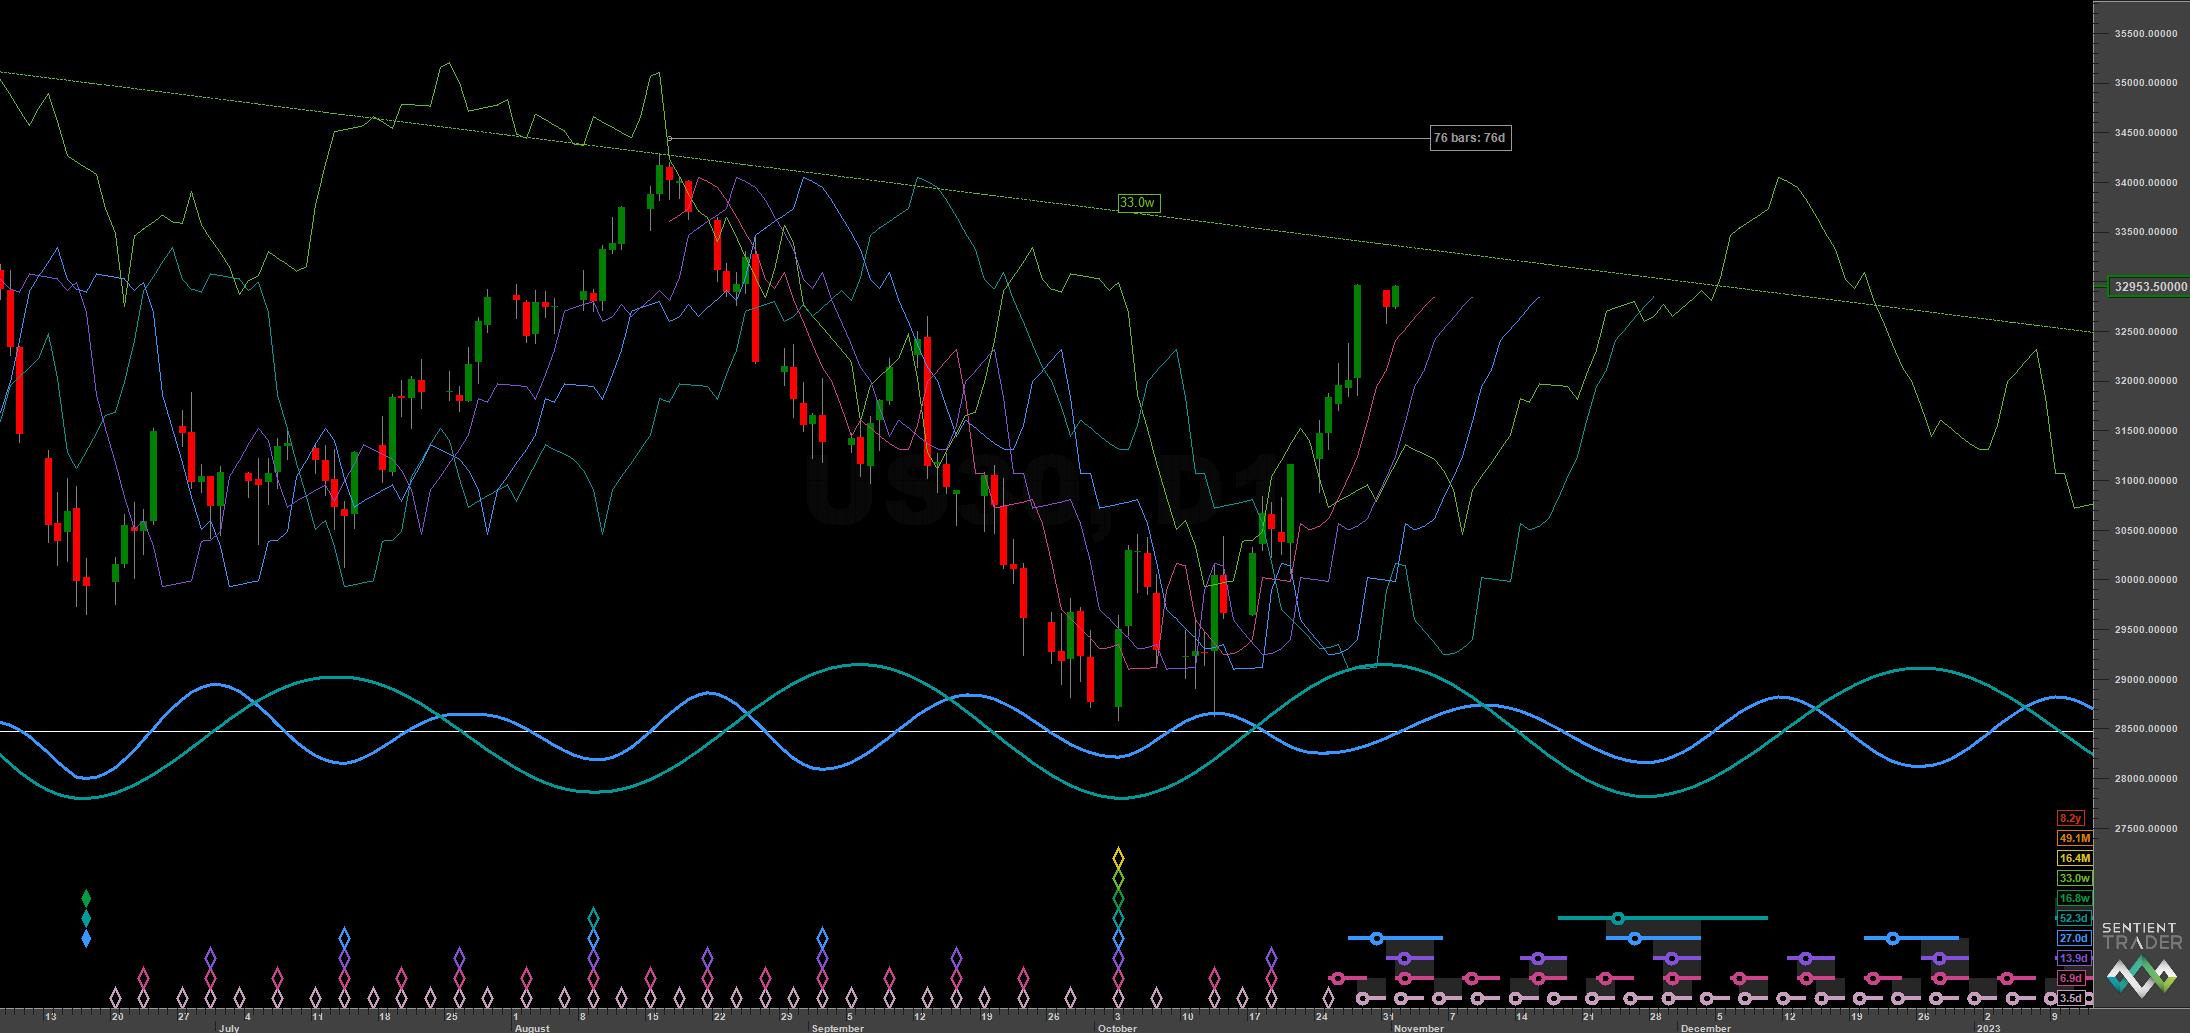
The shorter term picture suggests an 80 day nominal peak is forming with several FLDs lining up in a bearish cascade. At this point in the 18 month component cycle we might expect support for the 80 day nominal low to come in at the 40 week FLD, shown on the short term chart in green at around the 31000 - 31500 area.
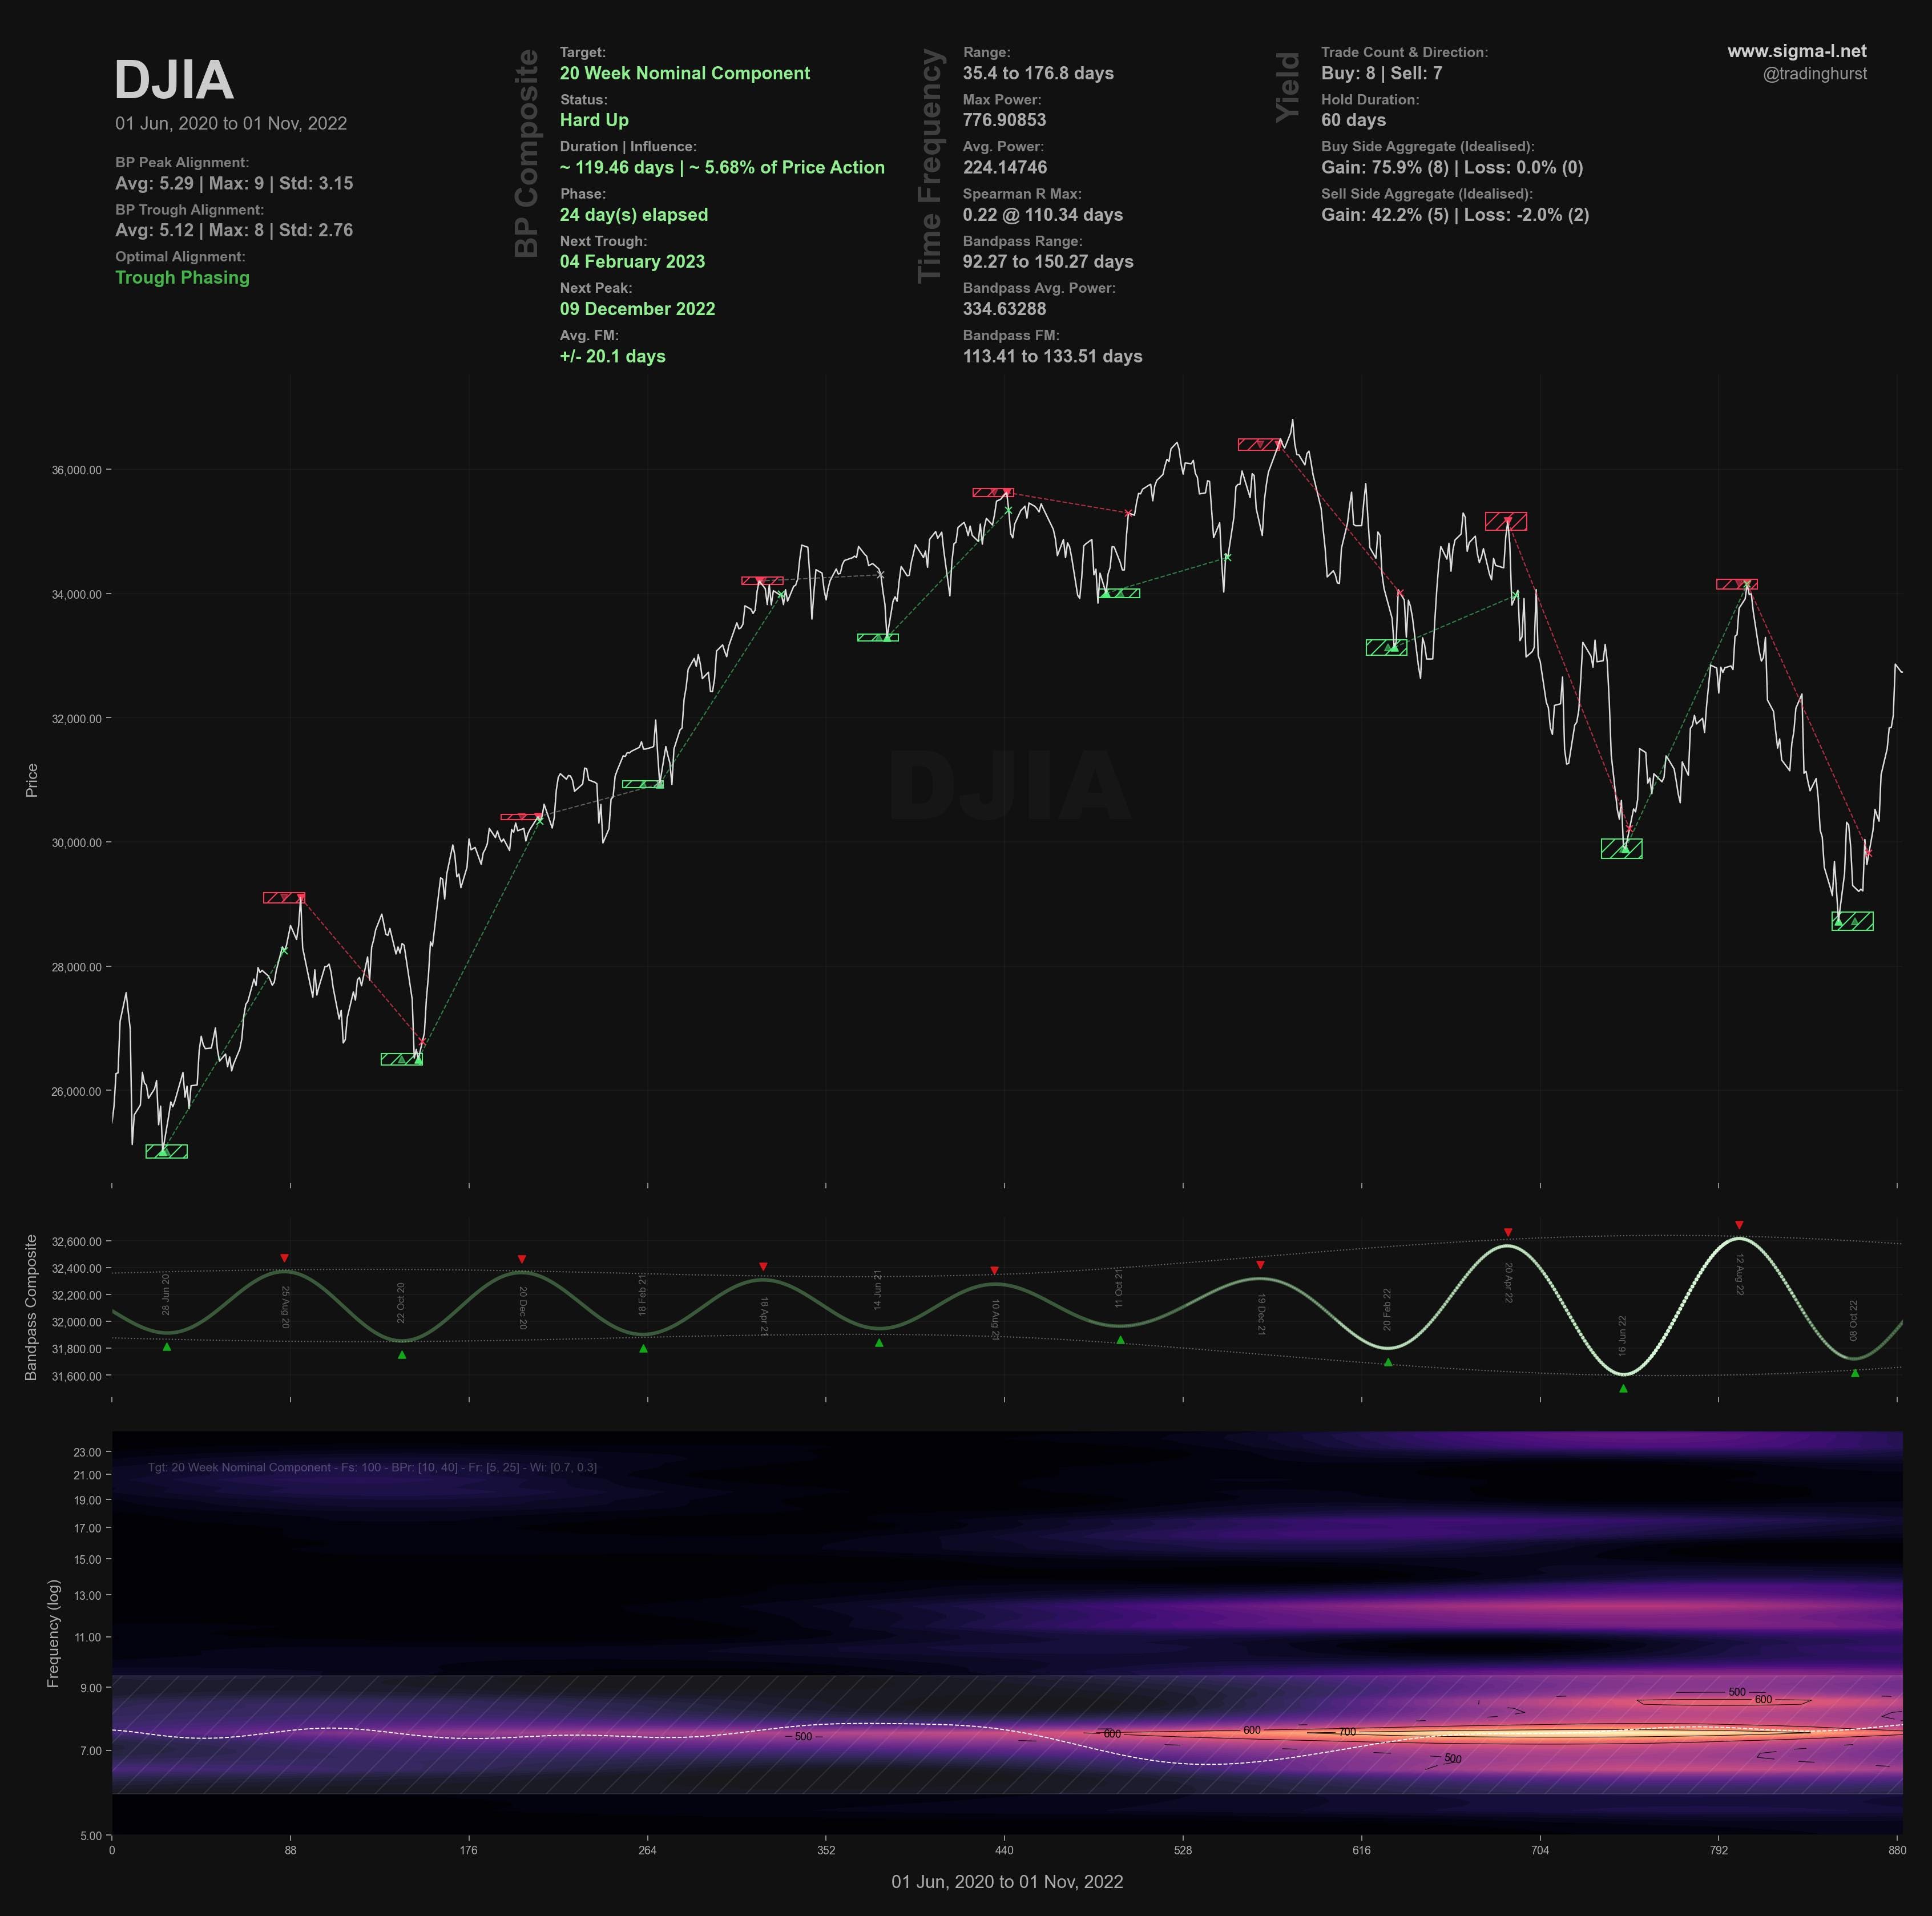
The subsequent move up in December will then dictate the shape of the 20 week component, a crucial marker for 2023’s prospects and due to trough late January / early February, as shown on the time frequency analysis below.
Phasing Analysis
Long Term
Components greater than and including the 18 month nominal cycle
Medium Term
Components less than and including the 18 month nominal cycle
Short Term
Components around the 80 day nominal cycle
Time Frequency
Wavelet convolution output targeting 20 week nominal component
Trading Strategy
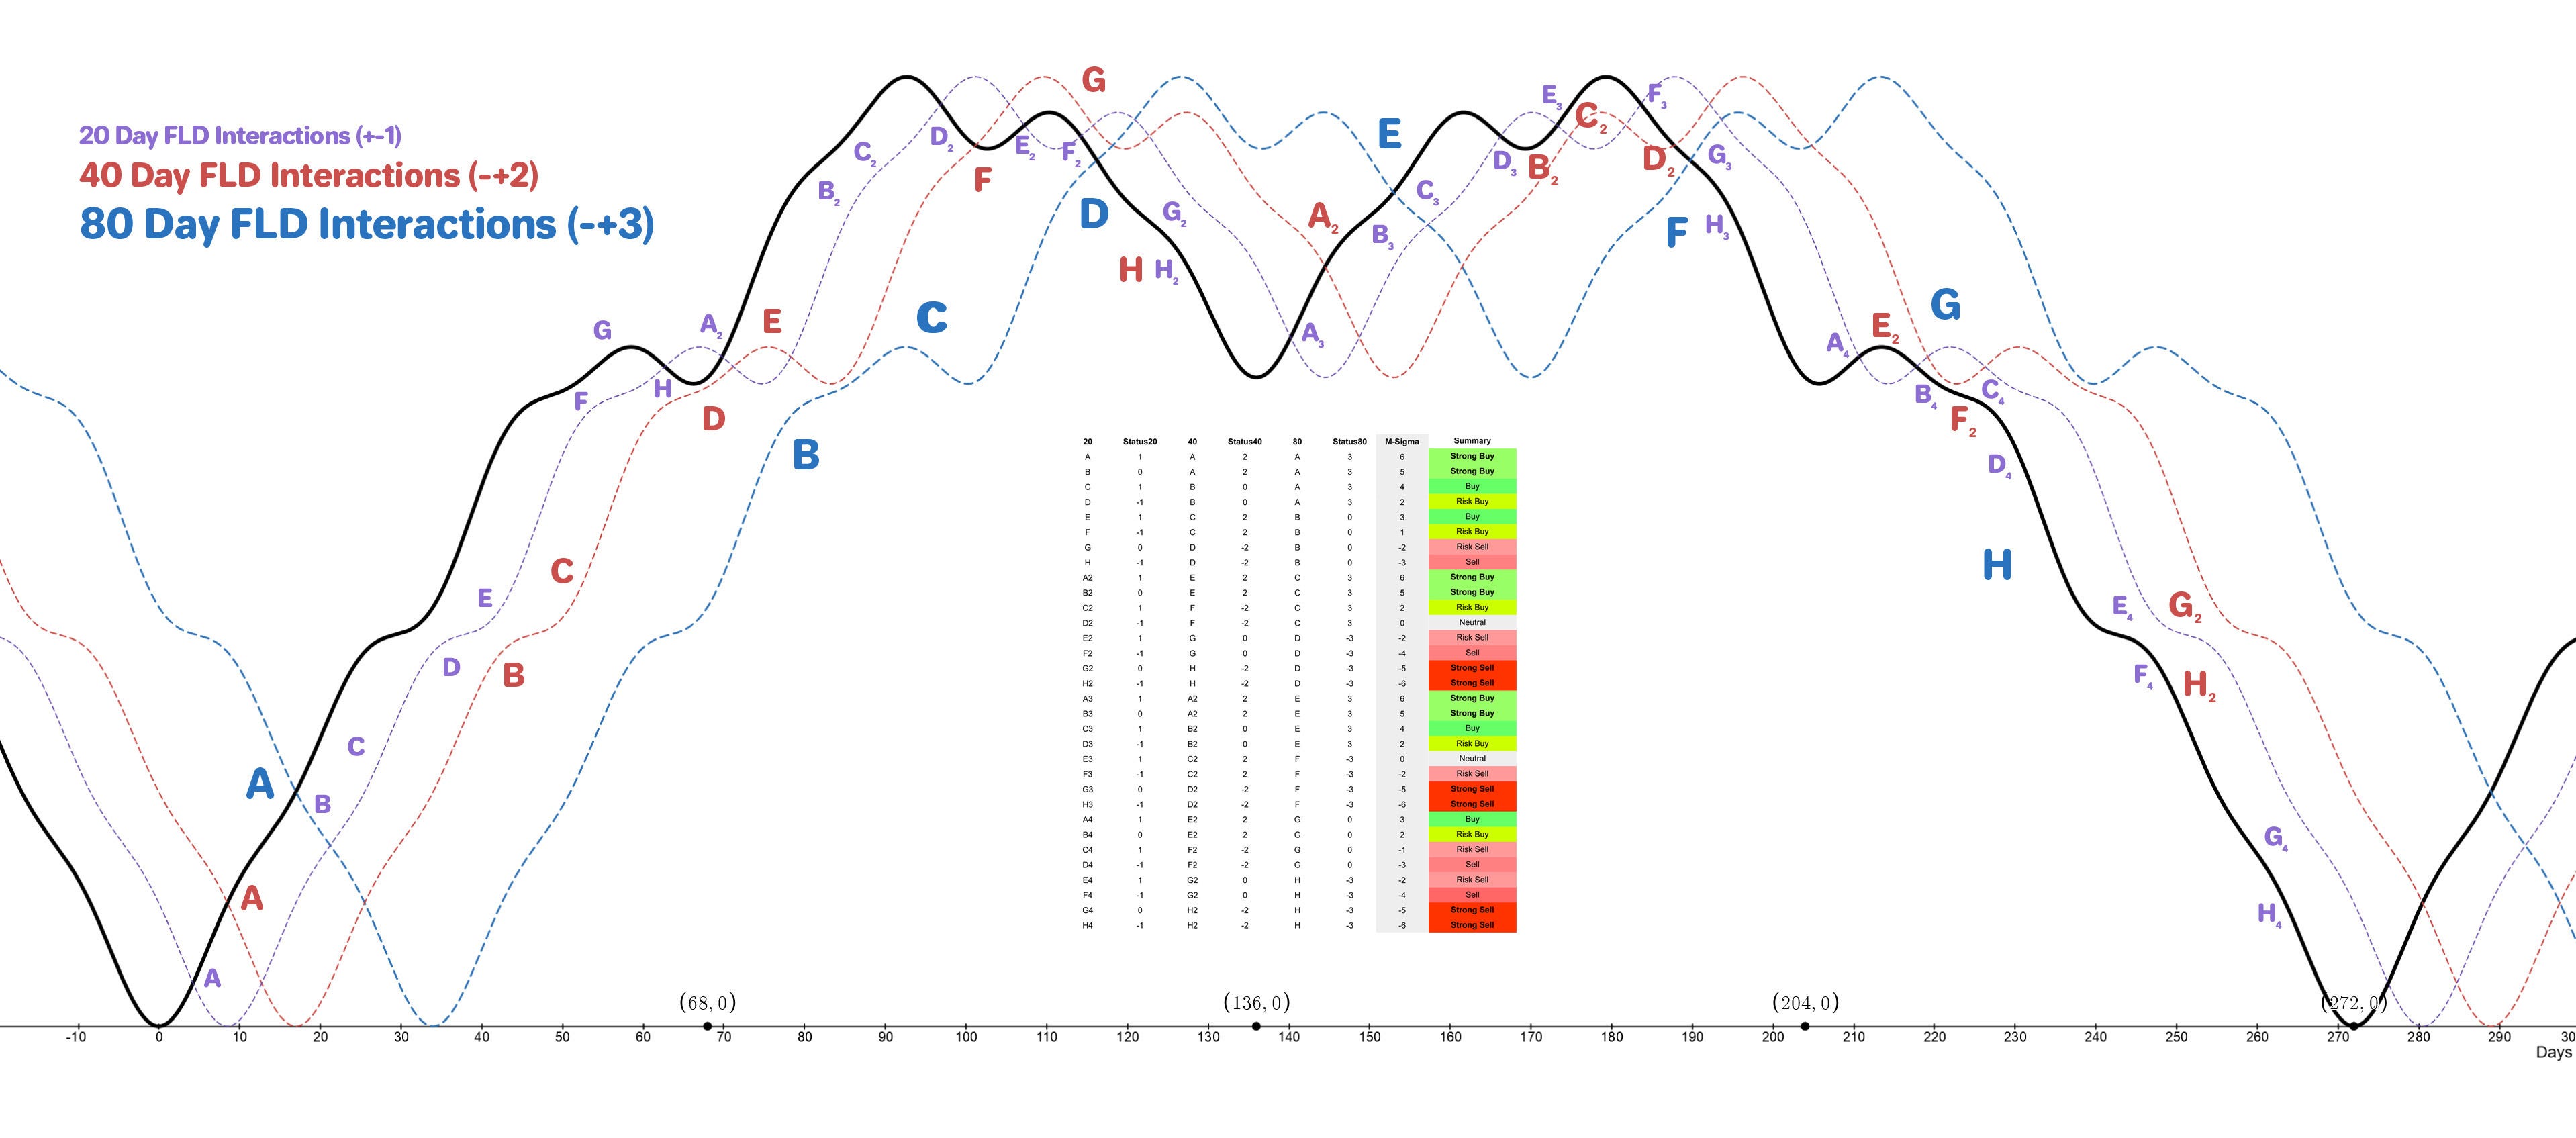
Interaction Status
Interactions and price in the FLD Trading Strategy (Advanced). This looks at an idealised 40 week cycle and an array of 3 FLD signal cycles. We apply the instrument’s phasing to the model and arrive at an overall summary for the interactions with the 20 day FLD, current and forthcoming.
Sigma-L recommendation: Sell
Entry: 10 Day FLD / 20 Day FLD
Stop: Above forming 80 day nominal peak
Target: 31000 - 31500
Reference 20 Day FLD Interaction: D / F
Underlying 40 Day FLD Status: D
Underlying 80 Day FLD Status: B
The incoming 20 day interaction given above may be either a D or F, depending on whether the 40 day component low has occurred and has been heavily attenuated by the recent sharp move up. Either way, the direction is the same.
The 40 week FLD is below price at around 31000 to 31500 and is a valid target for this trade. The 80 day nominal low is due at the start of December, according to the current phasing.
FLD Settings
If you do not have the use of Sentient Trader use these settings to plot FLDs in your trading software (daily scale) to more easily follow trading signals and strategy from Sigma-L.
Make sure to account for non-trading days if your broker omits them in the data feed (weekends, for example). The below offsets are given with no added calculation for non-trading days.
80 day nominal: 64 days | 32 day FLD offset
40 day nominal: 29.9 days | 15 day FLD offset
20 day nominal: 14.6 days | 7 day FLD offset
10 day nominal: 7.2 days | 4 day FLD offset
Correlated Exposure Options
A non exhaustive list of correlated instruments for consideration
SPDR Dow Jones Industrial Average ETF Trust DIA 0.00%↑
Global X Dow 30 Covered Call ETF DJIA 0.00%↑
iShares Dow Jones U.S. ETF IYY 0.00%↑