


US Dollar Index - 4th March 2024 | @ 80 Days | - 1.49%
Last trade: - 1.49% | 'C' class signal detected in US Dollar Basket / Index. Running at an average wavelength of 80 days over 13 iterations since May 2021. Currently troughing.


ΣL Cycle Summary
This component continues to be attenuated and is inferior in it’s signal quality to the excellent wave around 180 days, due to peak early-mid April. That wave, which last troughed in late December 2023 / early January 2024 is much more stationary at the time of writing. Regardless, this shorter component still occupies some power in a bandwidth below 100 days so is worthy of an update. A trough is due in the coming week or so with the next phased peak due in April, likely forming the aforementioned larger peak at around 180 days in a phase cluster. Readers should also take note of the very influential long term wave around 600 days, featured recently and which is hard down.
Trade Update
See also: Live ΣL Portfolio & History
Summary of the most recent trade enacted with this signal and according to the time prediction detailed in the previous report for this instrument, linked below.
Type: Sell - US Dollar Index 15th January 2024
Entry: 15th January 2024 @ 102.59
Exit: 4th March 2024 @ 104.12
Gain: - 1.49%
Before and After
Signal comparison between our last report and the current time, in chart format.
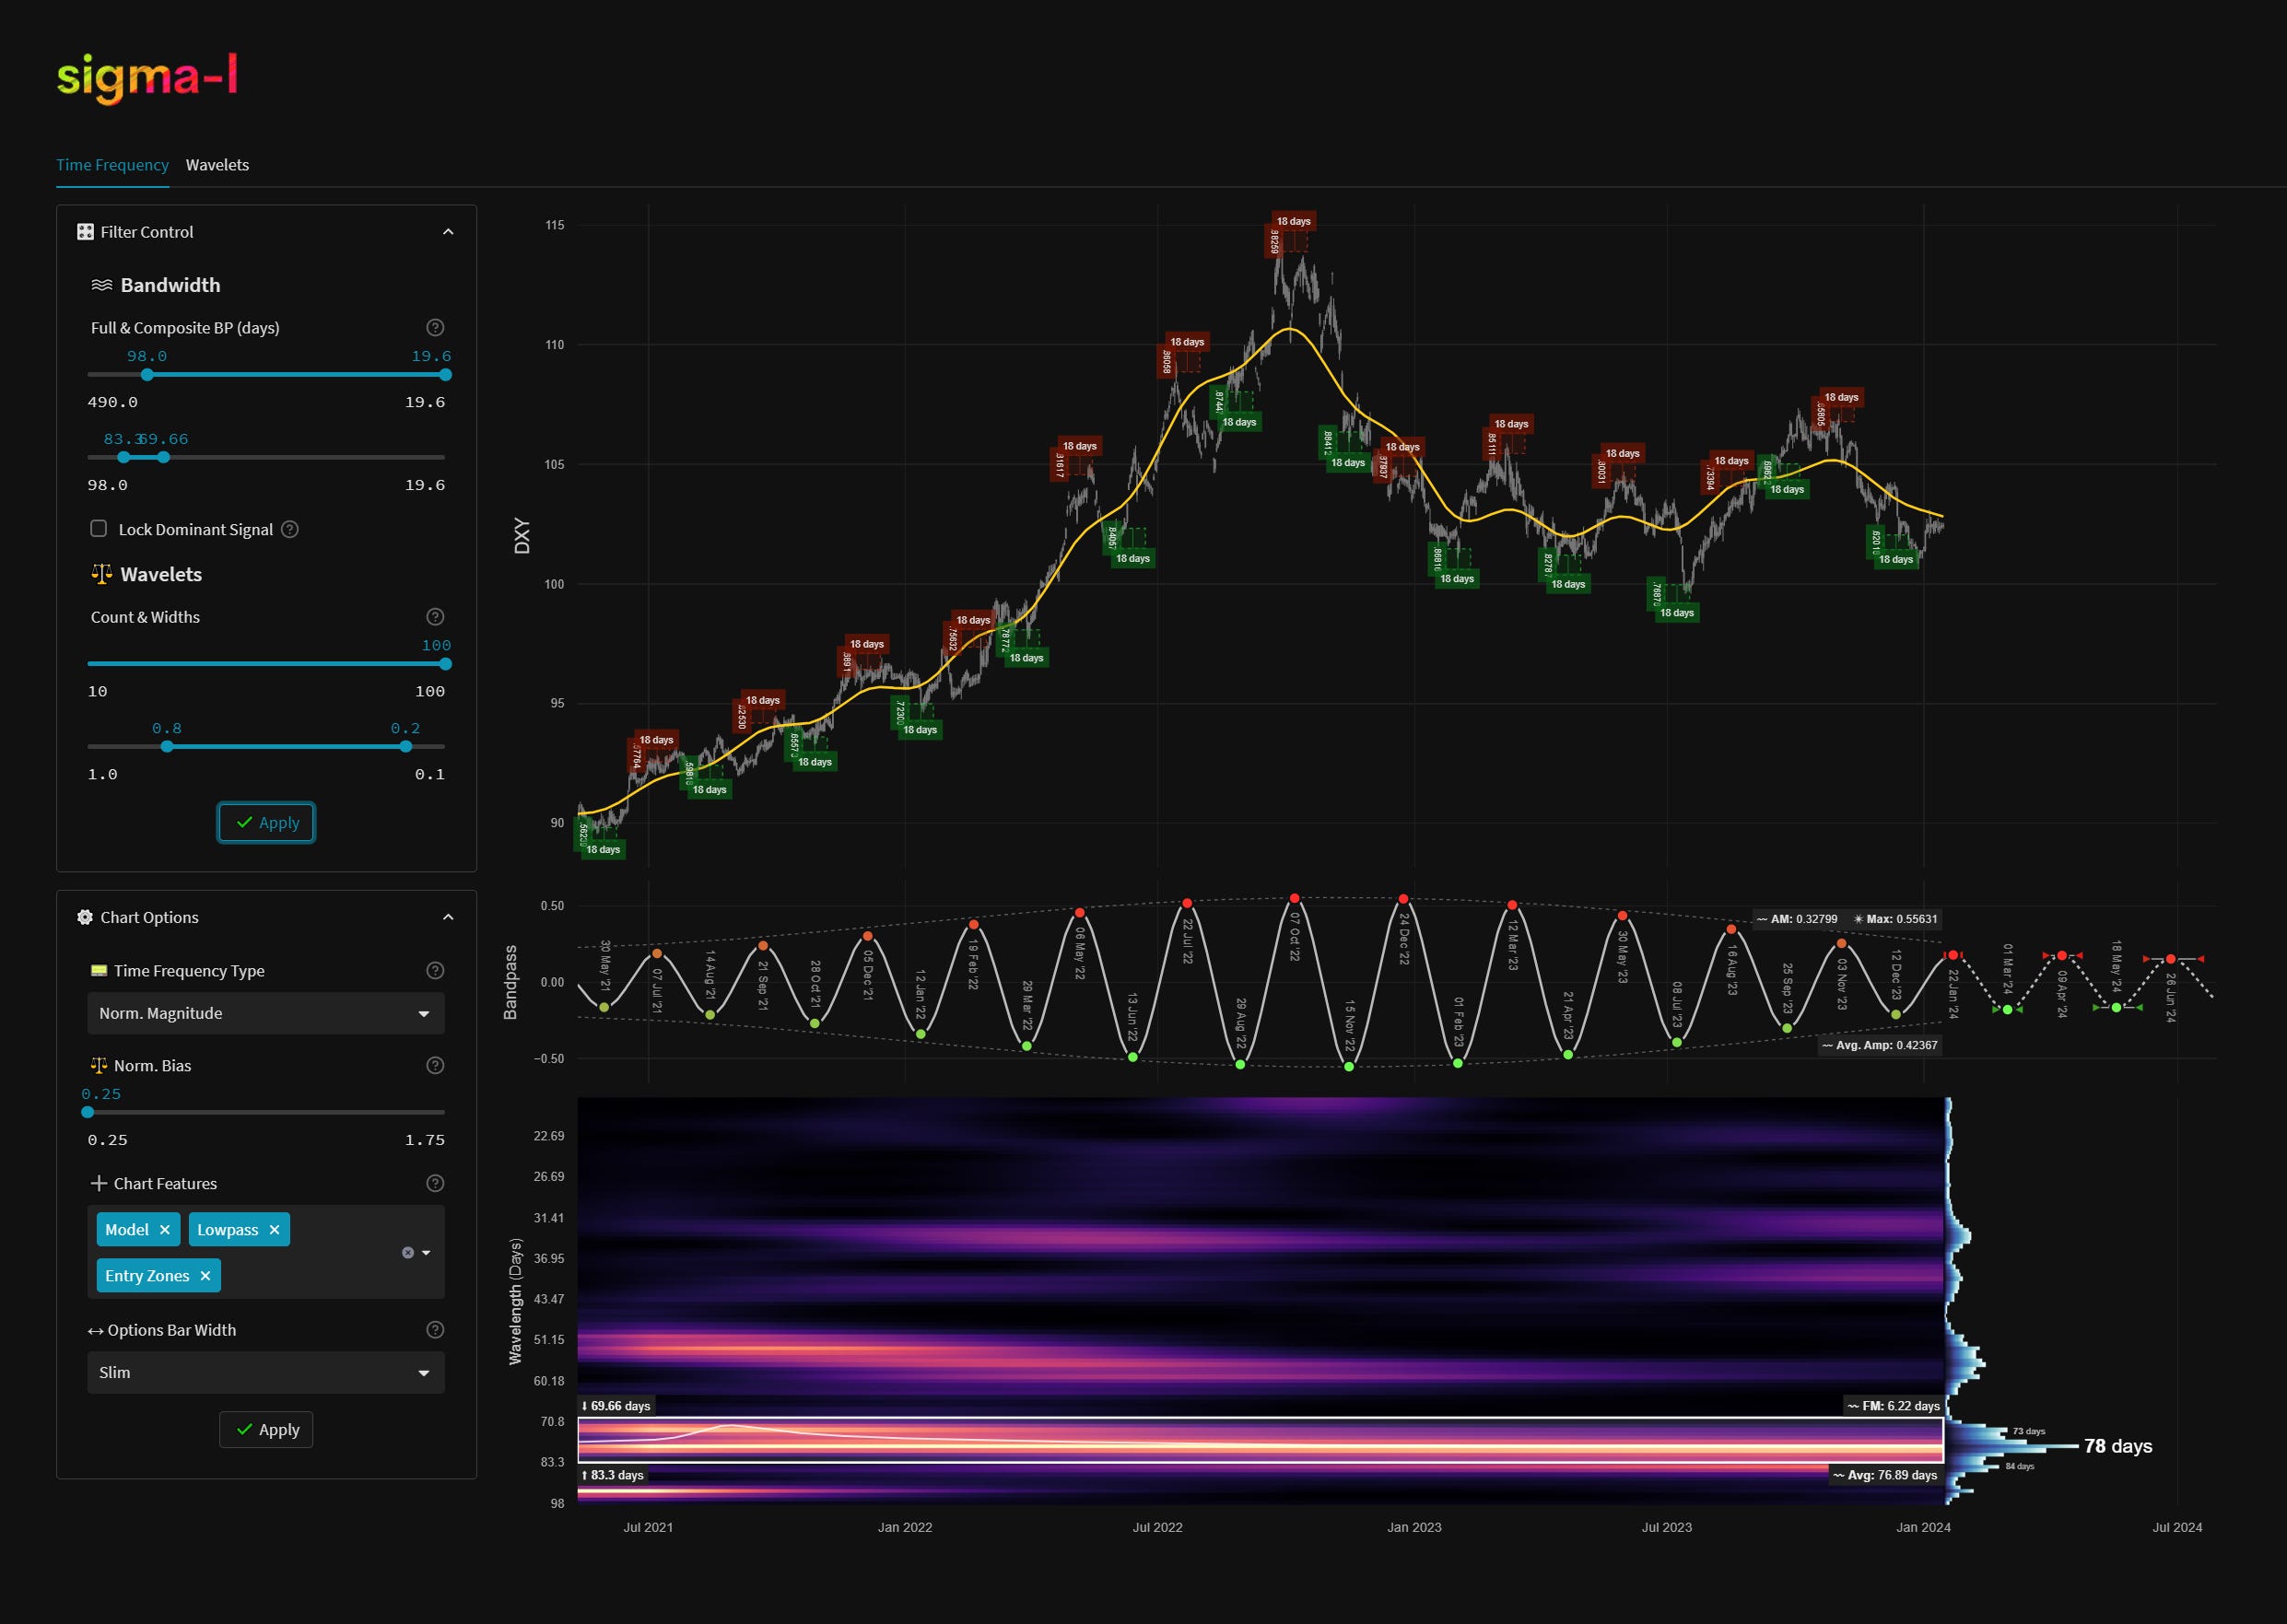

Time Frequency Analysis
Time frequency charts (learn more) below will typically show the cycle of interest against price, the bandpass output alone and the bandwidth of the component in the time frequency heatmap, framed in white. If a second chart is displayed it will usually show high-passed price with the extracted signal overlaid for visual clarity.