The FLD Revisited
We can use a simple low pass filter to improve trading signals from the humble FLD, find out how in this article.
Improving a Classic
One of the most useful tools in any toolkit for a Hurst Cycles devotee is the humble FLD. The simplicity combined with the powerful insight it can offer are extremely useful once a full phasing analysis has been performed and wavelengths derived.
The trading signals it can produce are good, robust and various strategies around crosses are available of course. However, the nature of market motion is composed of periodic components and totally random components. This random noise tends to increase as we move to lower timeframes and in our experience is highest at timeframes of less than 1 hour per bar. This makes sense as volume per bar is relatively lower and there is more chance (especially in an illiquid or overnight market) of rogue participants pushing price outside the range of what we expect the smoother, robust and periodic components to produce. This random nature of markets is something we accept as Hurst Cycles traders and is detailed by JM Hurst himself in ‘Profit Magic for Stock Transaction Timing’. A section where he also describes the periodic components rather awesomely as ‘x-motivation’!
Removing the Noise (some of it)
One of the benefits to studying Hurst Cycles on a deep level is an increased knowledge of signal processing techniques to improve trading strategies. We know in our pure price signal there is random, high frequency noise which can produce spurious spikes in price and even skew median price as a marker for FLD crosses. However, we can employ one of the most simple low pass filters to the FLD itself and attenuate a good proportion of the noisy components. Let’s see how.
Fire up the MA
The most simple low pass filter available to the majority of traders is the moving average. Of course we can employ all manner of digital filters to price action and we will be exploring many such approaches in future articles but to simply attenuate high frequencies on an FLD signal the moving average is perfect for our purpose.
If we take the example in the original humble FLD post, applied to the S&P 500 we can start to show how we approach smoothing a noisy FLD to taste.
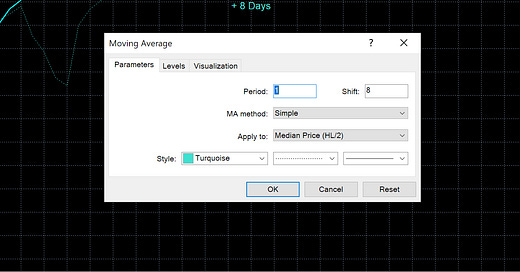
Plot your FLD with a moving average of period 1, applied to median price and projected forwards by the wavelength of the cycle component of interest, divided by 2. This should look similar to below where we have plotted the 20 day FLD for the 20 day nominal component, sampled to to be running at 16.5 days from the phasing analysis.
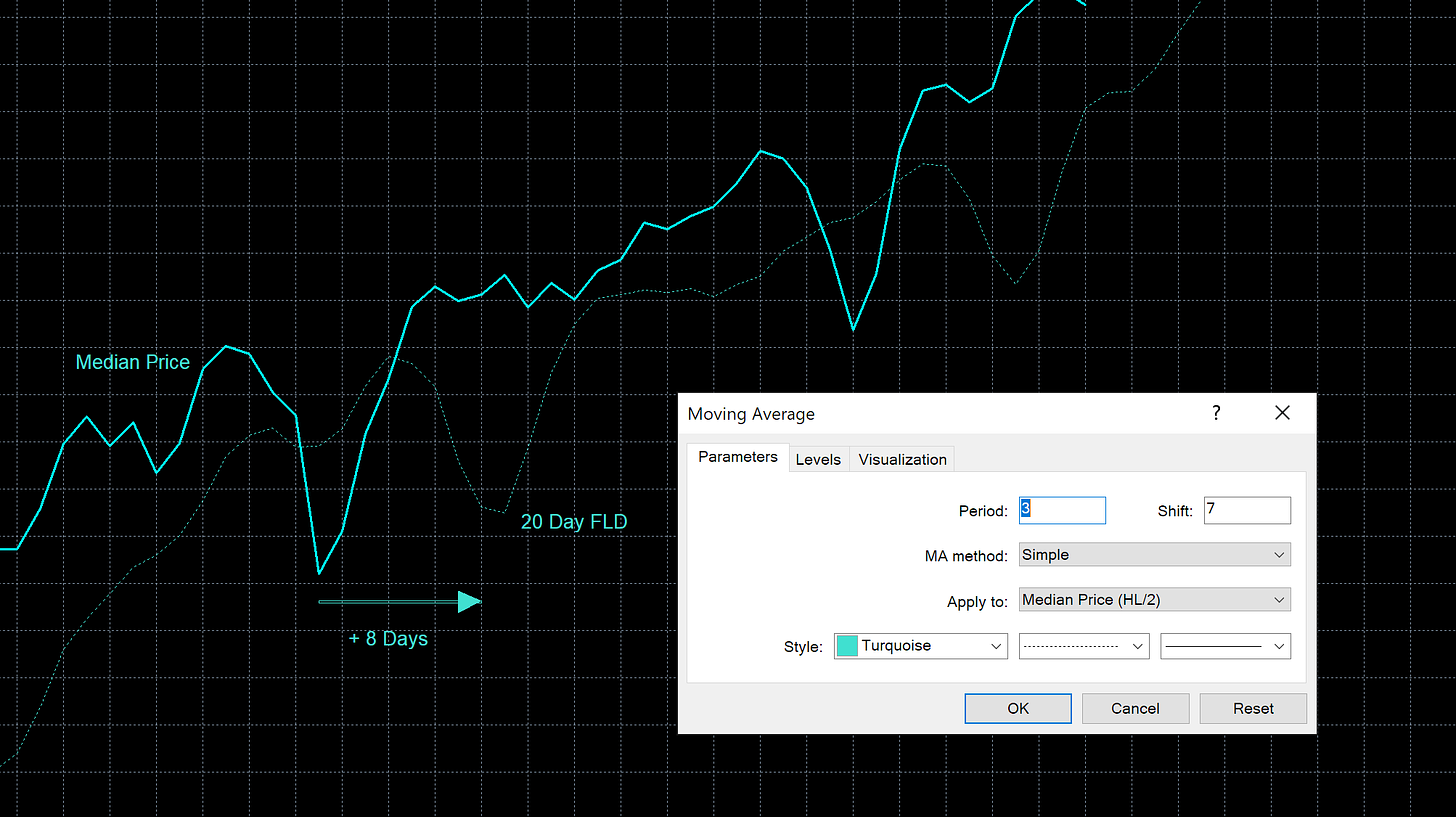
To apply low pass filtering to the FLD signal increase the period but only by an odd number, we will start at 3. You must now also account for digital filter lag which is an unavoidable tradeoff when using digital filters. Therefore we must shift the FLD back in time by the (period-1)/2. In the below case that is (3-1)/2 = 1. So the period is 3 and the horizontal shift becomes (8-1)=7. The FLD is smoothed and components with frequencies equal to and higher (2 day, 1 day etc..) than those of 3 day frequency are attenuated! Importantly the correct position of the FLD is maintained as we accounted for the filter lag inherent in the moving average calculation.
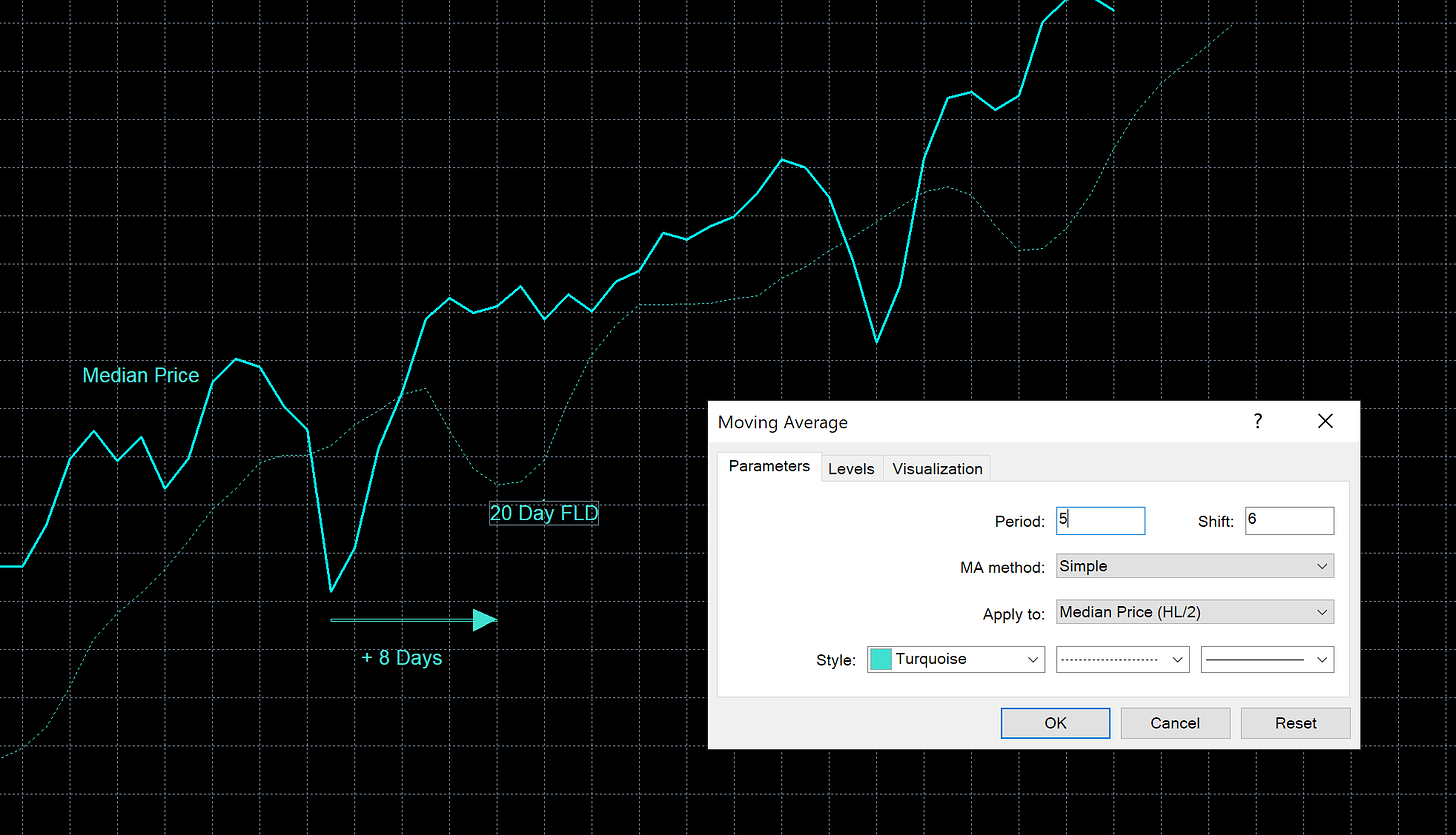
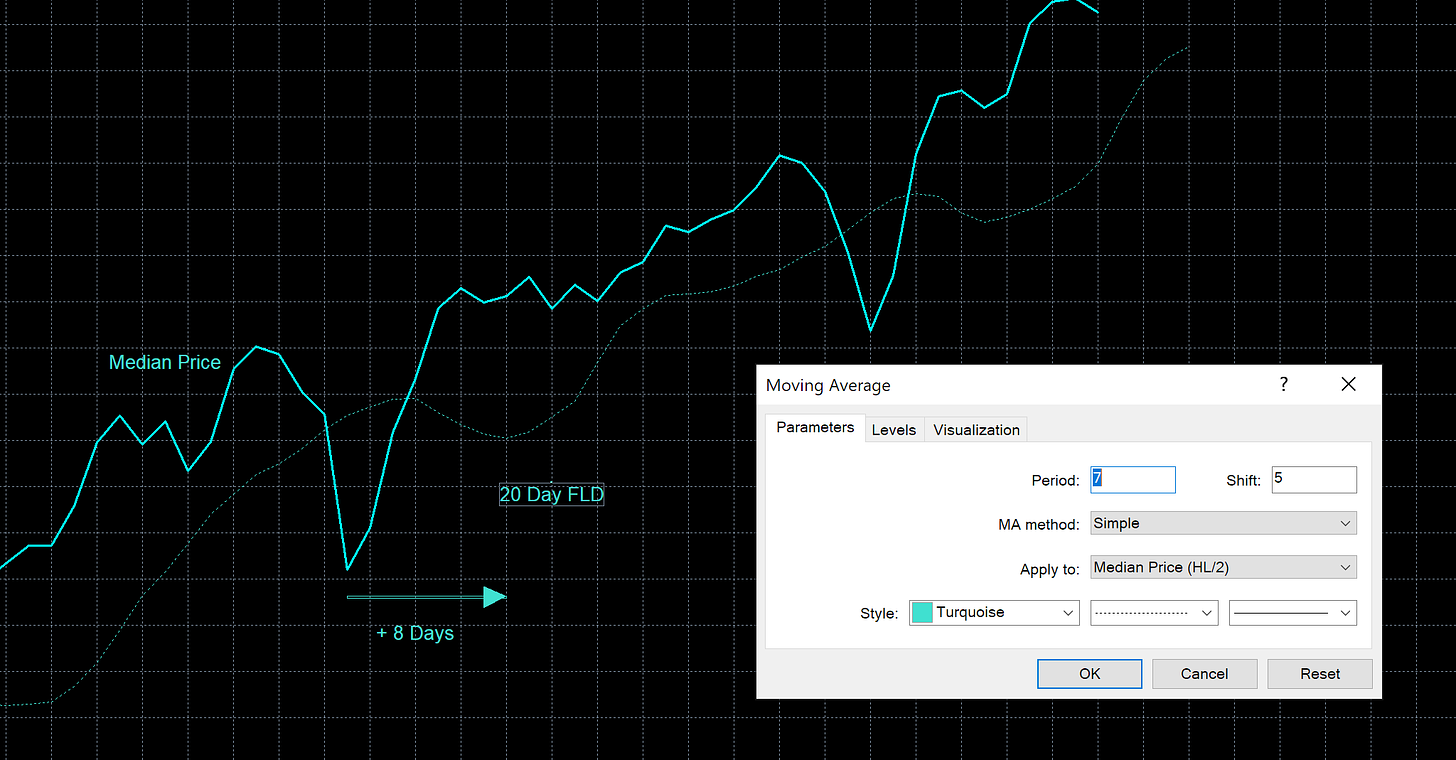
Let’s smooth further with periods of 5 and 7 respectively to further attenuate high frequency components.
When we start to approach the period being equal to the digital filter lag the benefits of applying the filter diminish. This is because the component we are applying the FLD for begins to be attenuated itself. So in the above example we would probably not want to go above 7 for the period. However try it yourself and watch how the periodic components are slowly removed from the signal. It is important to always account for the digital filter lag however!
Benefits of FLD 2.0
In practice this application of a low pass filter to the FLD allows a slightly better signal for FLD crosses. Where it really shines is when we look for dynamic support and resistance at FLD levels, a feature of Hurst Cycles that is really useful. Median price will so often track or hover around FLDs and to have the line smoothed (not too much, just to taste!) is a very good tactic to inform decisions.
I encourage you to try this approach for yourself and judge the results.
Hold on a Minute…
Keen eyed readers will have spotted the following: having correctly applied the digital filter lag to a moving average we have the correct position of the FLD, but what about moving averages applied to price as a matter of course on charts throughout the financial world? Yes, these must be lagged too and the vast majority are using moving averages incorrectly!
This will be the subject of a future newsletter/post and will likely be controversial as we challenge the arbitrary and ubiquitous application of these tools in technical analysis everywhere.
Thank you for reading and your support.


very very interesting