FLD Trading Strategy (Basic)
In this article we take a look at this useful strategy, created by Sentient Trader developer David Hickson. The technique relies on the predictable and robust nature of price interaction with the FLD.
Strategy Fundamentals
The first aspect to note when examining the strategy outlined here is that it is in no way related to anything Hurst wrote himself in any of his literature (aside from the FLD)! It is instead the result of many years diligent work by David Hickson (creator of the excellent Sentient Trader software) into the nature of the FLD and it’s relation to price action.
The FLD itself is explained in some detail in this article so please give that a read for the very basics of what the FLD actually is. Briefly recalled, it is price projected forward by half the period of the cycle component in question. The FLD is therefore 180 degrees out of phase with the price action of that component. This allows the analyst to gain robust insight into certain periodic components of interest within the instrument. For example, whether a peak or trough is left or right translated, informing the likely directional bias of the underlying trend (sigma-l). The FLDs available to use are based upon identified periodic components present in price action, derived from a formal phasing analysis of the instrument.
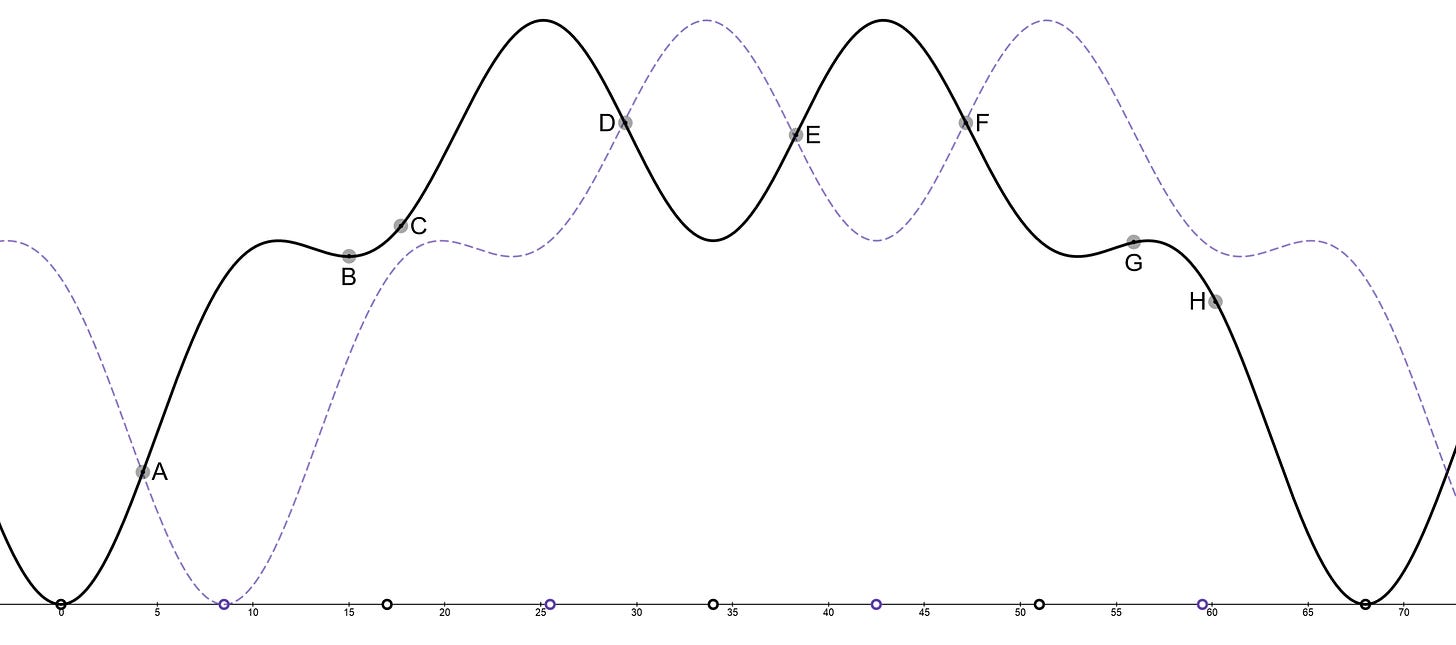
For this basic explanation of the FLD trading strategy we will use the concept of the trading cycle as being the 80 day nominal FLD and the FLD used as the signal cycle being the 20 day FLD.
A crucial point to note is the relationship of the signal cycle to the trading cycle. It is always at 2 degrees lower in the cyclic model and the components within the trading cycle must follow a 2:1 harmonic ratio.
Examples: If the 20 week cycle was selected as the trading cycle for analysis the associated signal cycle, upon which the FLD is based, would be the 40 day cycle. If the 40 week cycle was selected as the trading cycle, the associated signal cycle upon which the FLD is based would be the 80 day cycle, and so on.
Fortunately for us in Hurst’s nominal model the majority of cycles are proposed to be arranged in a 2:1 harmonic ratio (principle of harmonicity). Be cautious if using the 18 month component in your analysis along with associated FLDs for this strategy - it has a 3:1 harmonic ratio with the 54 month component.
Interaction Series A - H
Once an trading cycle has been decided upon and it’s associated signal cycle FLD plotted, we can begin to assess the phase of the trading cycle (and future opportunities) by looking at the characteristics of each interaction. Each interaction is assigned a letter, from A to H, representing 8 individual interactions with the signal cycle FLD. There are 3 bullish interactions, 3 bearish interactions and 2 neutral, all are far from equal and depend to a large extent on the phase of the trading cycle.
Let’s now examine each interaction in turn, with the help of real world examples and utilising the 80 day trading cycle / 20 day signal cycle.
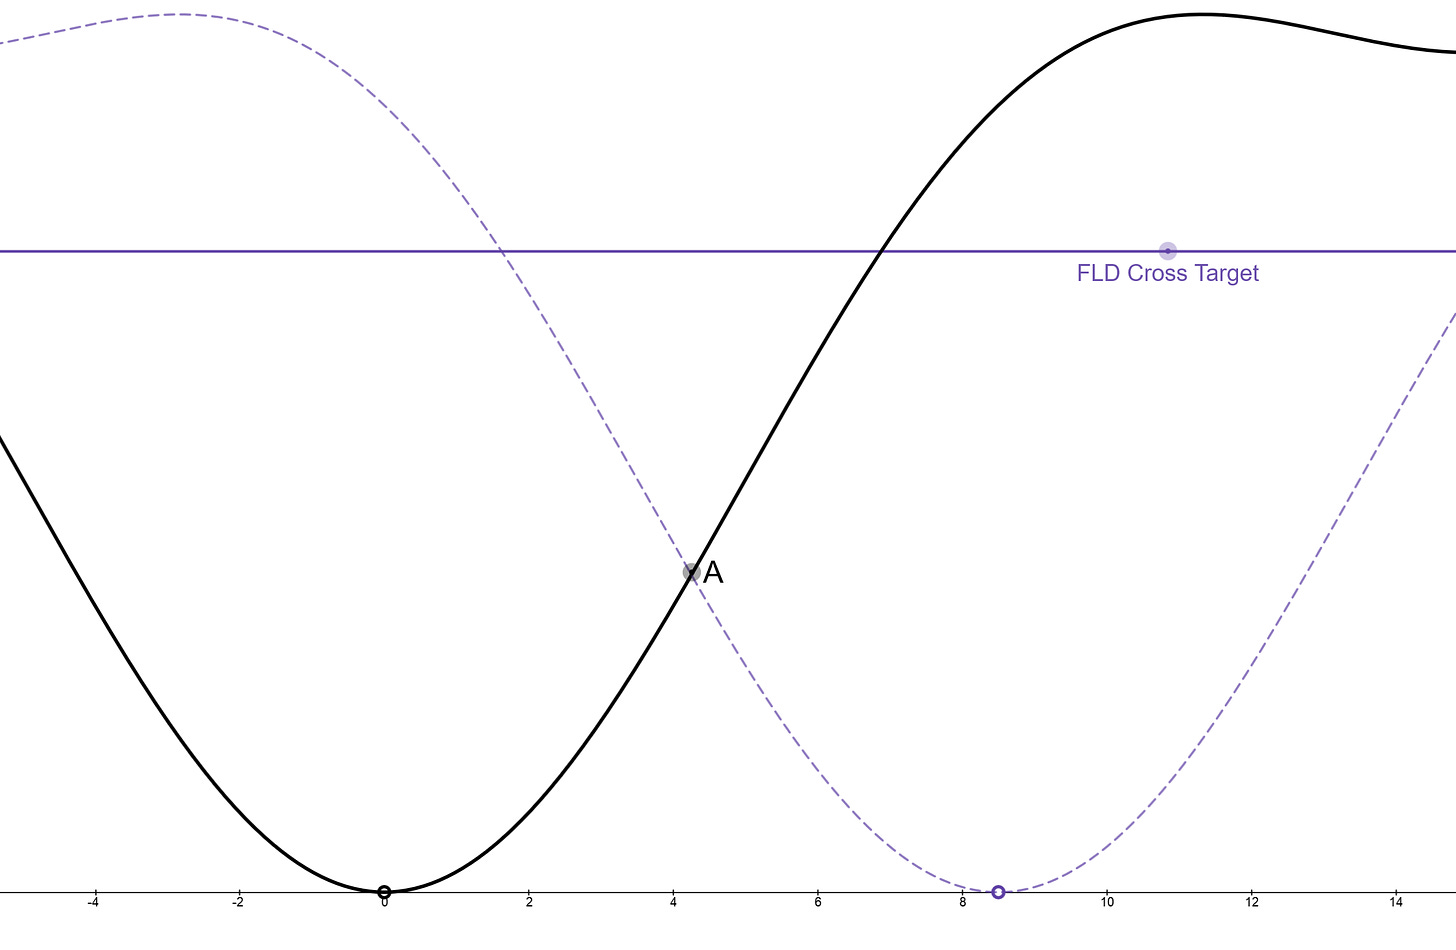
A Category Interaction (Bullish)
This interaction occurs at the very start of the trading cycle and is often strong, prolonged and will, in the majority of cases, hit the 20 day FLD cross target. Sounds great, right? The inevitable downside, unfortunately, is that phasing analysis error can lead to the G/H interaction being wrongly identified as the A category! Traders risk then being caught in a bull trap. It is therefore a good trade to enter but carries more transaction risk than a B to C category interaction or E category interaction. It can be especially profitable if identified in combination with the A category interaction of higher degree FLDs, a concept we will explore more in the advanced article.
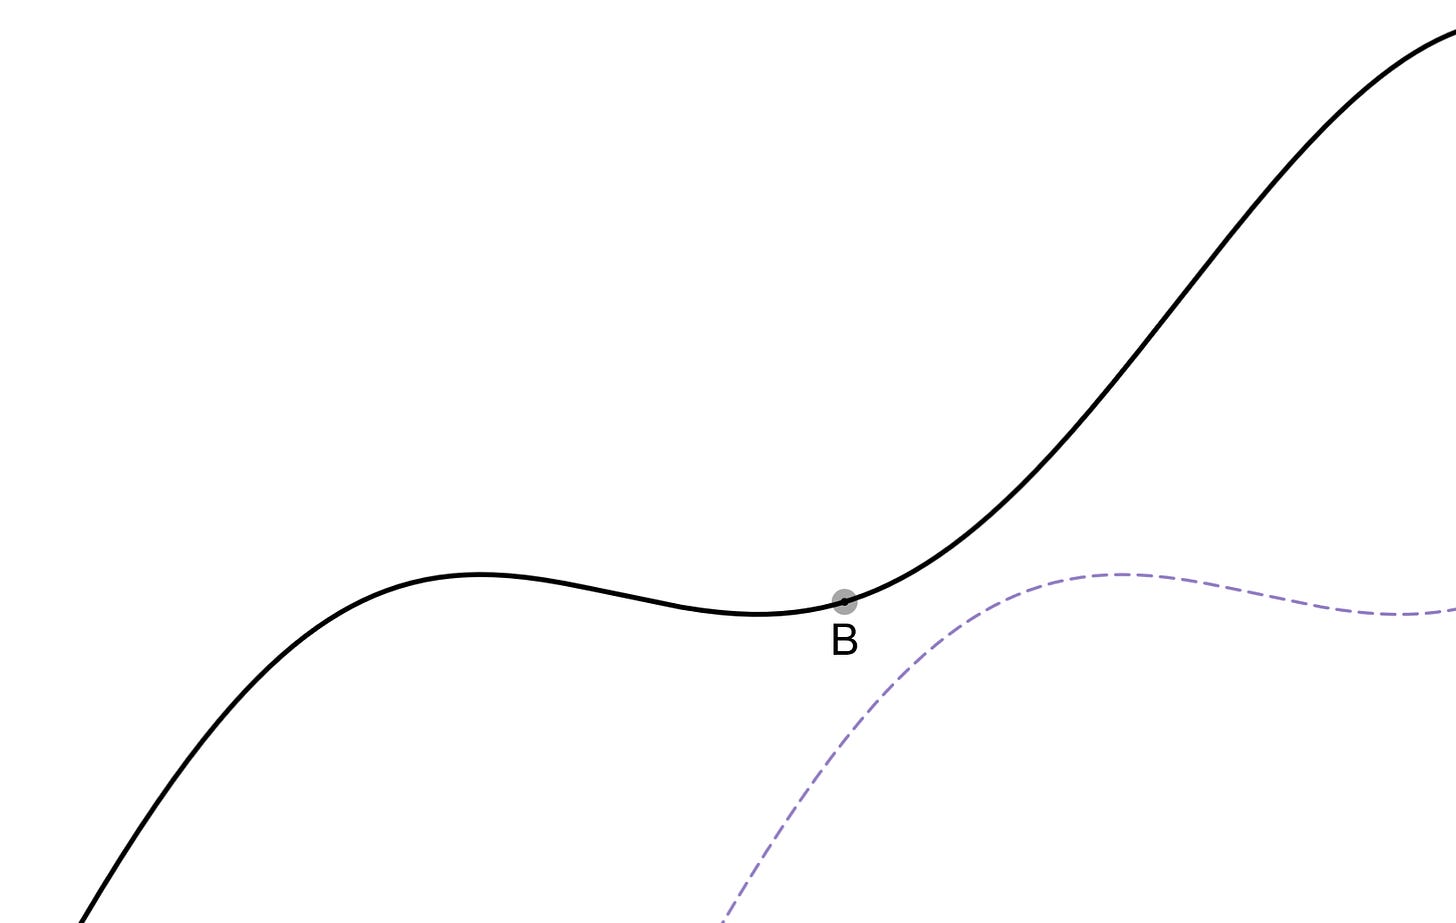
B Category Interaction (Neutral)
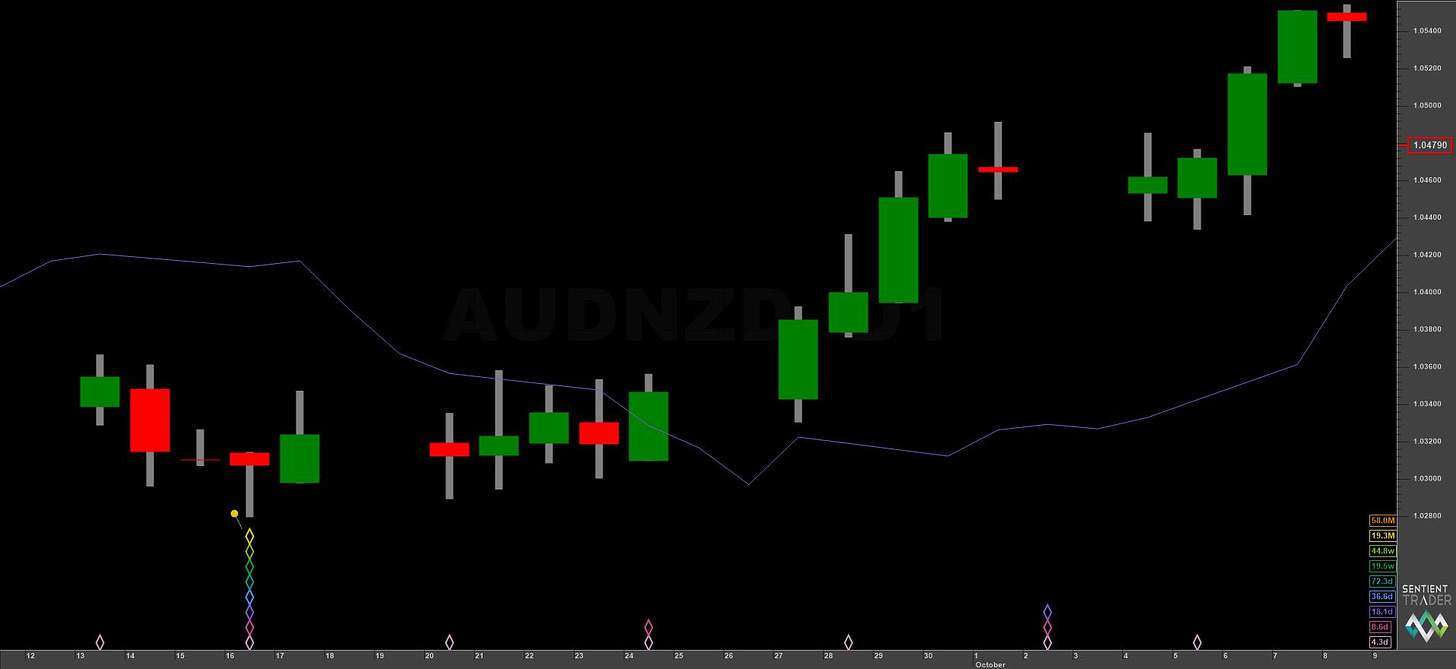
The ‘B’ category interaction occurs, in this case, at the first 20 day cycle low in the 80 day trading cycle. At this point sigma-l is up but price is forced sideways in a neutral scenario to meet or ‘touch’ the 20 day FLD. This is the definition of what Hurst described as the ‘mid channel pause’ in his early work, where price reaches the middle of a curvelinear channel drawn around the trading cycle.
In general, ‘B’ category interactions should not be traded but that does not imply by any means they are useless to the skilled Hurstonian. The manner in which the ‘B’ category interaction occurs can tell us more about the possibility of a profitable, bullish, ‘C’ category move and the underlying trend of the market at this point in the trading cycle. For example, if price finds significant support at the 20 day FLD (price tracks / straddles the FLD) this is a bullish sign for sigma-l. If price, on the other hand, were to break below the 20 day FLD in a significant manner (several days below the FLD, or approaching the FLD cross target), this is bearish for sigma-l and we should take note that bullish trades are perhaps not the best strategy going forward.
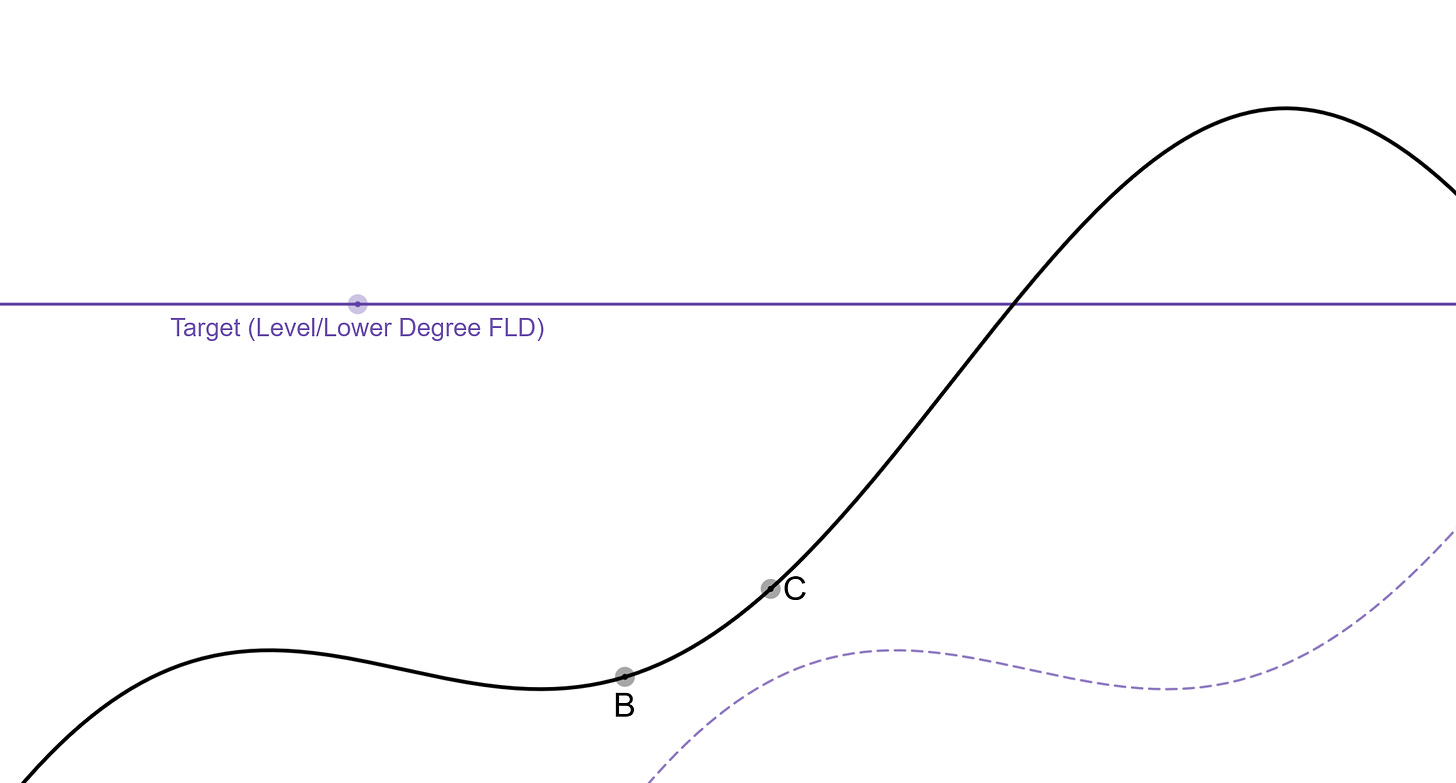
C Category Interaction (Bullish)
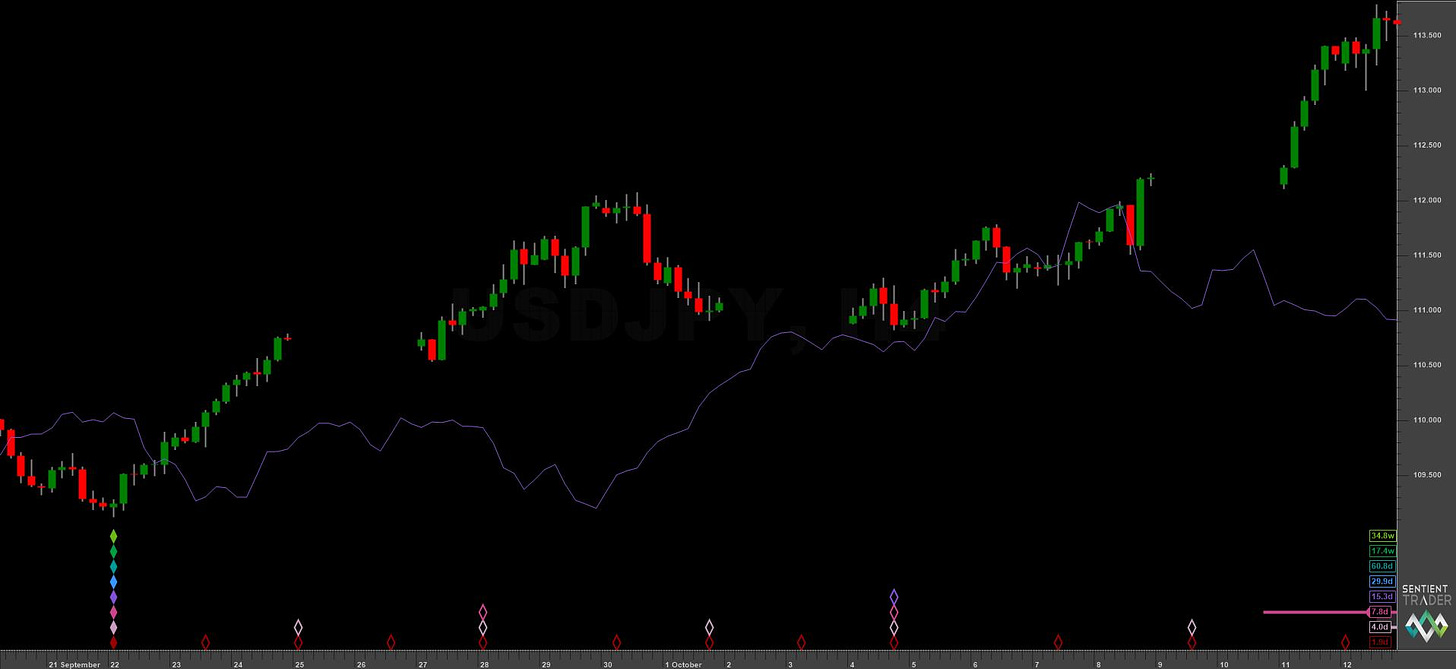
The ‘C’ category interaction with the 20 day FLD is sometimes a tricky one to find an entry point to but presents less transaction risk than an ‘A’ category interaction as the underlying trend is already established. Assuming that the result of the ‘B’ category interaction is deemed to be bullish there are a couple of tactics to use.
Firstly a stop entry above the high of the 20 day nominal peak can be used, a measured move from the accompanying lows perhaps serving as a good target, or potential resistance above at a higher degree FLD. Secondly, a lower degree FLD can be plotted above price to gain a more objective target. The 10 day FLD is a good choice in our example here using the 80 day trading cycle / 20 day signal cycle.
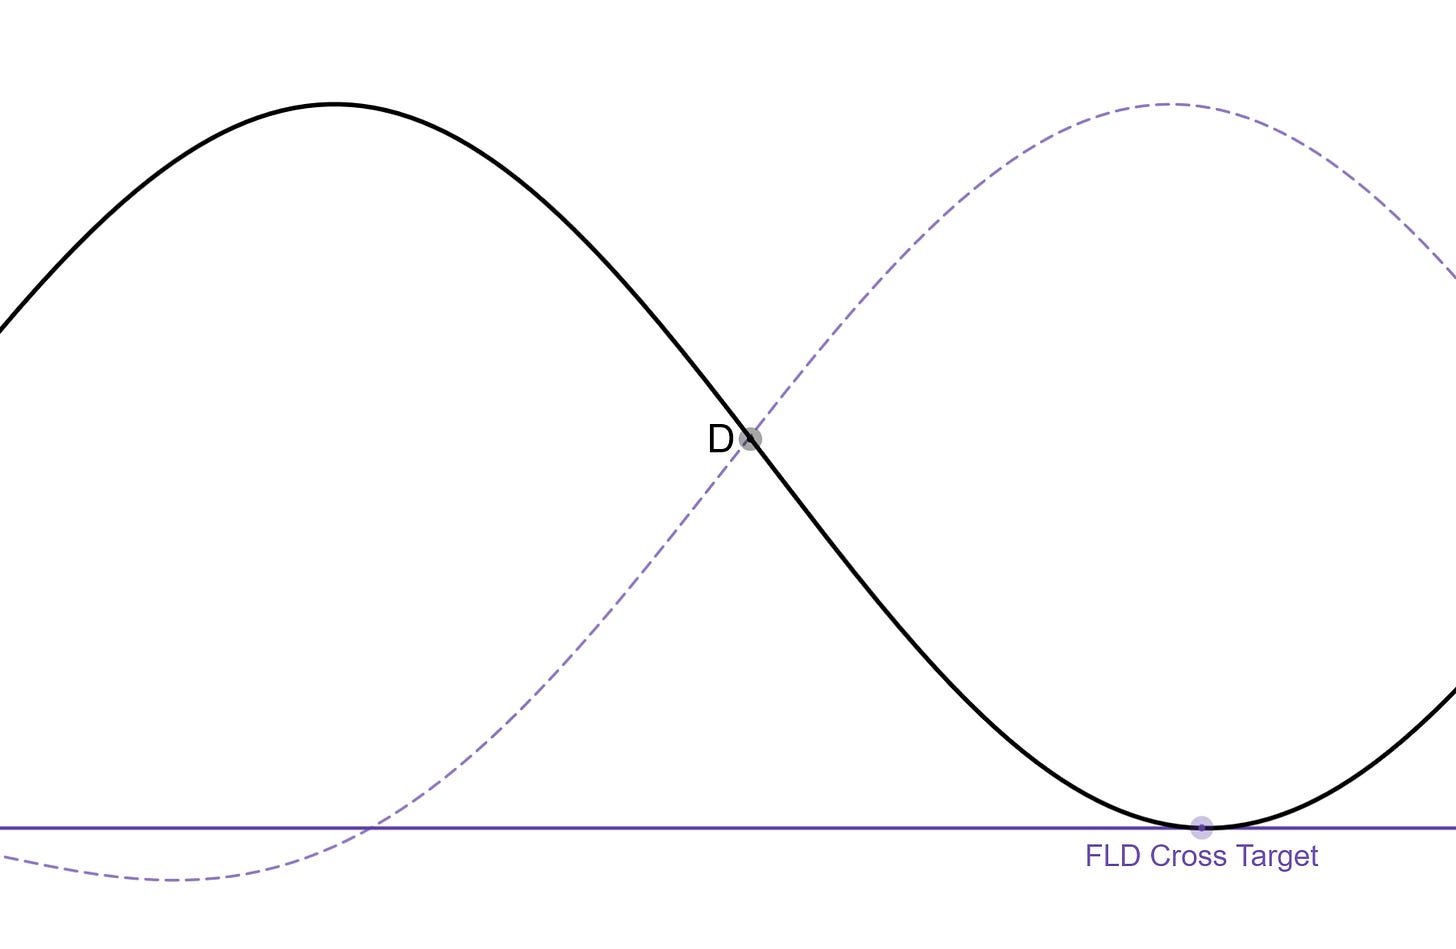
D Category Interaction (Bearish)
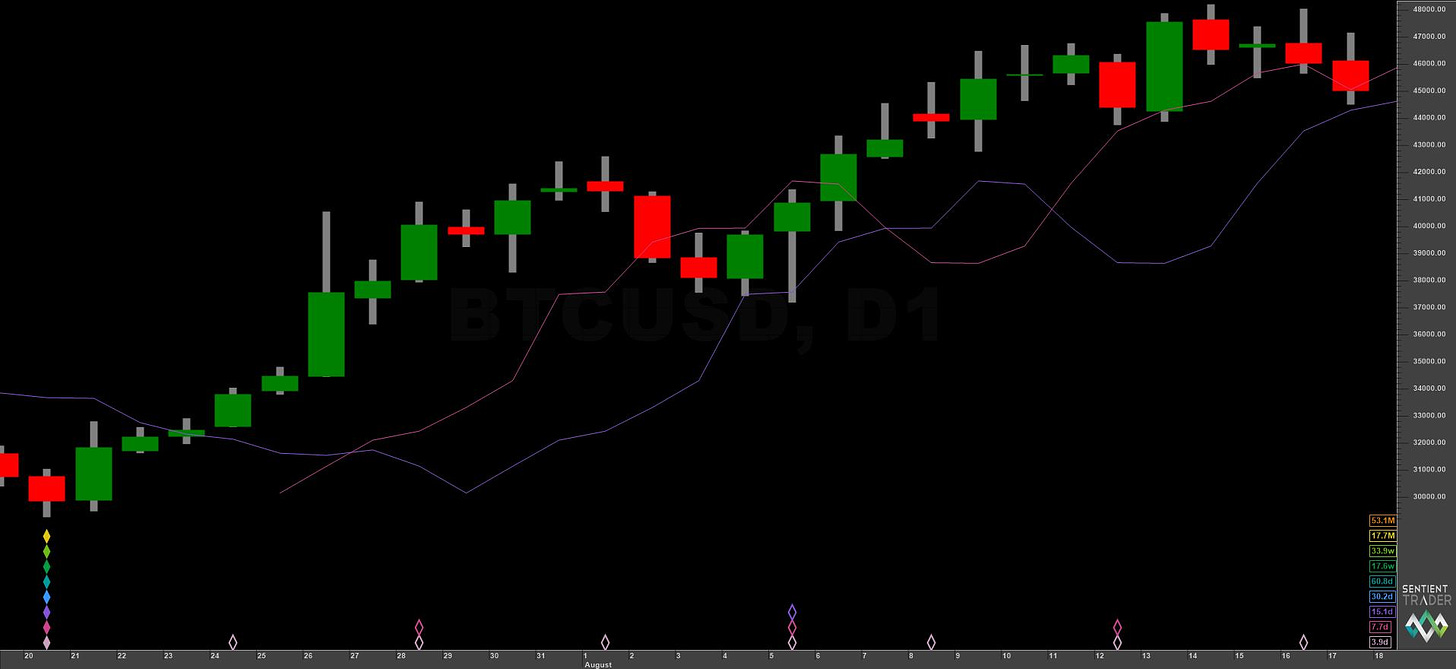
The ‘D’ category interaction is the first short position any trader using this strategy should consider entering into during the trading cycle. It’s low co-incides with the trough of the 40 day component in our idealised example and therefore represents the mid point of the 80 day trading cycle. The FLD cross target in both the ‘D’ and ‘E’ category interactions are very important to inform us of the underlying trend. If there has been weakness (bearish signs) noted at ‘A’, ‘B’ or ‘C’ it is more likely the FLD cross target will be overshot to the downside (bearish sigma-l). On the contrary, if price misses the FLD target here sigma-l is likely to be more bullish and the ‘E’ category bullish trade should exceed it’s target. Quite often support is found at the 40 day FLD in this move.
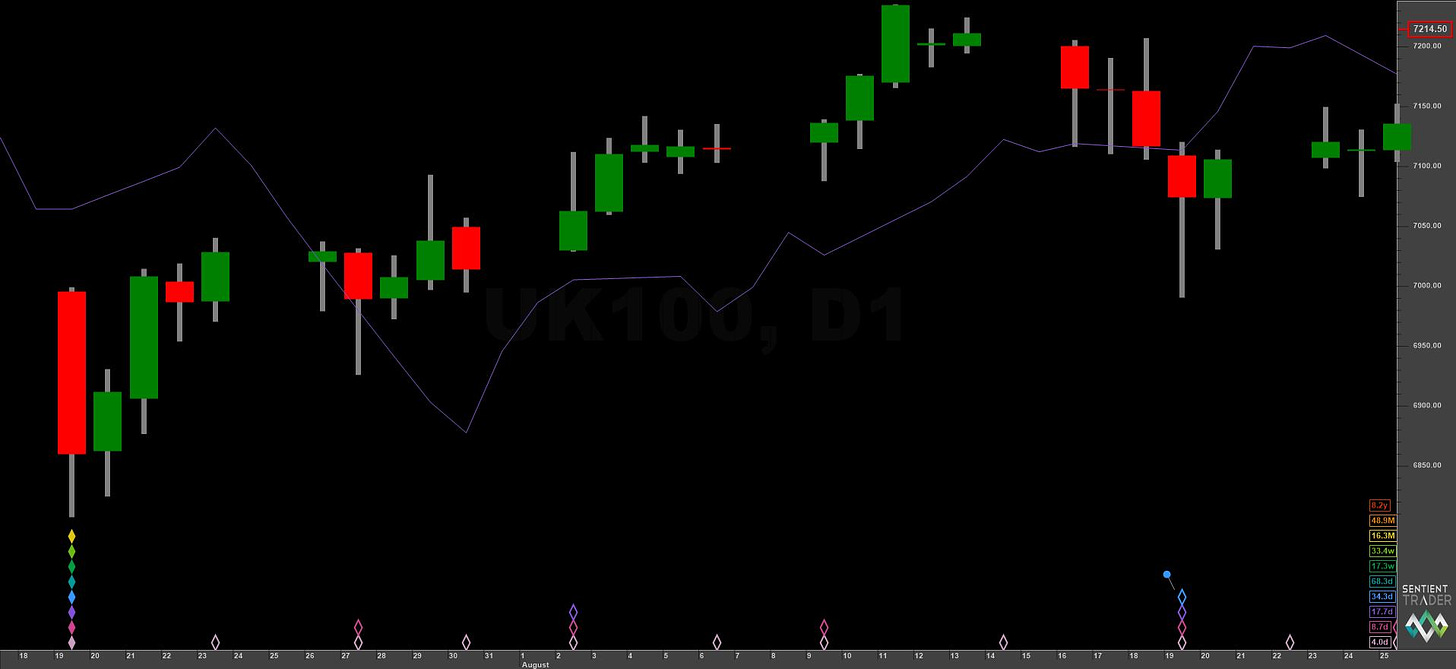
E Category Interaction (Bullish)
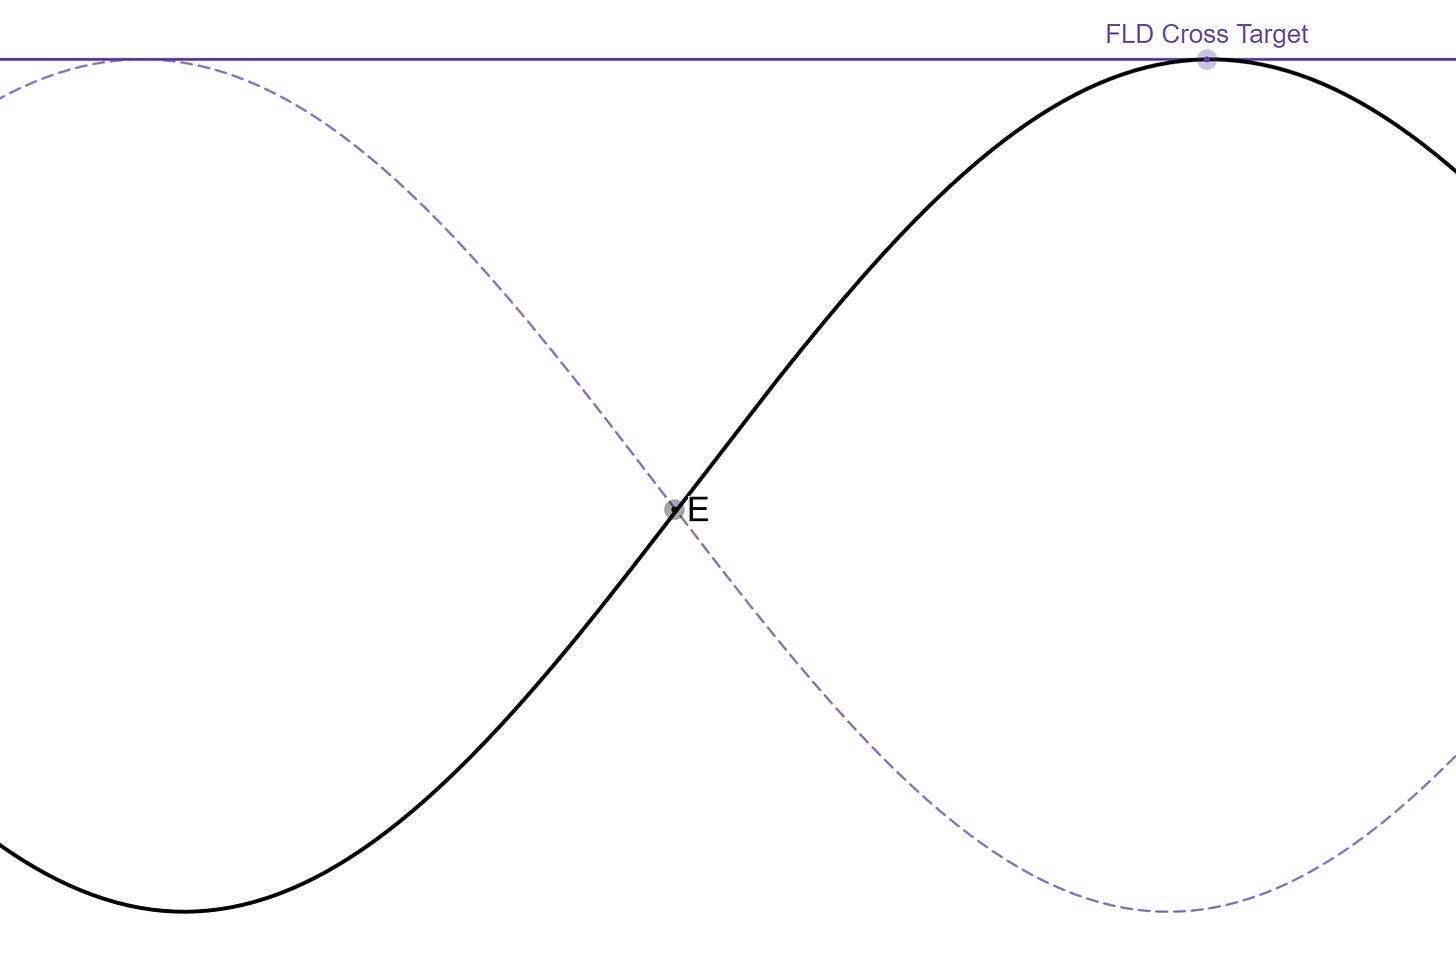
The ‘E’ category interaction with the 20 day FLD is the inverse of the ‘D’ category interaction and is a bullish trade from the 40 day nominal low in our idealised example. Expectations are that price should hit the FLD cross target in a neutral shaped trading cycle, any large deviations from a simple meeting of the target indicating either a bullish (overshot target) or bearish (undershot target) sigma-l.
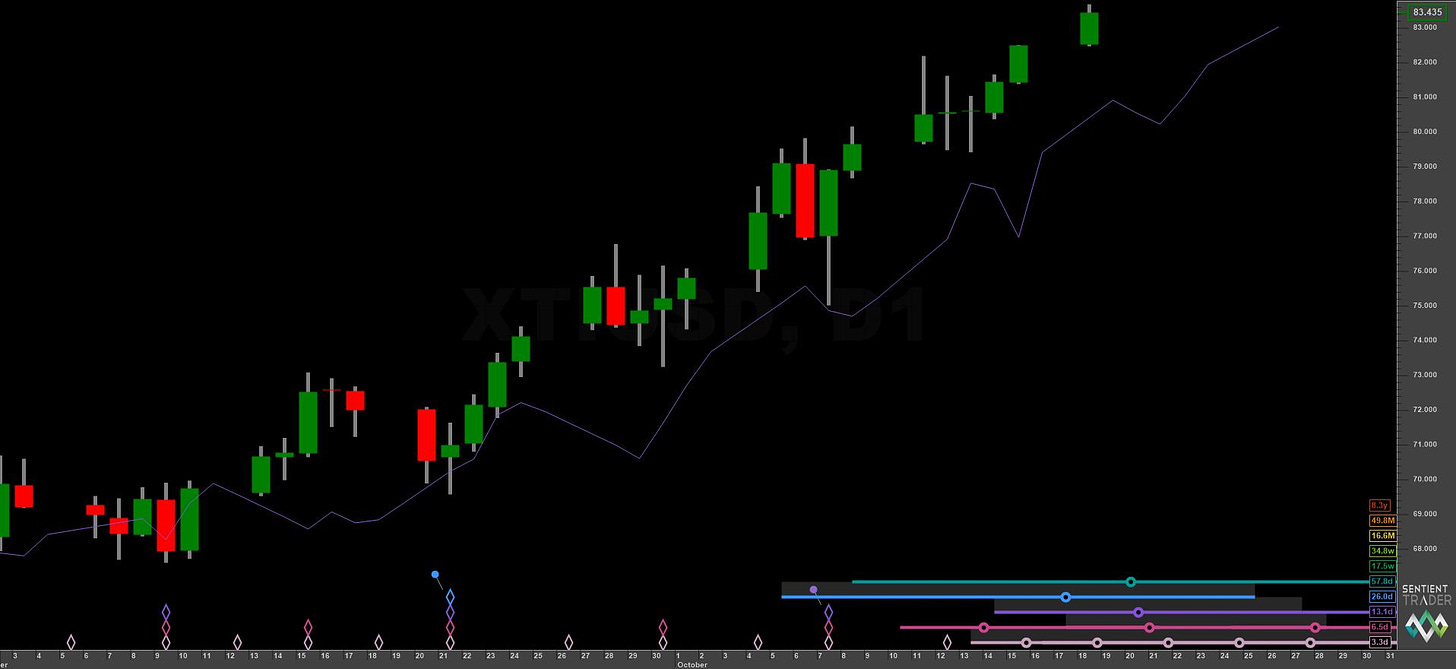
F Category Interaction (Bearish)
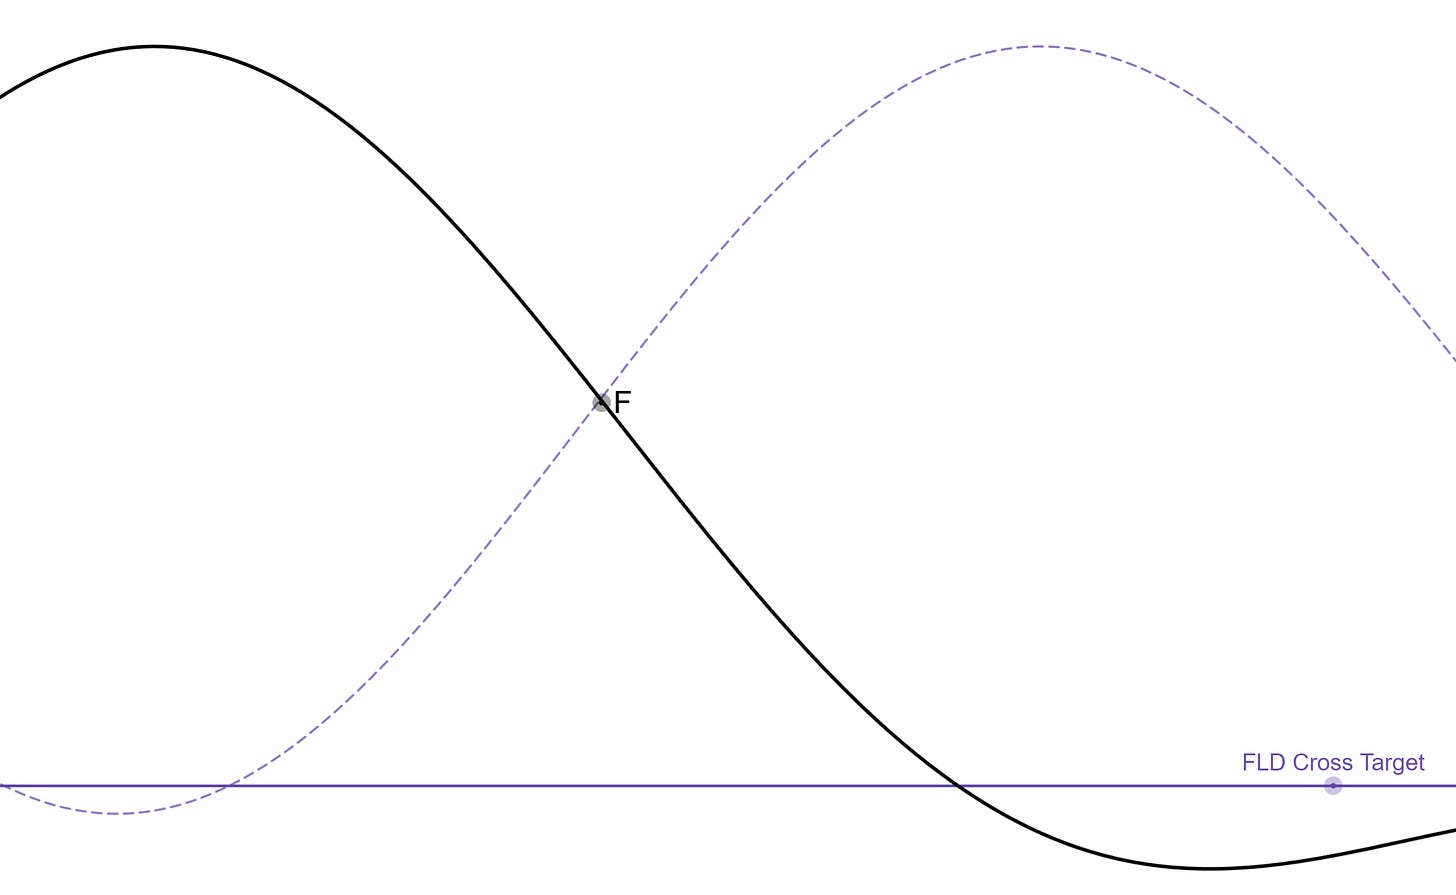
The ‘F’ category interaction is the optimal trade to enter into given a bearish sigma-l and represents the start of the falling side of our idealised 80 day trading cycle. If the ‘D’ category interaction has overshot it’s target and price has subsequently struggled in the ‘E’ category interaction, Hurstonian traders should be on alert for a profitable bearish trade ahead. If sigma-l is bearish the ‘F’ category trade should exceed it’s target in most cases easily and can often be held longer, given higher degree FLD confirmations.
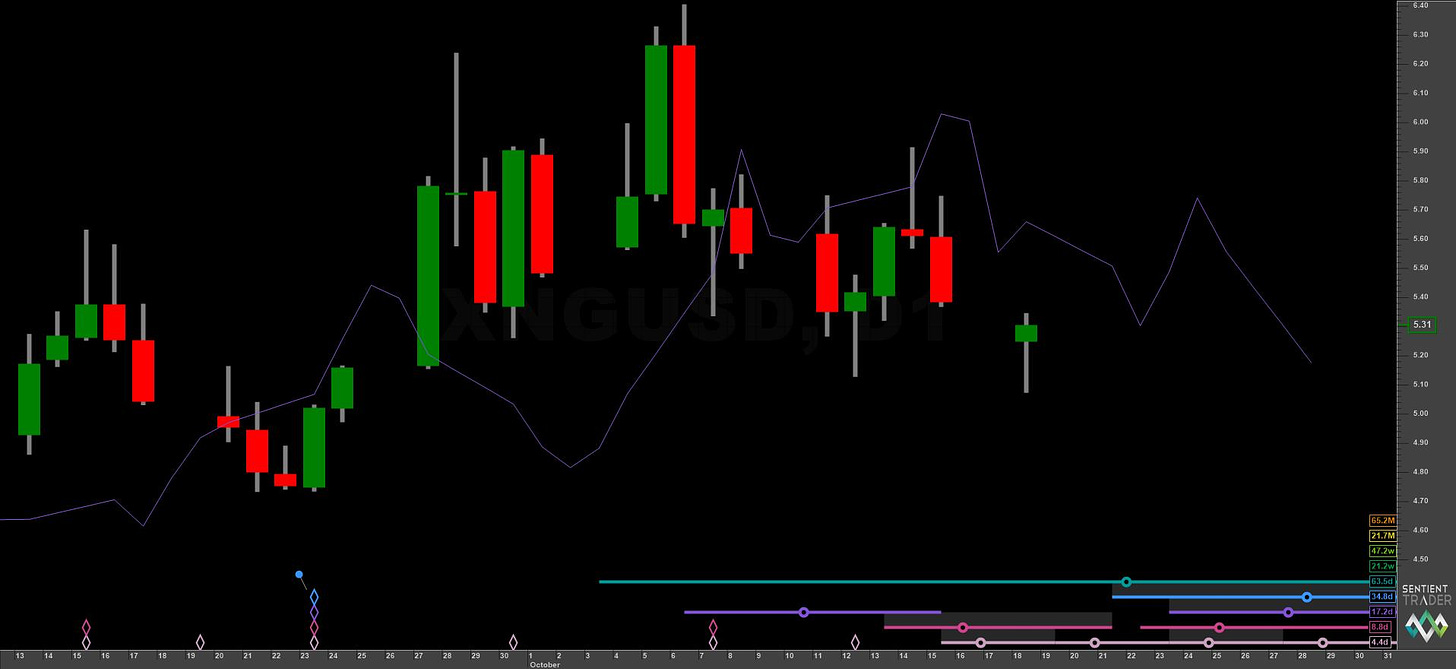
G Category Interaction (Neutral)
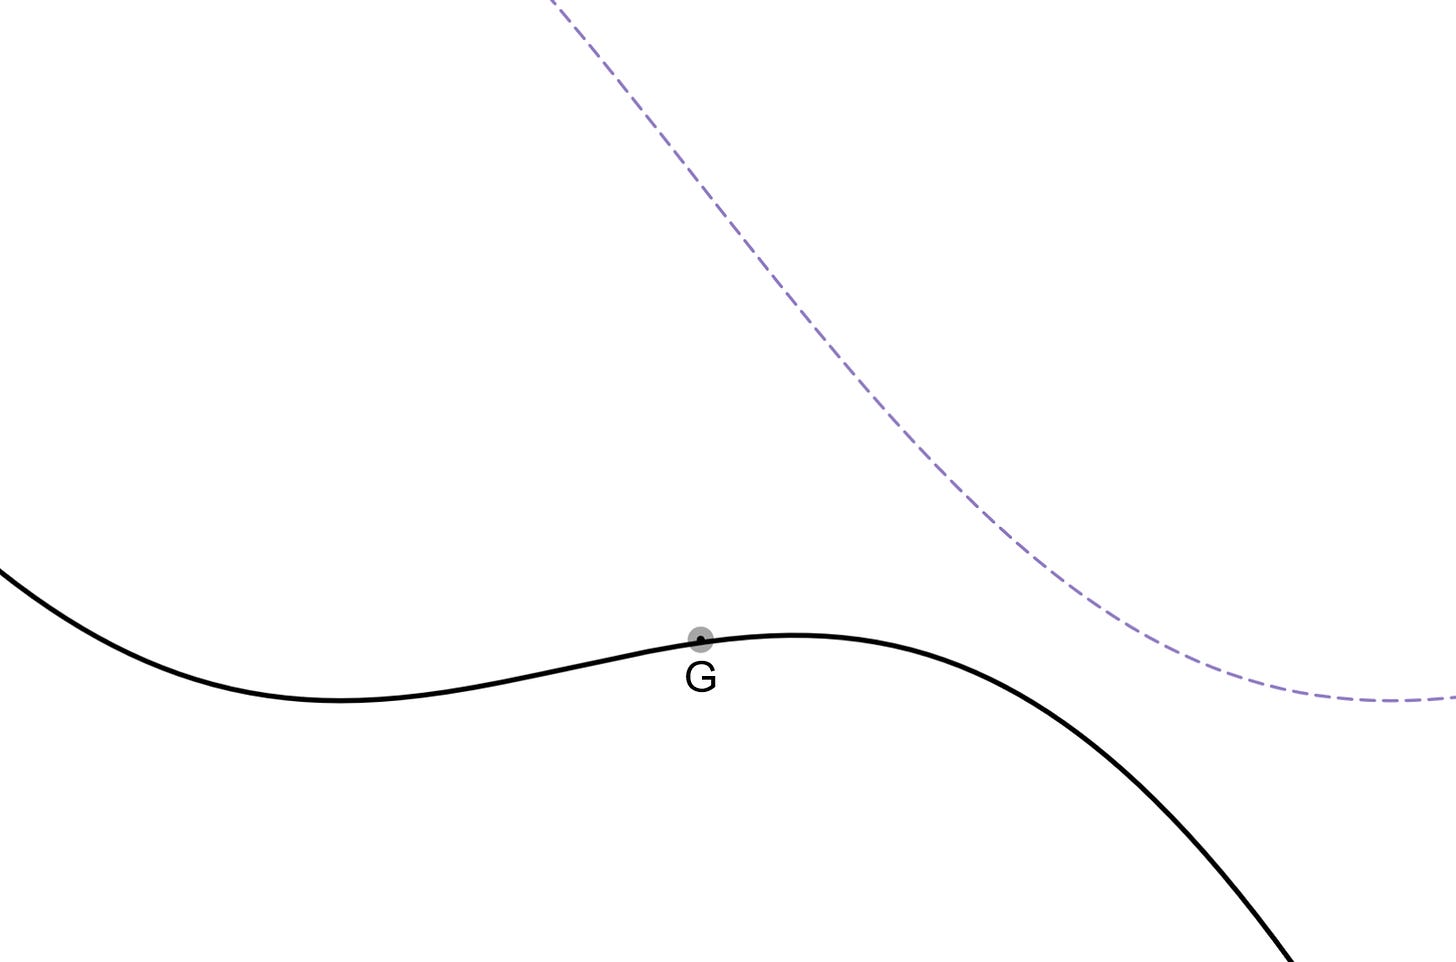
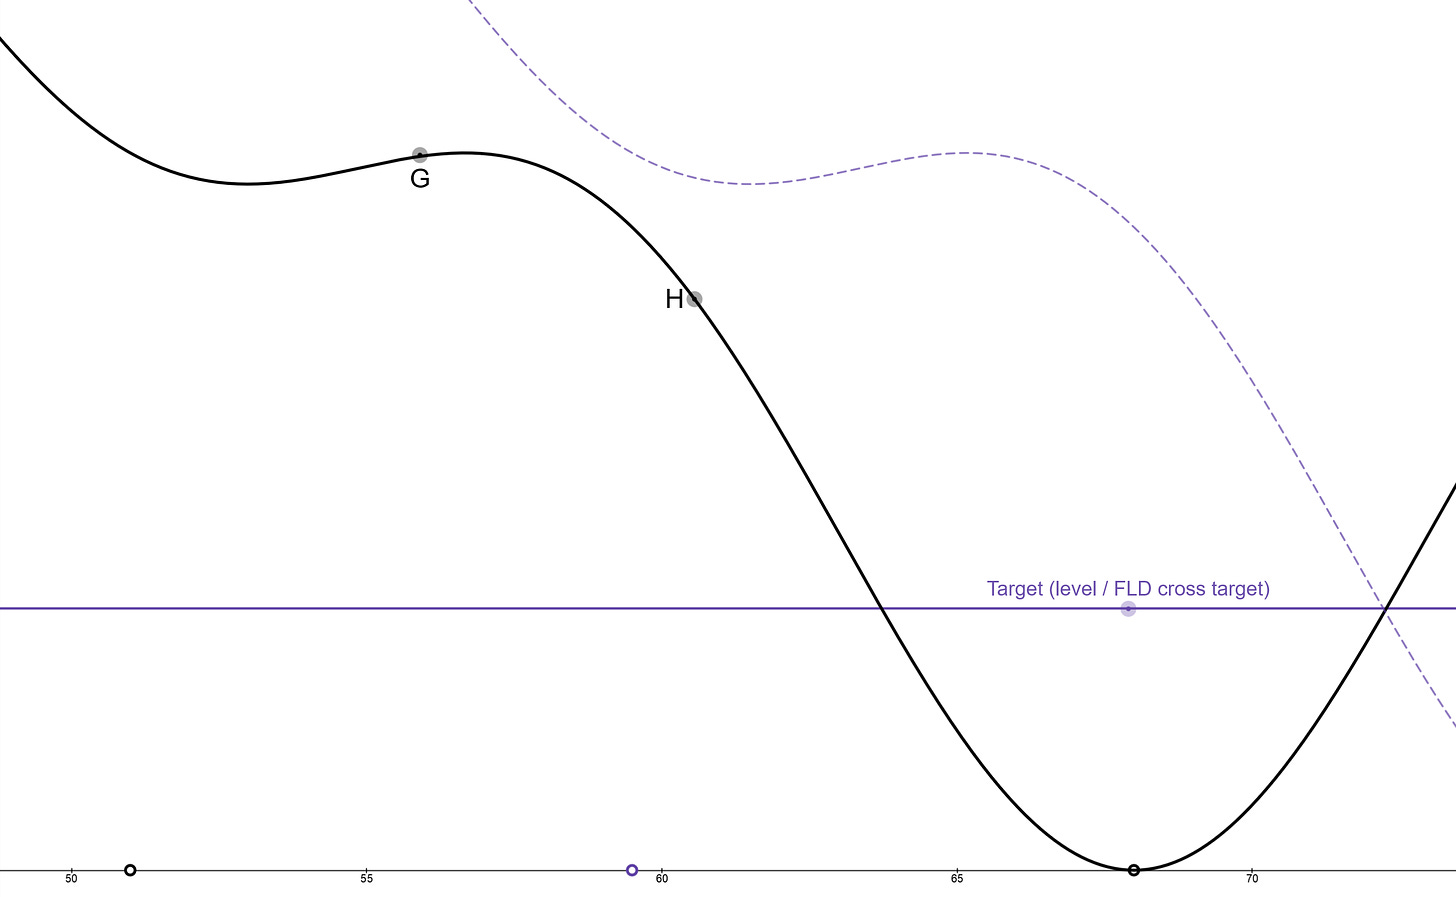
The ‘G’ category interaction is the inverse of the ‘B’ category interaction and generally will move price toward the 20 day FLD (in our idealised example), either tracking the FLD or breaking above it in a sideways consolidation. In a bearish scenario the ‘G’ category interaction can be expected to find resistance at the 20 day FLD and is therefore sometimes a risk on fade short if sigma-l is indicated to be heavily bearish. The risk here is that of phasing error and more specifically a 20 day nominal cycle margin of error. This may result in the ‘G’ category interaction infact being the ‘A’ category interaction of a new 80 day cycle, so be careful! A less risky strategy for a bearish scenario is to enter the ‘H’ category trade on stops below the 20 day nominal low that initialised the ‘G’ category interaction.
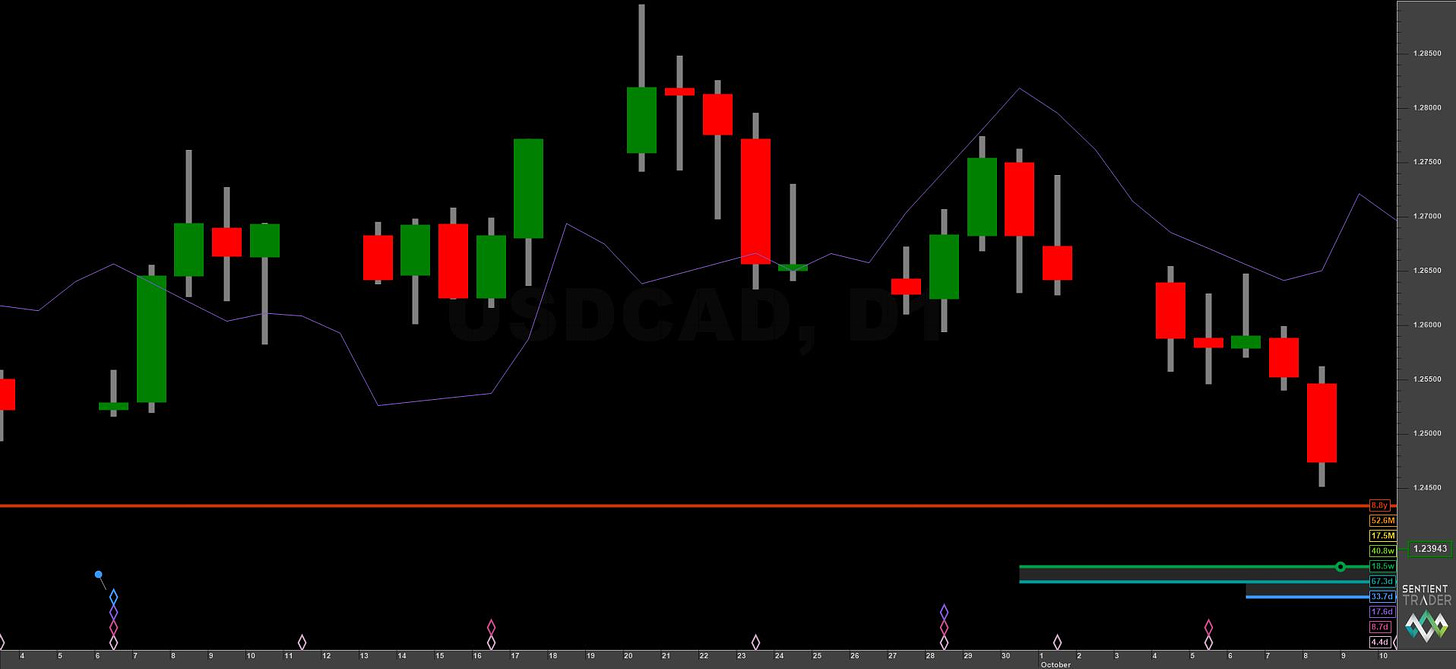
H Category Interaction (Bearish)
The ‘H’ category interaction is the most bearish of the trading cycle, being the final 20 day component to bottom. This does not mean it is the best bearish trade. Given a robust assessment of sigma-l, however, it can be very good. It is somewhat the inverse of the ‘A’ category interaction and if previous bullish trades have all struggled to meet targets (or just met them), the ‘H’ category is likely to be profitable. It can either be held from the ‘F’ category interaction or entry can be made via a stop sell order at the level of the prior 20 day low. Alternatively the 10 day FLD might be used in our idealised scenario to gain confirmation of a 10 day peak occurring previously, giving more confidence to the trade.
Combining FLD Interactions
We can take the FLD strategy applied to one single signal cycle FLD and combine it with other signal cycle FLDs for an even more powerful approach. This is explored in depth via the advanced FLD trading strategy article.
This incredibly powerful technique allows us to pinpoint optimal entry areas for maximising yield over time, bullish or bearish. By combining higher and lower degree cycles we can take advantage of both smaller risk entries and higher rewards.
Join Us!
Please consider joining us for the very latest Hurst cycles analysis across financial markets, freshly served from an expert in the application of this robust method.
Finally, if you found this article interesting and helpful, please consider sharing it with others!


