FTSE 100: Hurst Cycles - 1st November 2022
Price action in global stockmarkets suggests a low of at least 20 week magnitude has occurred and possibly the anticipated 18 month nominal low. In this report we study the new FTSE 100 evidence
Tools required: Nominal Model | FLD | FLD Trading Strategy | FLD Trading Strategy (Advanced) | Principle of Nominality | Underlying Trend
Analysis Summary
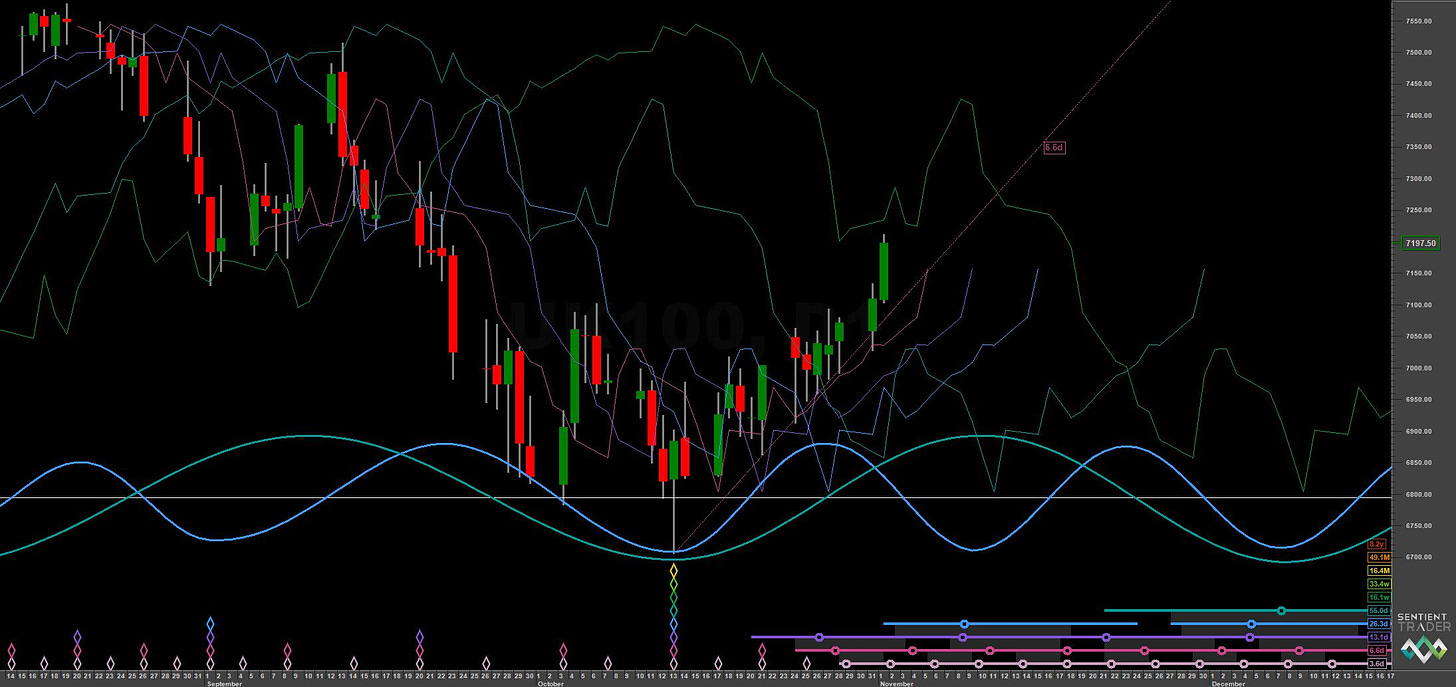
The FTSE came down to around the 6700 mark, an area highlighted in previous reports and associated with the 54 month FLD support before bouncing on the 13th October. Previously price had made our target of 7050 from a brief rally starting 3rd October.
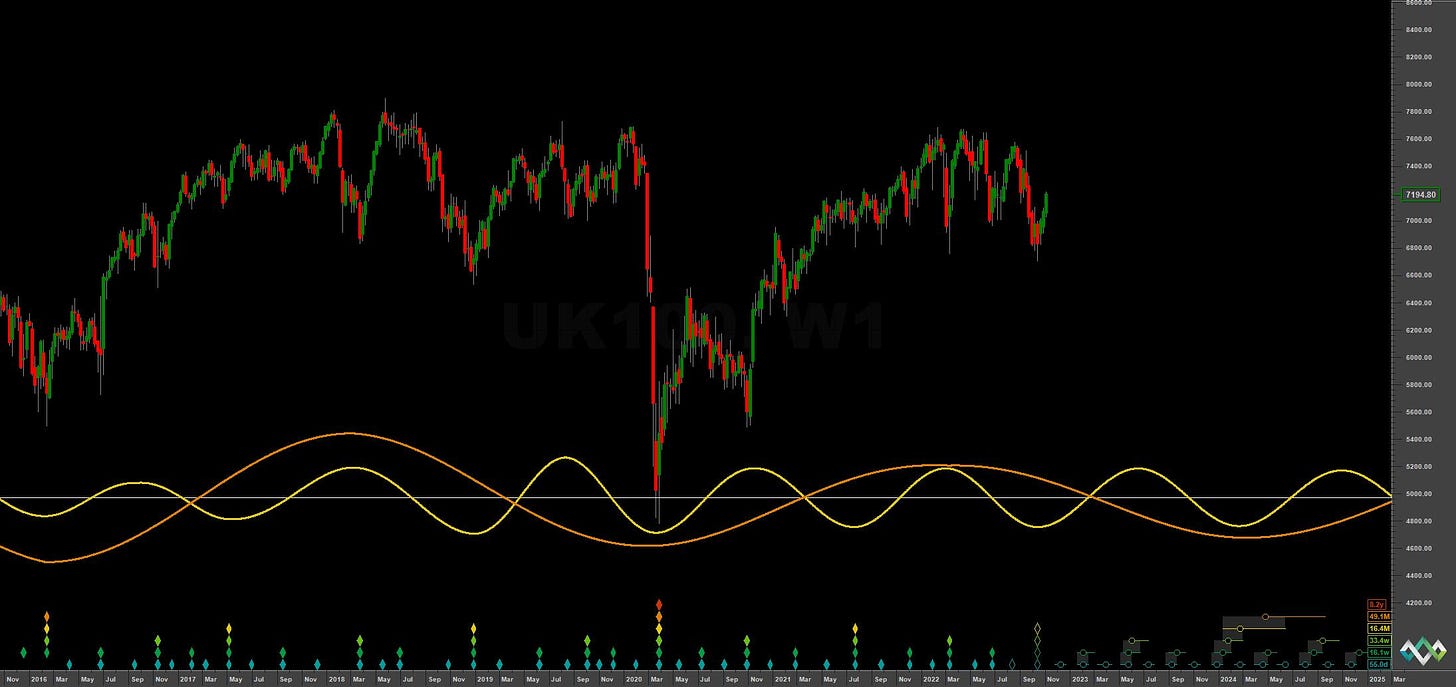
The bounce on the 13th of October, previously phased as only a 40 day component, is now assumed to be of at least 20 week magnitude, coming in earlier than expected and highlighting the 40 day margin of error we have mentioned previously in all stock market reports on sigma-l. The long term chart below is now updated to show the 18 month component having occurred, although it is not yet fully confirmed. It is certainly a valid placement, coming in at 14.8 months against the average of 16.4 months, a mild frequency modulation at this scale (roughly a 40 day margin of error).
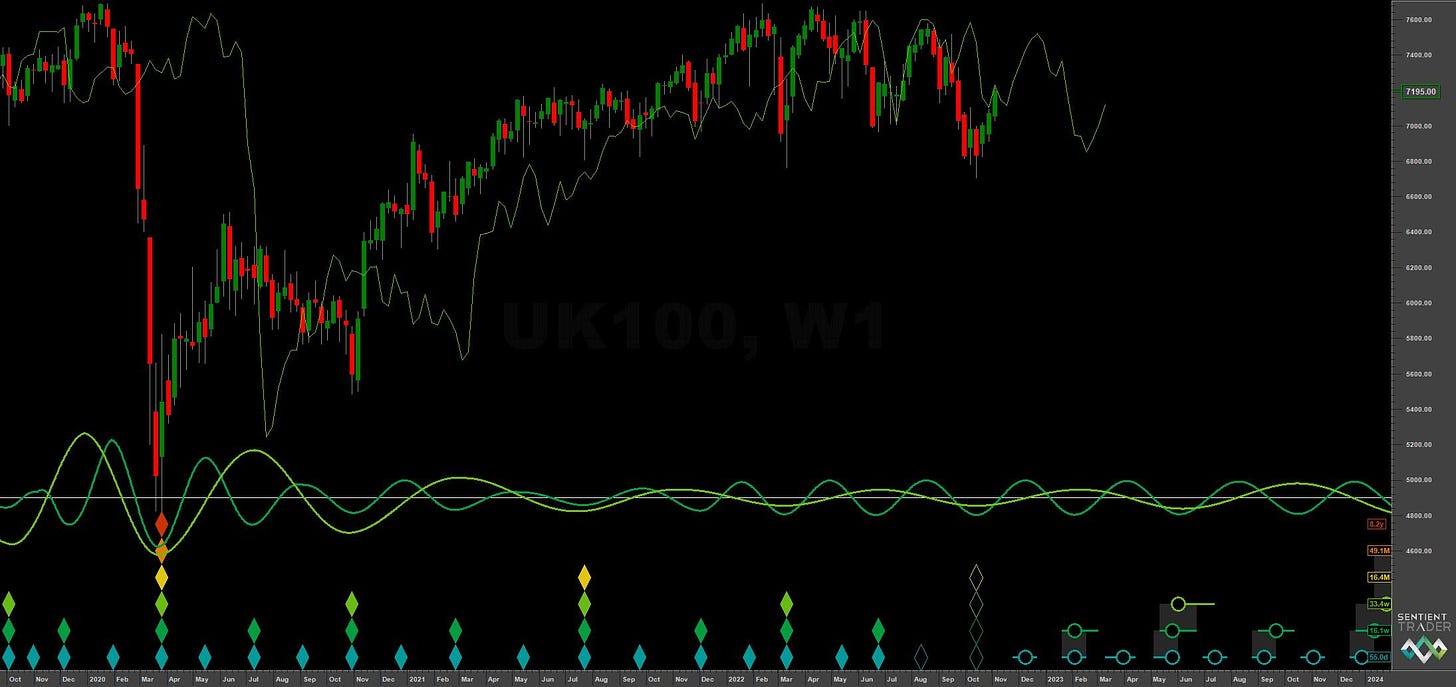
The low is almost certainly a low of at least 20 week magnitude and, as the 20 week component has been quite outstanding in it’s clarity over recent months (see medium term chart below), we can work well on this basis. Should the 18 month component have occurred, we can expect the recent 80 day FLD target of 7305 to be approached, more detail is given on that in the trading strategy below.
The placement of the 18 month nominal low gives us the chance to assess the longer term phasing. Should the phasing be accurate and the previous 54 month component placement in 2020 be correct, we can expect a much bigger low early in 2024, currently late in the 1st quarter looking at the nest of lows.
Any significant breach of the highs around 7666 would call for a re-phase of longer components. This is an outlier possibility at this stage and is the case in all major global stock markets. The current 20 week component shape will be telling and is due to trough in late January 2023, at that point we can probably nail down the longer term picture and look forward to some excellent trades in 2023.
Shorter term price is peaking from the 40 day nominal component here with perhaps a slight further push up to the 80 day nominal FLD cross target described above. We should then see a move to the 40 day nominal low, due in the 2nd week of November and subsequently a further move up to test the 20 week FLD (green, medium term chart). Further ahead, a general tracking of the 20 week FLD to the next 80 day nominal low, due early December, would enhance the bearish longer term case, slightly.
Phasing Analysis
Long Term
Components greater than and including the 18 month nominal cycle
Medium Term
Components less than and including the 18 month nominal cycle
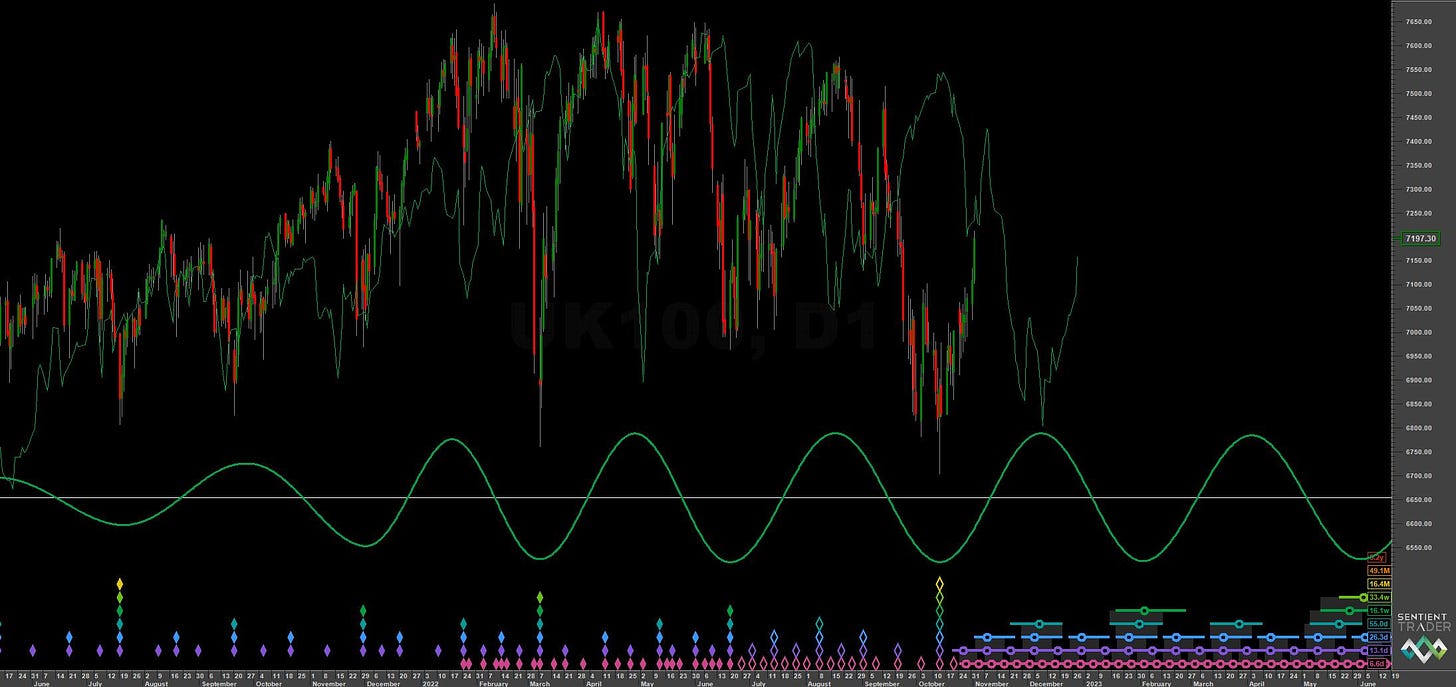
Short Term
Components around the 80 day nominal cycle
Trading Strategy
Interaction Status
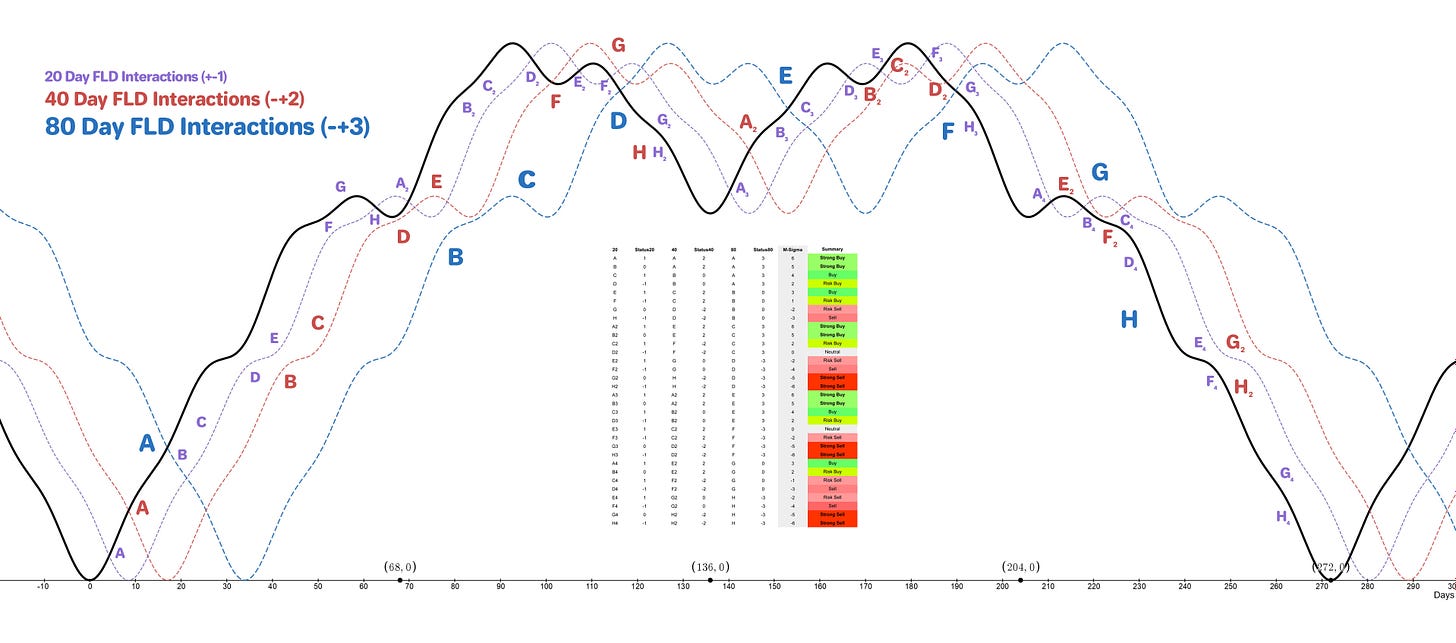
Interactions and price in the FLD Trading Strategy (Advanced). This looks at an idealised 40 week cycle and an array of 3 FLD signal cycles. We apply the instrument’s phasing to the model and arrive at an overall summary for the interactions with the 20 day FLD, current and forthcoming.
Sigma-L recommendation: Neutral / Risk Sell
Entry: 10 Day VTL / 10 Day FLD
Stop: Above formed 40 day nominal peak
Target: 7000-7050 (40 day FLD support)
Reference 20 Day FLD Interaction: D / D3
Underlying 40 Day FLD Status: B / B2
Underlying 80 Day FLD Status: A - B / F
Interactions given above are firstly stated assuming that the 18 month nominal low has occurred and (after the forward slash) assuming only a 20 week component has occurred. Both options are presented for traders.
Price is near the 20 week FLD and will likely find resistance at it. The 80 day FLD cross is at 7305, a miss of this target may suggest the low on 13th October was indeed of only 20 week magnitude. If the target is approached with minimal margin (perhaps 10%), or breached, then it is highly likely the 18 month nominal low has occurred.
The 40 day component is peaking in the next few days, likely support will come at the 40 day FLD around 7000-7050. Note that the peak will be right translated relative to the 40 day FLD trough, suggesting underlying bullishness.
FLD Settings
If you do not have the use of Sentient Trader use these settings to plot FLDs in your trading software (daily scale) to more easily follow trading signals and strategy from Sigma-L.
Make sure to account for non-trading days if your broker omits them in the data feed (weekends, for example). The below offsets are given with no added calculation for non-trading days.
80 day nominal: 55 days | 28 day FLD offset
40 day nominal: 26.3 days | 13 day FLD offset
20 day nominal: 13.1 days | 7 day FLD offset
10 day nominal: 6.6 days | 3 day FLD offset


