FTSE 100: Hurst Cycles - 5th September 2022
FTSE 100 shows dominance at the 80 day cycle level, hitting targets at 7100 - 7200 and again testing the 18 month FLD. Price now sits near the next 80 day cycle nest of lows, we look at the next moves
Analysis Summary
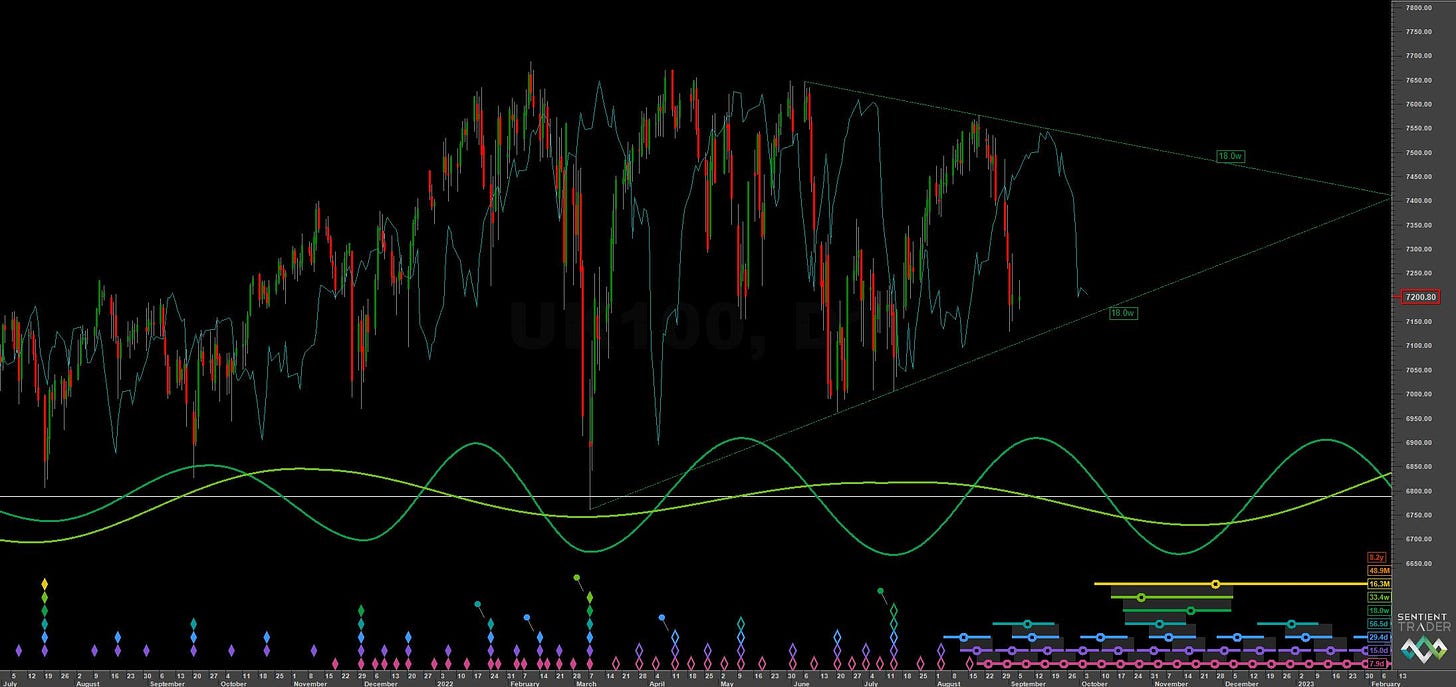
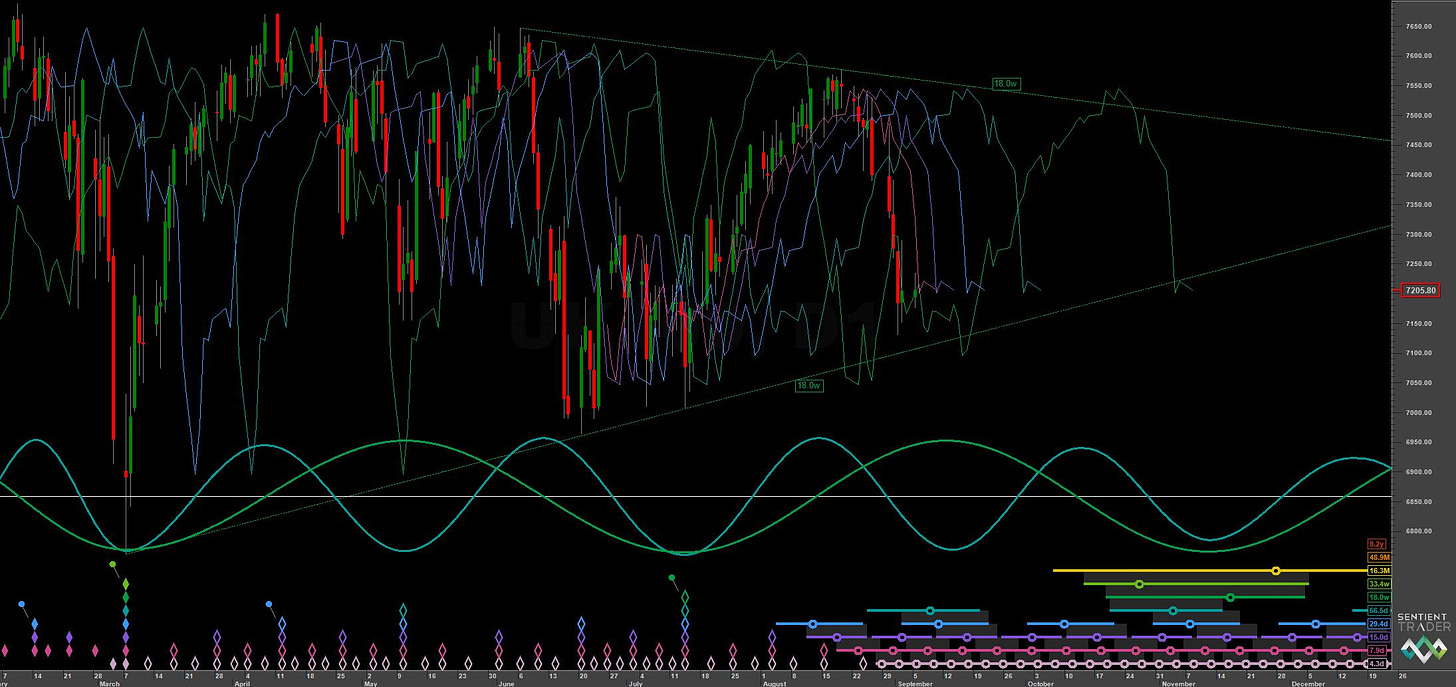
A clear dominance of the 80 day component has been reinforced in the FTSE, with a bell curve like shape of the most recent iteration squashing the 40 day component for a tricky phasing in the last few weeks. However, the anticipated move back down has been sharp and hit the targets of 7100-7200 detailed in our last report. Price now sits around the 20 week FLD support (shown on short term charts below).
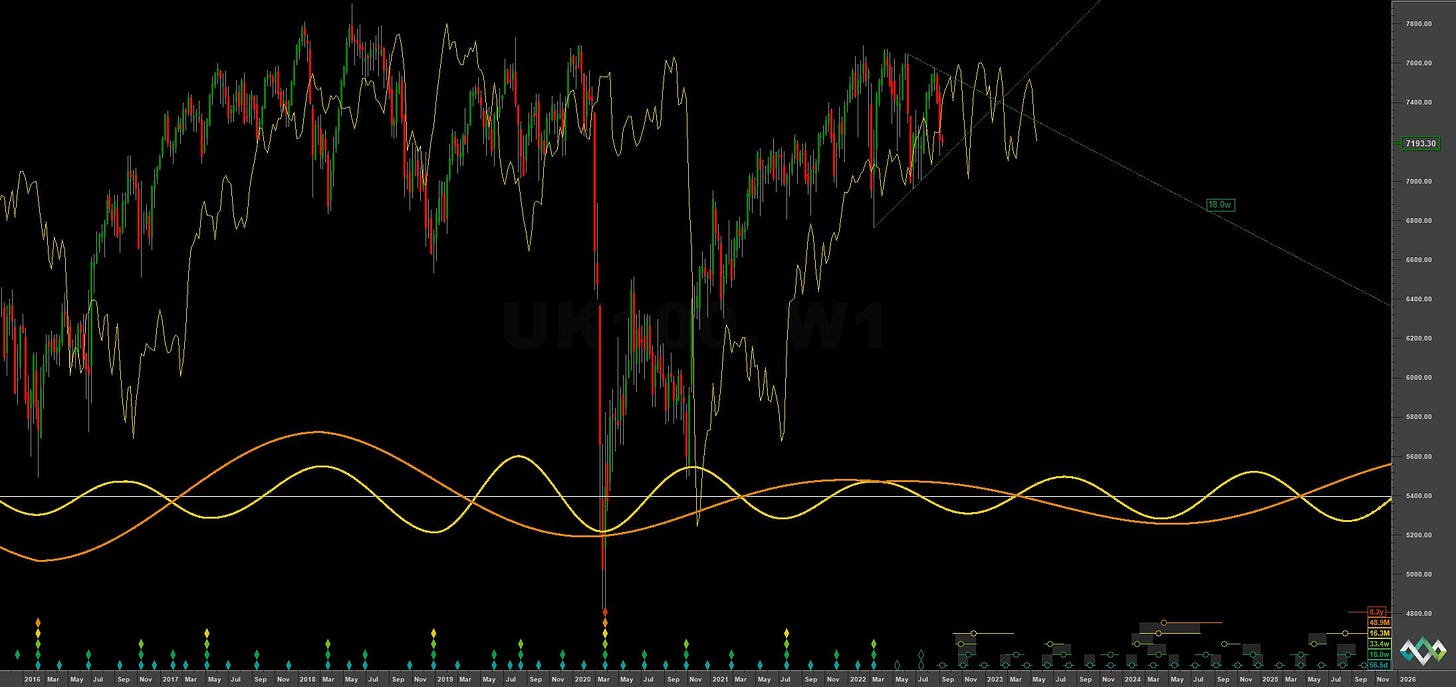
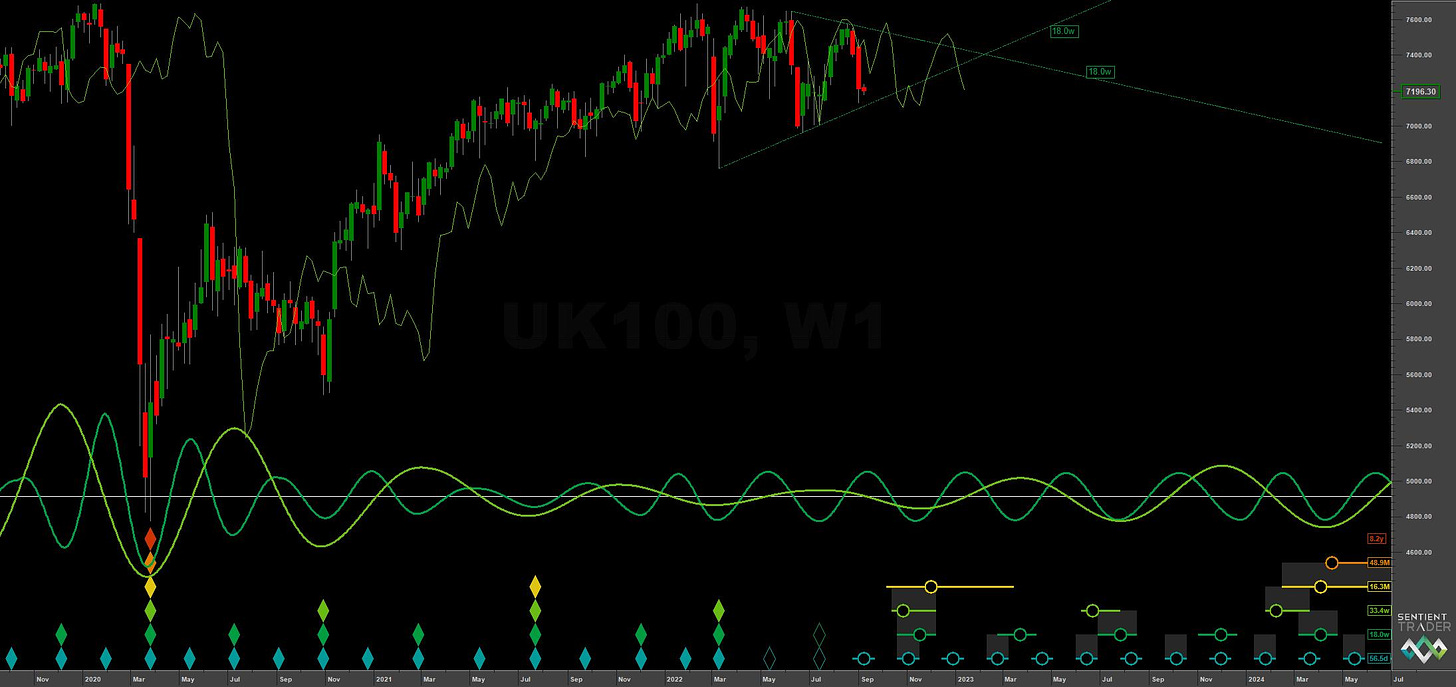
At the longer term scale first up and once again the overall more bearish nature of the FTSE is clear to see, with the amplitude of the 54 month component significantly weaker than it’s US counterparts out of the 2020 low. Price has been generally supported on a weekly basis by the 18 month FLD but this support is now broken, establishing a modest FLD cross target of 6974, according to Sentient Trader. It is more likely, in our opinion, price will fall much further over the next couple of months to around the 6600-6700 range and the 54 month FLD, as described in previous reports. The 18 month nominal low is due late October - early November at this point. It is highly likely the peak of the 54 month component has been seen in February - April 2022, with the next trough of this component due early 2024.
At the medium term the 20 week VTL, shown on all charts, will be significant. Price may well bounce off it for the incoming 80 day nominal low but it will be a brief ‘bull trap’. The subsequent breaking of that VTL to the downside confirms a peak of the 40 week component has occurred and, by implication here, the peak of the 18 month component. The 20 week cycle is also showing visual clarity, a testament to the neutral influence of the larger components, which are cresting.
Shorter term, price is probably in the final 10 or 20 day component of the current 80 day iteration, running at around 56 days from the phasing here. We are expecting the low of the 80 day component in global stockmarkets imminently and the FTSE will be no different. Should the phasing be correct the bounce will be short lived (2-3 weeks) and precede an even more vigorous move down in October.
Phasing Analysis
Long Term
Components greater than and including the 18 month nominal cycle
Medium Term
Components less than and including the 18 month nominal cycle
Short Term
Components around the 80 day nominal cycle
Trading Strategy
Interaction Status
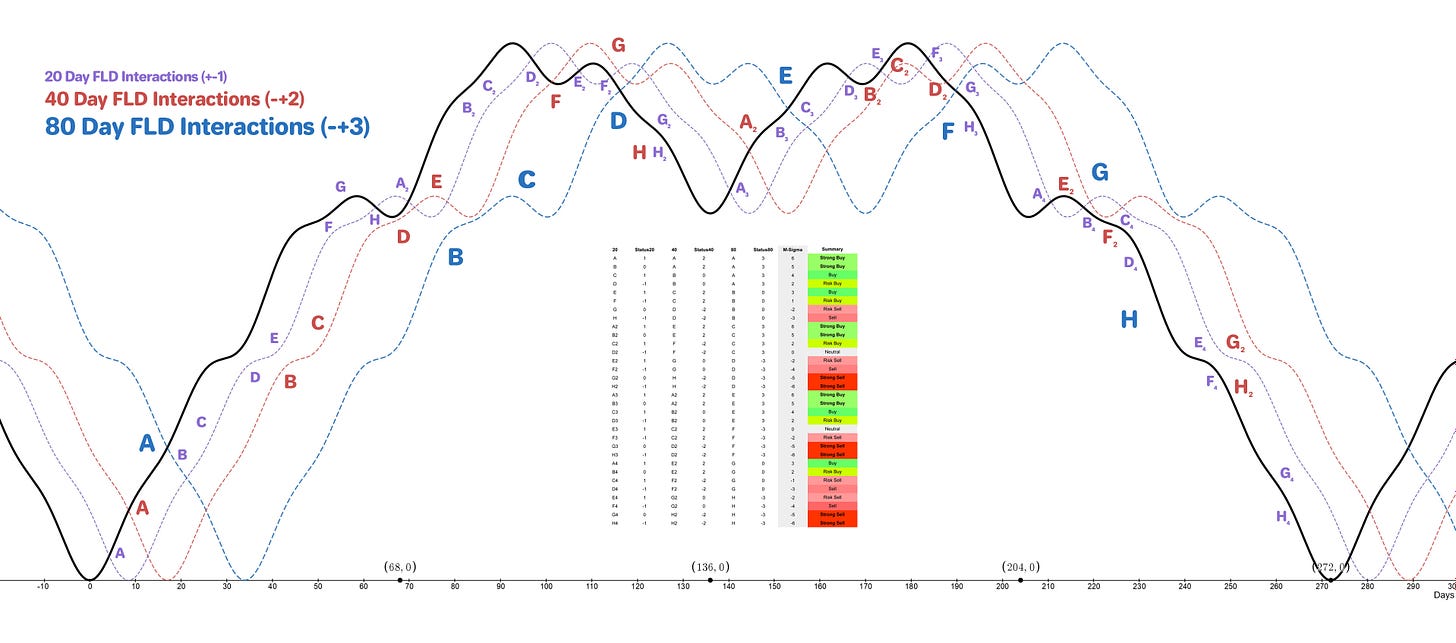
Interactions and price in the FLD Trading Strategy (Advanced). This looks at an idealised 40 week cycle and an array of 3 FLD signal cycles. We apply the instrument’s phasing to the model and arrive at an overall summary for the interactions with the 20 day FLD, current and forthcoming.
Sigma-L recommendation: Risk Buy
Entry: 10 Day FLD (risk on) / 20 Day FLD
Stop: Below formed 80 day nominal low
Target: 7350
Reference 20 Day FLD Interaction: A4
Underlying 40 Day FLD Status: E2
Underlying 80 Day FLD Status: G
Price is currently sitting around the 20 week FLD in what is likely the final 10 or 20 day component of the 80 day wave. Given that the next bounce from that component is likely to be relatively weak, the trade is a risk buy. Traders should begin to prepare for the short trade in the coming month or so which is likely to be more profitable. Watch for tracking of the 20 week FLD in this next rally with the 40 day nominal peak likely to come toward the last third of September.
The 20 week VTL will be an important line in the sand going forward and is shown in green on the short, medium and long term charts. The breach of this line indicates a peak of 40 week magnitude has occurred in the recent past. This will also be the peak of the 18 month component and likely the peak of the 4.5 year component, which last troughed in 2020.
FLD Settings
If you do not have the use of Sentient Trader use these settings to plot FLDs in your trading software (daily scale) to more easily follow trading signals and strategy from Sigma-L.
Make sure to account for non-trading days if your broker omits them in the data feed (weekends, for example). The below offsets are given with no added calculation for non-trading days.
80 day nominal: 56.5 days | 28 day FLD offset
40 day nominal: 29.4 days | 15 day FLD offset
20 day nominal: 15 days | 8 day FLD offset
10 day nominal: 7.9 days | 4 day FLD offset


