FTSE 100: Hurst Cycles - 6th January 2022
The FTSE has outperformed US markets in recent times but still underperforms at the longer components. Price is approaching the 20 week nominal peak, we look at the phasing here
Essentials: Nominal Model | FLD | FLD Trading Strategy | FLD Trading Strategy (Advanced) | Principle of Nominality | Underlying Trend | Time Frequency Analysis
Analysis Summary
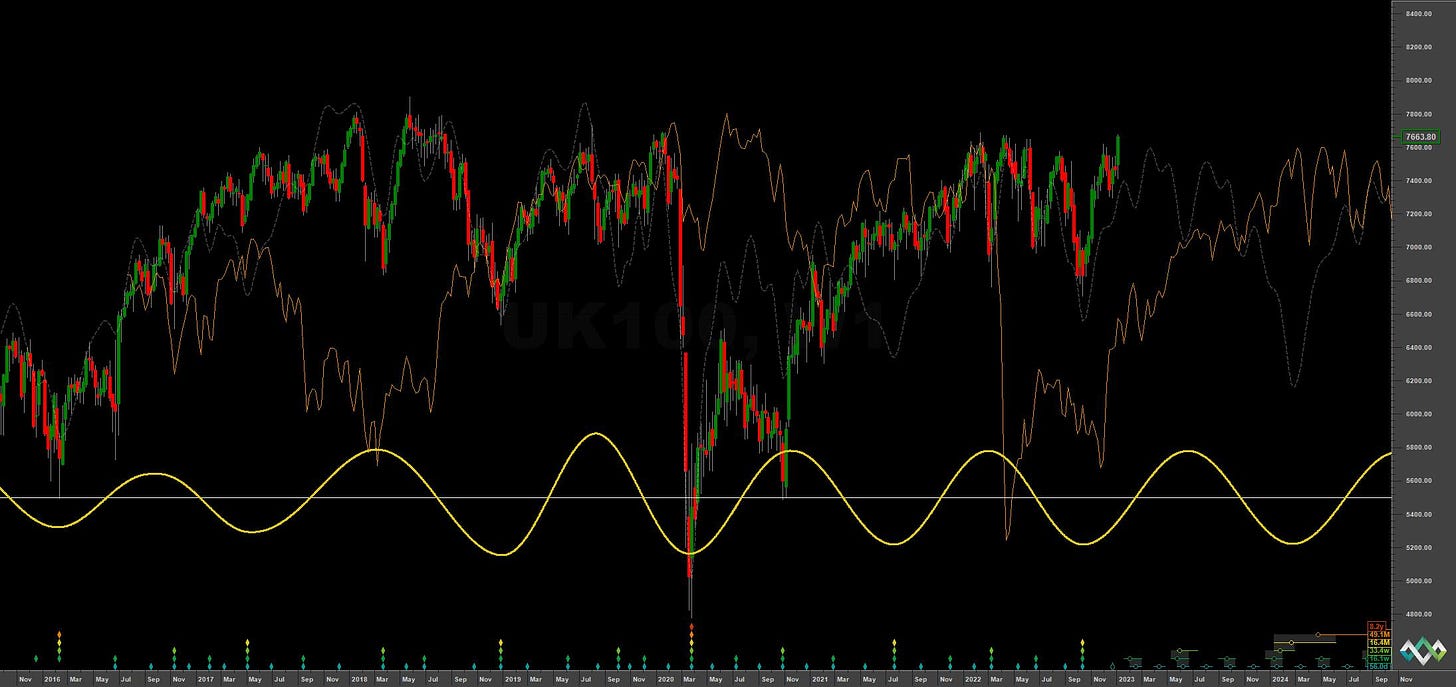
With the 18 month nominal low established in global markets in the middle of October 2022, it has been interesting to watch how the European indices have largely outperformed their US counterparts. Something that was not the case in the runup from the 2020 ‘covid’ lows. Typical of this reaction is the FTSE 100, which has helped guide the placement of the 18 month component low in other markets due to the principle of commonality, alongside the EUROSTOXX and DAX.
Across the planet the 18 month component in stockmarkets is running at around 15.5-16.5 months average wavelength.
In our last report we speculated as such, with the 80 day FLD target of 7305 being heavily overshot recently, prior to returning to that level (and the 80 day FLD support) for the most recent 80 day low iteration.
From 1st November Report:
The low is almost certainly a low of at least 20 week magnitude and, as the 20 week component has been quite outstanding in it’s clarity over recent months (see medium term chart below), we can work well on this basis. Should the 18 month component have occurred, we can expect the recent 80 day FLD target of 7305 to be approached
Now we begin the process of peaking from the first 20 week component of the 18 month component. The FTSE is quite the outlier in it’s bullishness compared to the US markets so perhaps we can expect a larger snapback in the retrace. Indeed the 18 month FLD has been a sticking point for the FTSE for many months, price oscillating around this area and testing the peaks around 7800 repeatedly. It is reasonable to expect, given the current long term phasing, price to continue to track the 18 month FLD into the 40 week low, due toward the middle of 2023. At some point the underlying trend, as it stands, will exert a more bearish influence on price, likely later in this 18 month component. However as we saw in the build up to the lows in 2020, the FTSE can form late peaks and then collapse spectacularly.
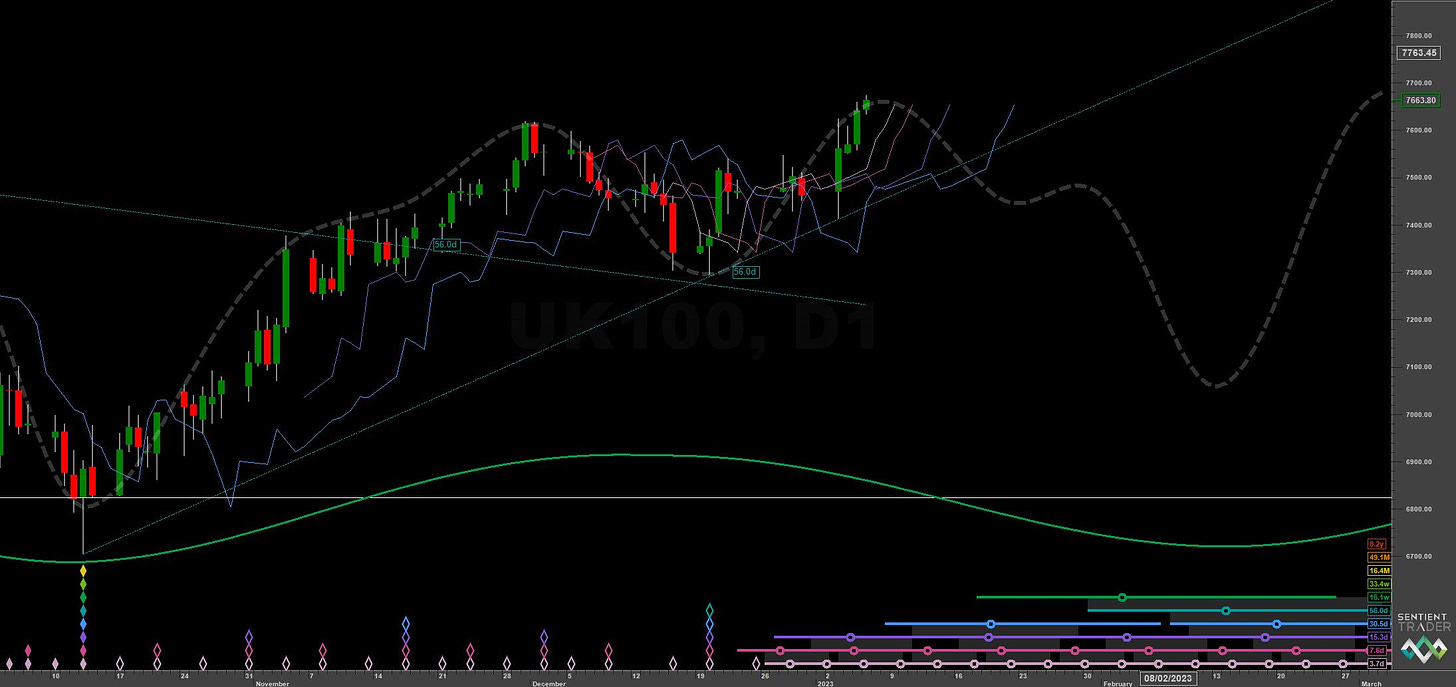
At the shorter term price formed the most recent 80 day component low around the 20th of December and is likely starting the process of peaking from the 40 day component. A 80 day VTL can be drawn between recent lows of this component for a good line in the sand confirmation of the 20 week peak occurring in the future. This is shown in the short term chart below.
Phasing Analysis
Sentient Trader
Utilising a pattern recognition algorithm and Hurst’s diamond notation

Trading Strategy
Interaction Status
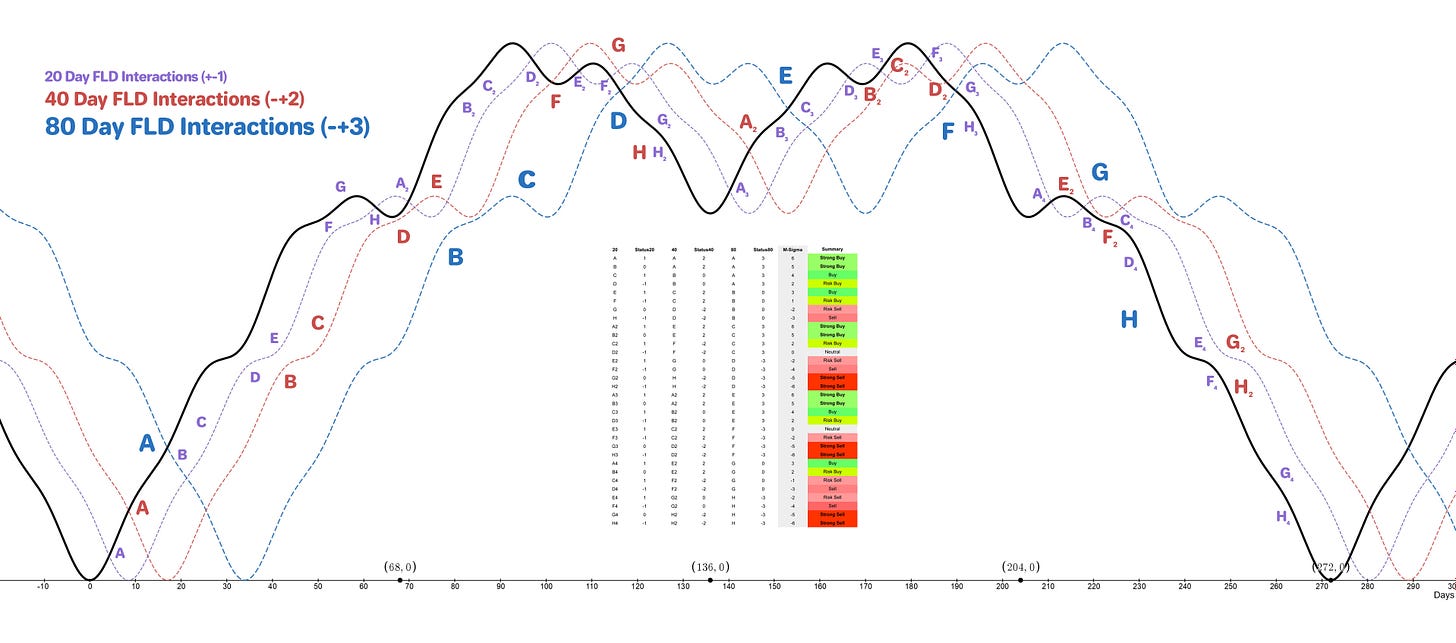
Interactions and price in the FLD Trading Strategy (Advanced). This looks at an idealised 40 week cycle and an array of 3 FLD signal cycles. We apply the instrument’s phasing to the model and arrive at an overall summary for the interactions with the 20 day FLD, current and forthcoming.
Sigma-L recommendation: Sell
Entry: 10 day FLD / 20 Day FLD
Stop: Above forming 40 day nominal peak
Target: 7500 then 7200
Reference 20 Day FLD Interaction: D2
Underlying 40 Day FLD Status: F
Underlying 80 Day FLD Status: D
Standard entry for this likely peak of the 40 day component. A sharp move to 7500 would suggest the underlying trend is indeed overextended relative to other equity markets as discussed above. Take note of the FLD cross target in relation to the 40 day FLD when it occurs.
The 80 day component peak would then be a lower peak, due late January and forming a classic ‘head and shoulders’ pattern.
FLD Settings
If you do not have the use of Sentient Trader use these settings to plot common FLDs in your trading software (daily scale) to more easily follow trading signals and strategy from Sigma-L.
Make sure to account for non-trading days if your broker omits them in the data feed (weekends, for example). The below offsets are given with no added calculation for non-trading days.
80 day nominal: 56 days | 28 day FLD offset
40 day nominal: 30.5 days | 15 day FLD offset
20 day nominal: 15.3 days | 8 day FLD offset
10 day nominal: 7.6 days | 4 day FLD offset


