


GBPUSD: Hurst Cycles - 22nd September 2022
Ahead of the Bank of England rate decision today we look at the imminent low of at least 20 week magnitude in cable. This report is our first on Sigma-L for GBPUSD as we track a historic decline

Tools required: Nominal Model | FLD | FLD Trading Strategy | FLD Trading Strategy (Advanced) | Principle of Nominality | Underlying Trend
Analysis Summary
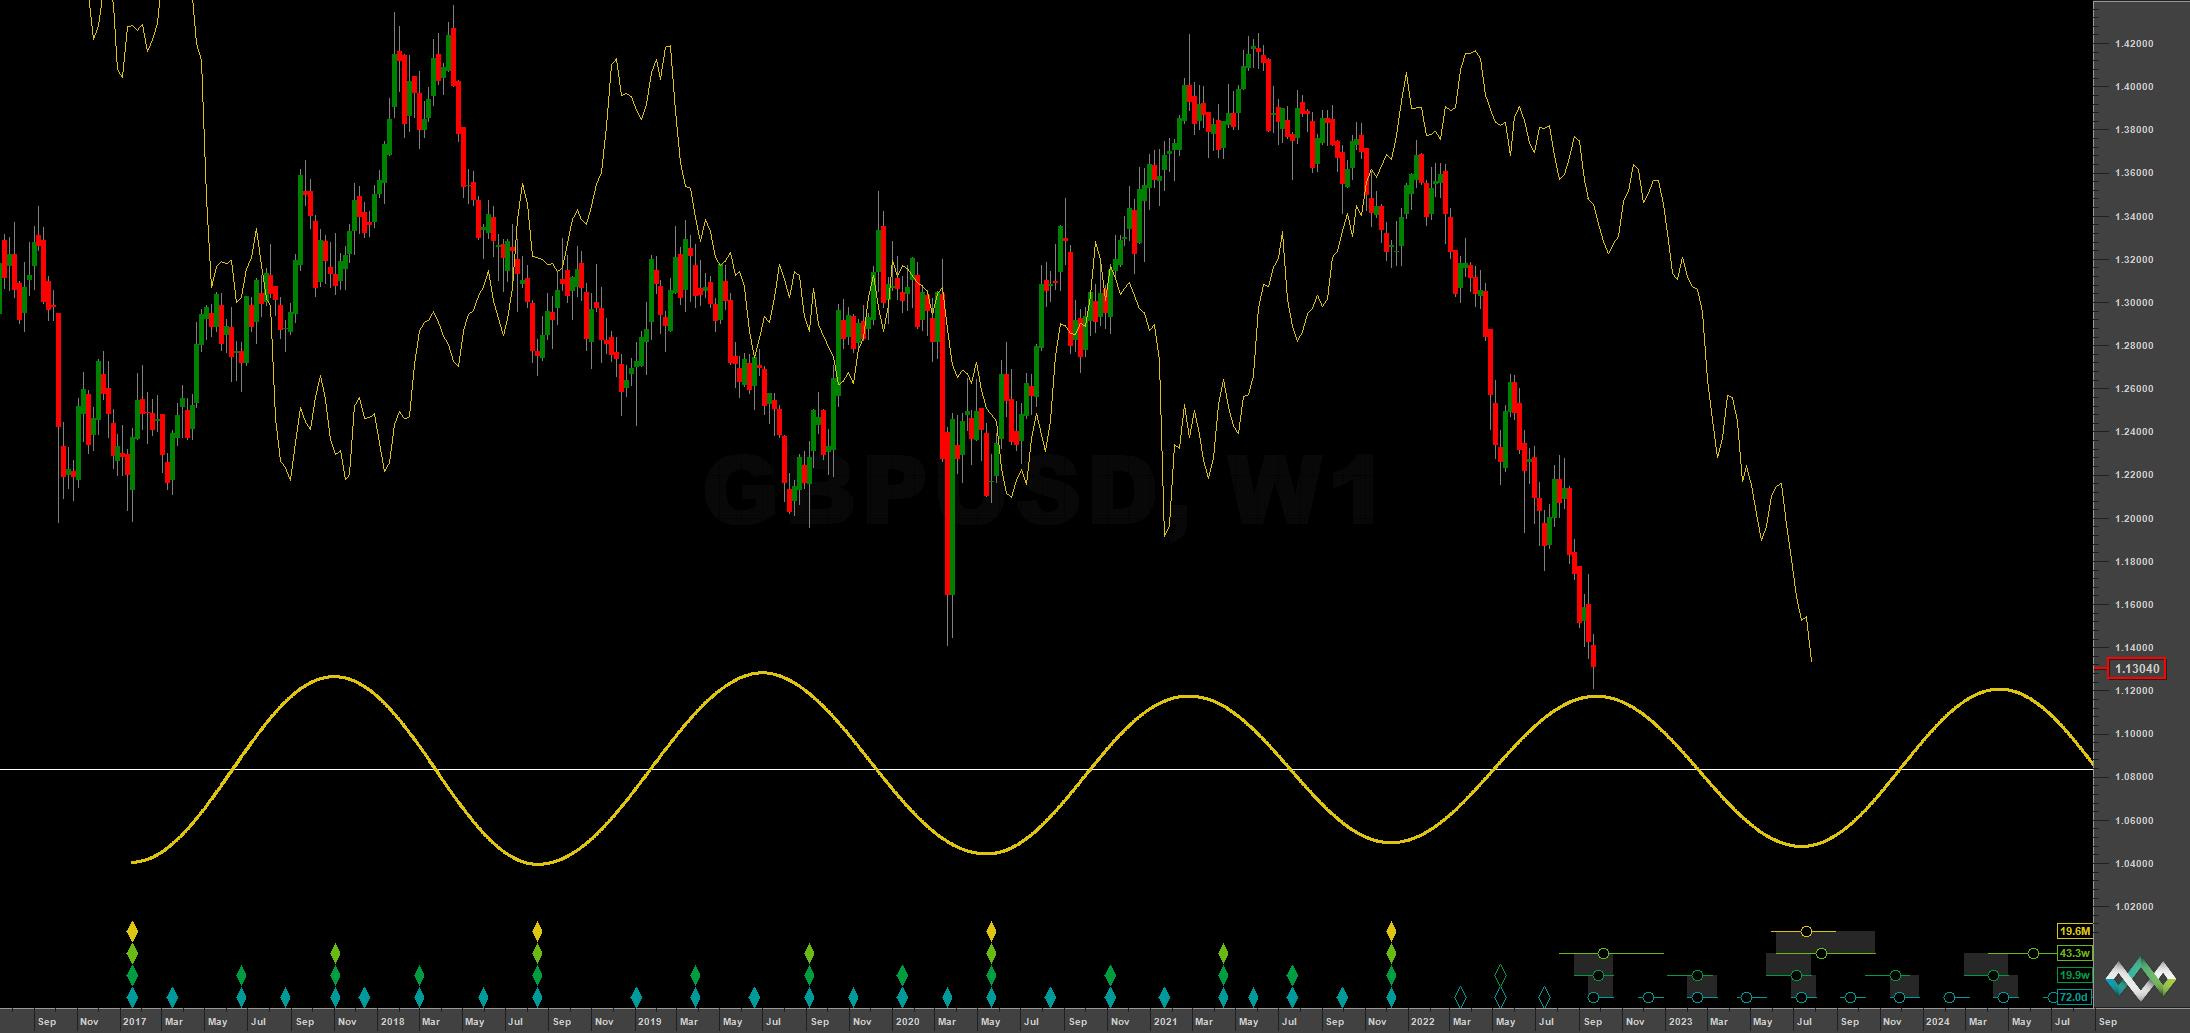
In our first report into GBPUSD below we examine the shorter term phasing in addition to acknowledging the ominous looking long term phasing. The longer term is a possible rare insight into the existence of the fabled Kondratiev wave, the last trough of which occurred in 1985.

Above is the very long term phasing of sterling, with the 9 year component a stunning signal (@ 8.8 years) since 1976 in this sample. The Kondratiev wave is proposed to be around 50-60 years in wavelength and was alluded by Hurst as the ‘54 year nominal wave’. There was very little data around in Hurst’s time to assert many examples of the existence of this component, save for stock markets. To see a possible appearance in another market is very interesting for all market analysts and historians. We can assume that the last low of this component was in 1985, with a 3:1 ratio proposed to exist between it and the 18 year component. The most recent 18 year component low, occurring somewhere around 2019-2020 has been incredibly weak, infact quite ominously so. This suggests the decline of the pound (or at least a long period of sideways price action) into 2027-2028 and the next 9 year nominal component low. Subsequent to that will be the final 9 year component of the proposed K wave into 2036.
Is this a map of the final decline of a once great currency?
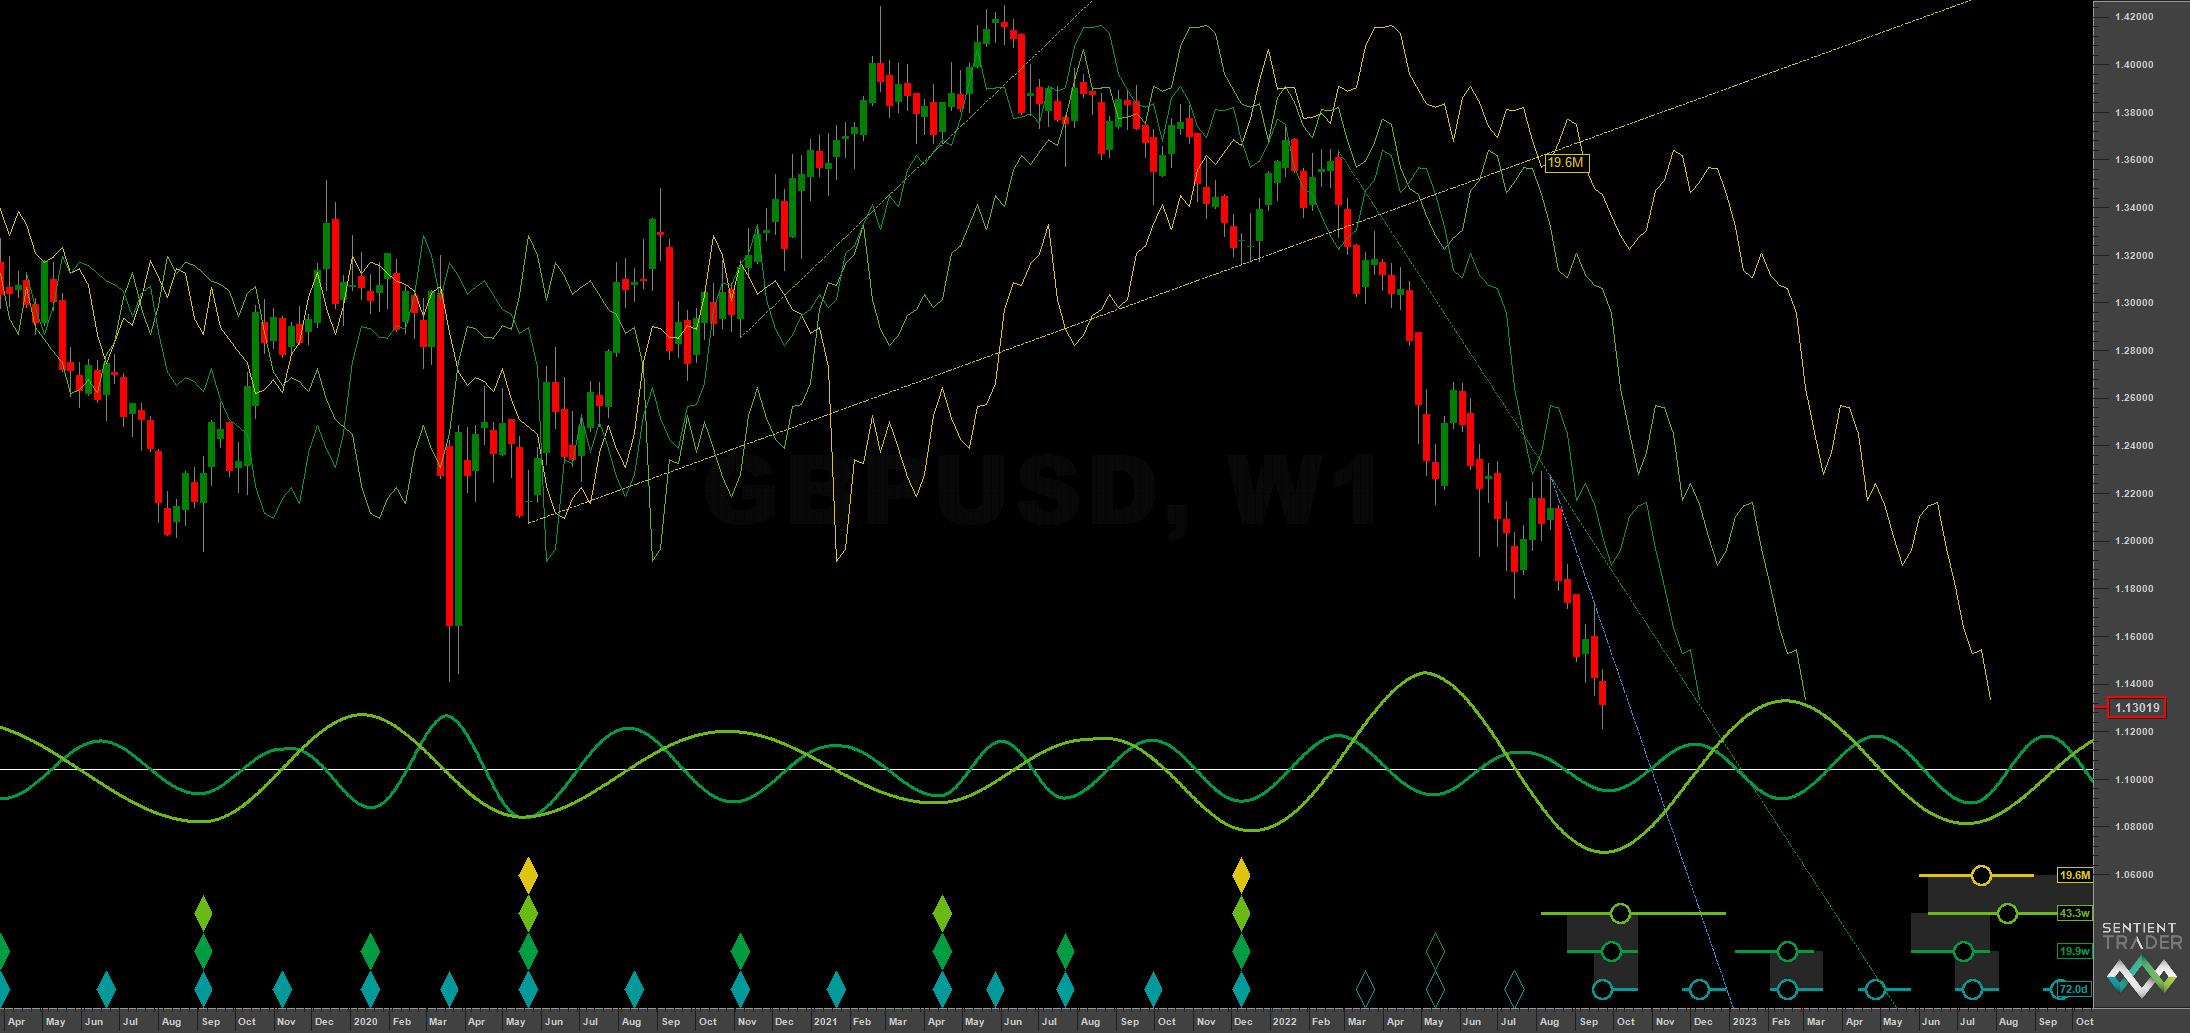
Of interest right now is a 40 week component low forming in price. The move up from the 18 month low in 2020 was choppy, being as it was around volatility introduced by the pandemic. The subsequent up and down movement to now time suggests a heavily straddled most recent 18 month low in December 2021 -this is our current phasing. The bullish move forthcoming is likely to be a ‘bear market rally’ and will likely be attributed to our friends at the Bank of England raising rates faster than anticipated. This is not the reason however, as the periodic components amply demonstrate and will continue to demonstrate.
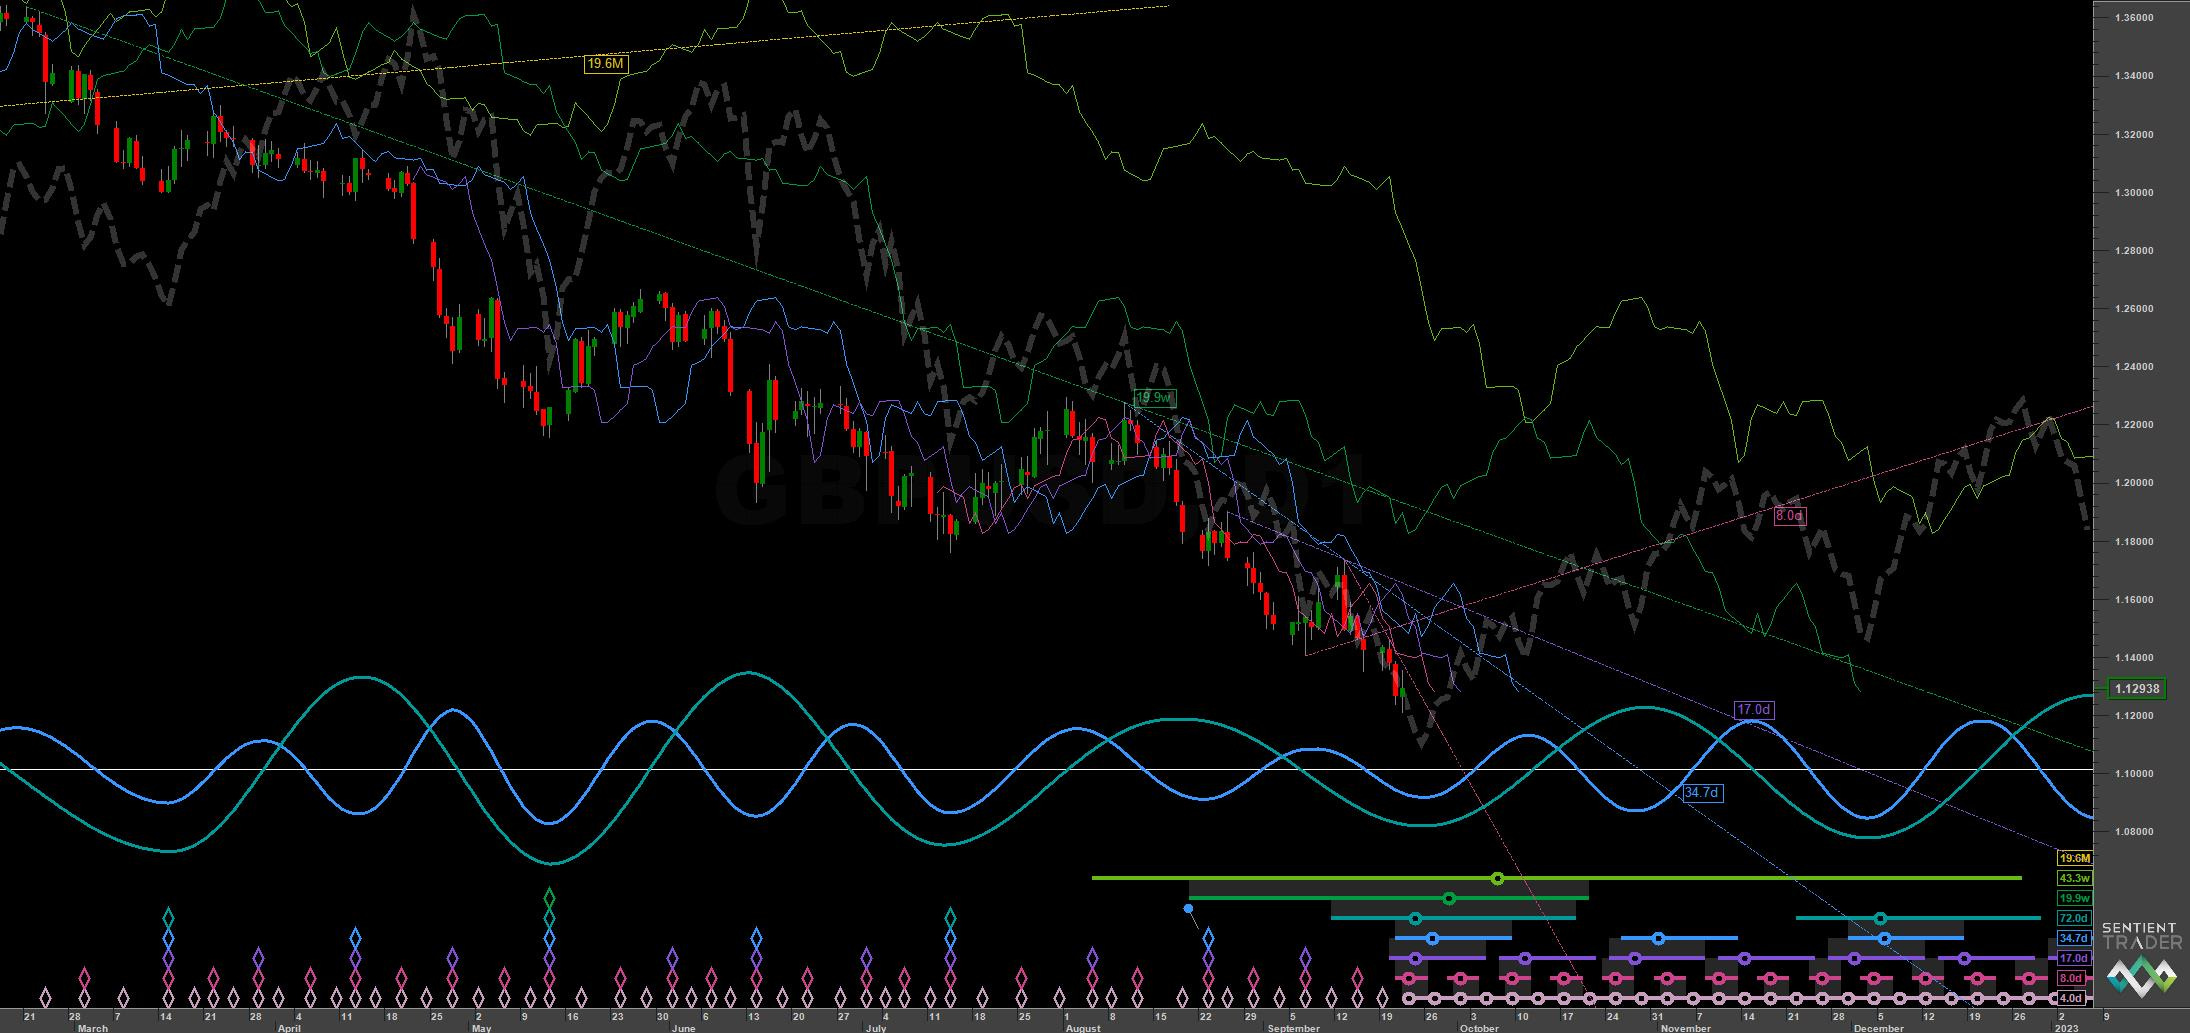
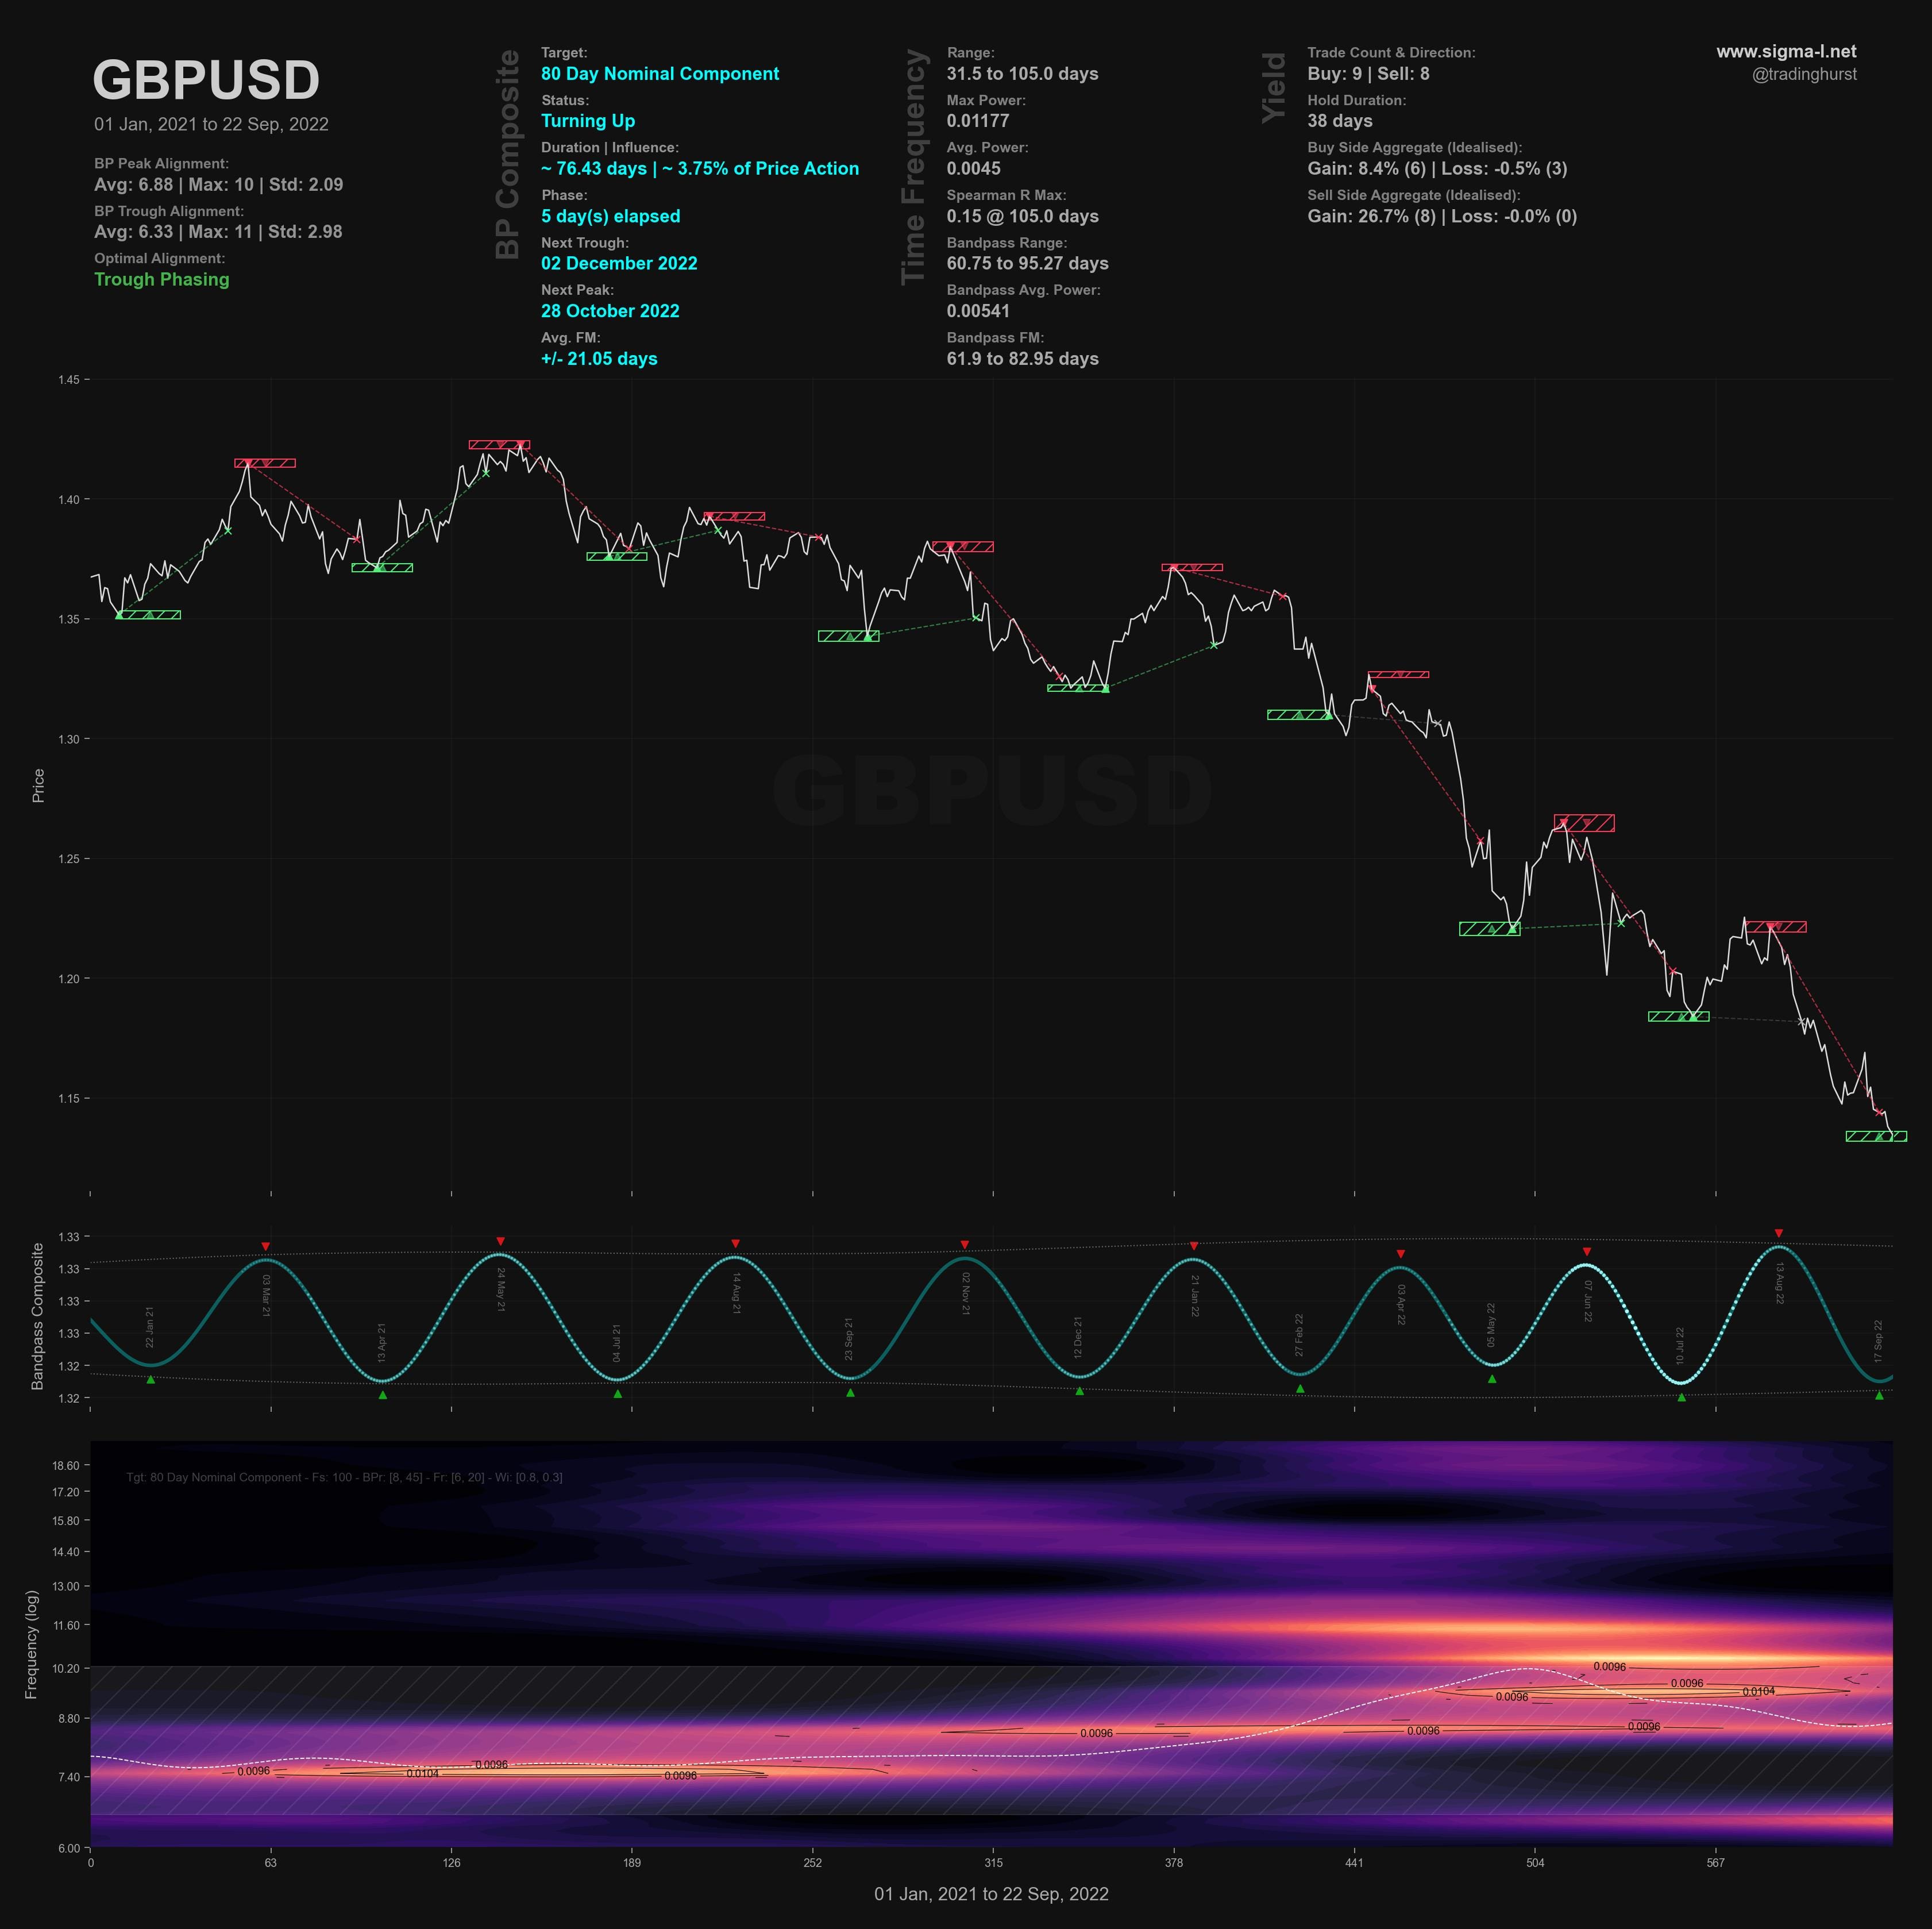
The 40 day, 80 day and 20 week components have all been excellent in the recent decline from early 2022 and give good confidence in this phasing. This is shown in detail on the short term chart below. The 80 day component, running at around 72-77 days average wavelength over the sample, is highlighted in the time frequency analysis below.
Phasing Analysis
Long Term
Components greater than and including the 18 month nominal cycle
Medium Term
Components less than and including the 18 month nominal cycle
Short Term
Components around the 80 day nominal cycle
Time Frequency
Wavelet convolution output targeting the 80 day nominal component
Trading Strategy
Interaction Status
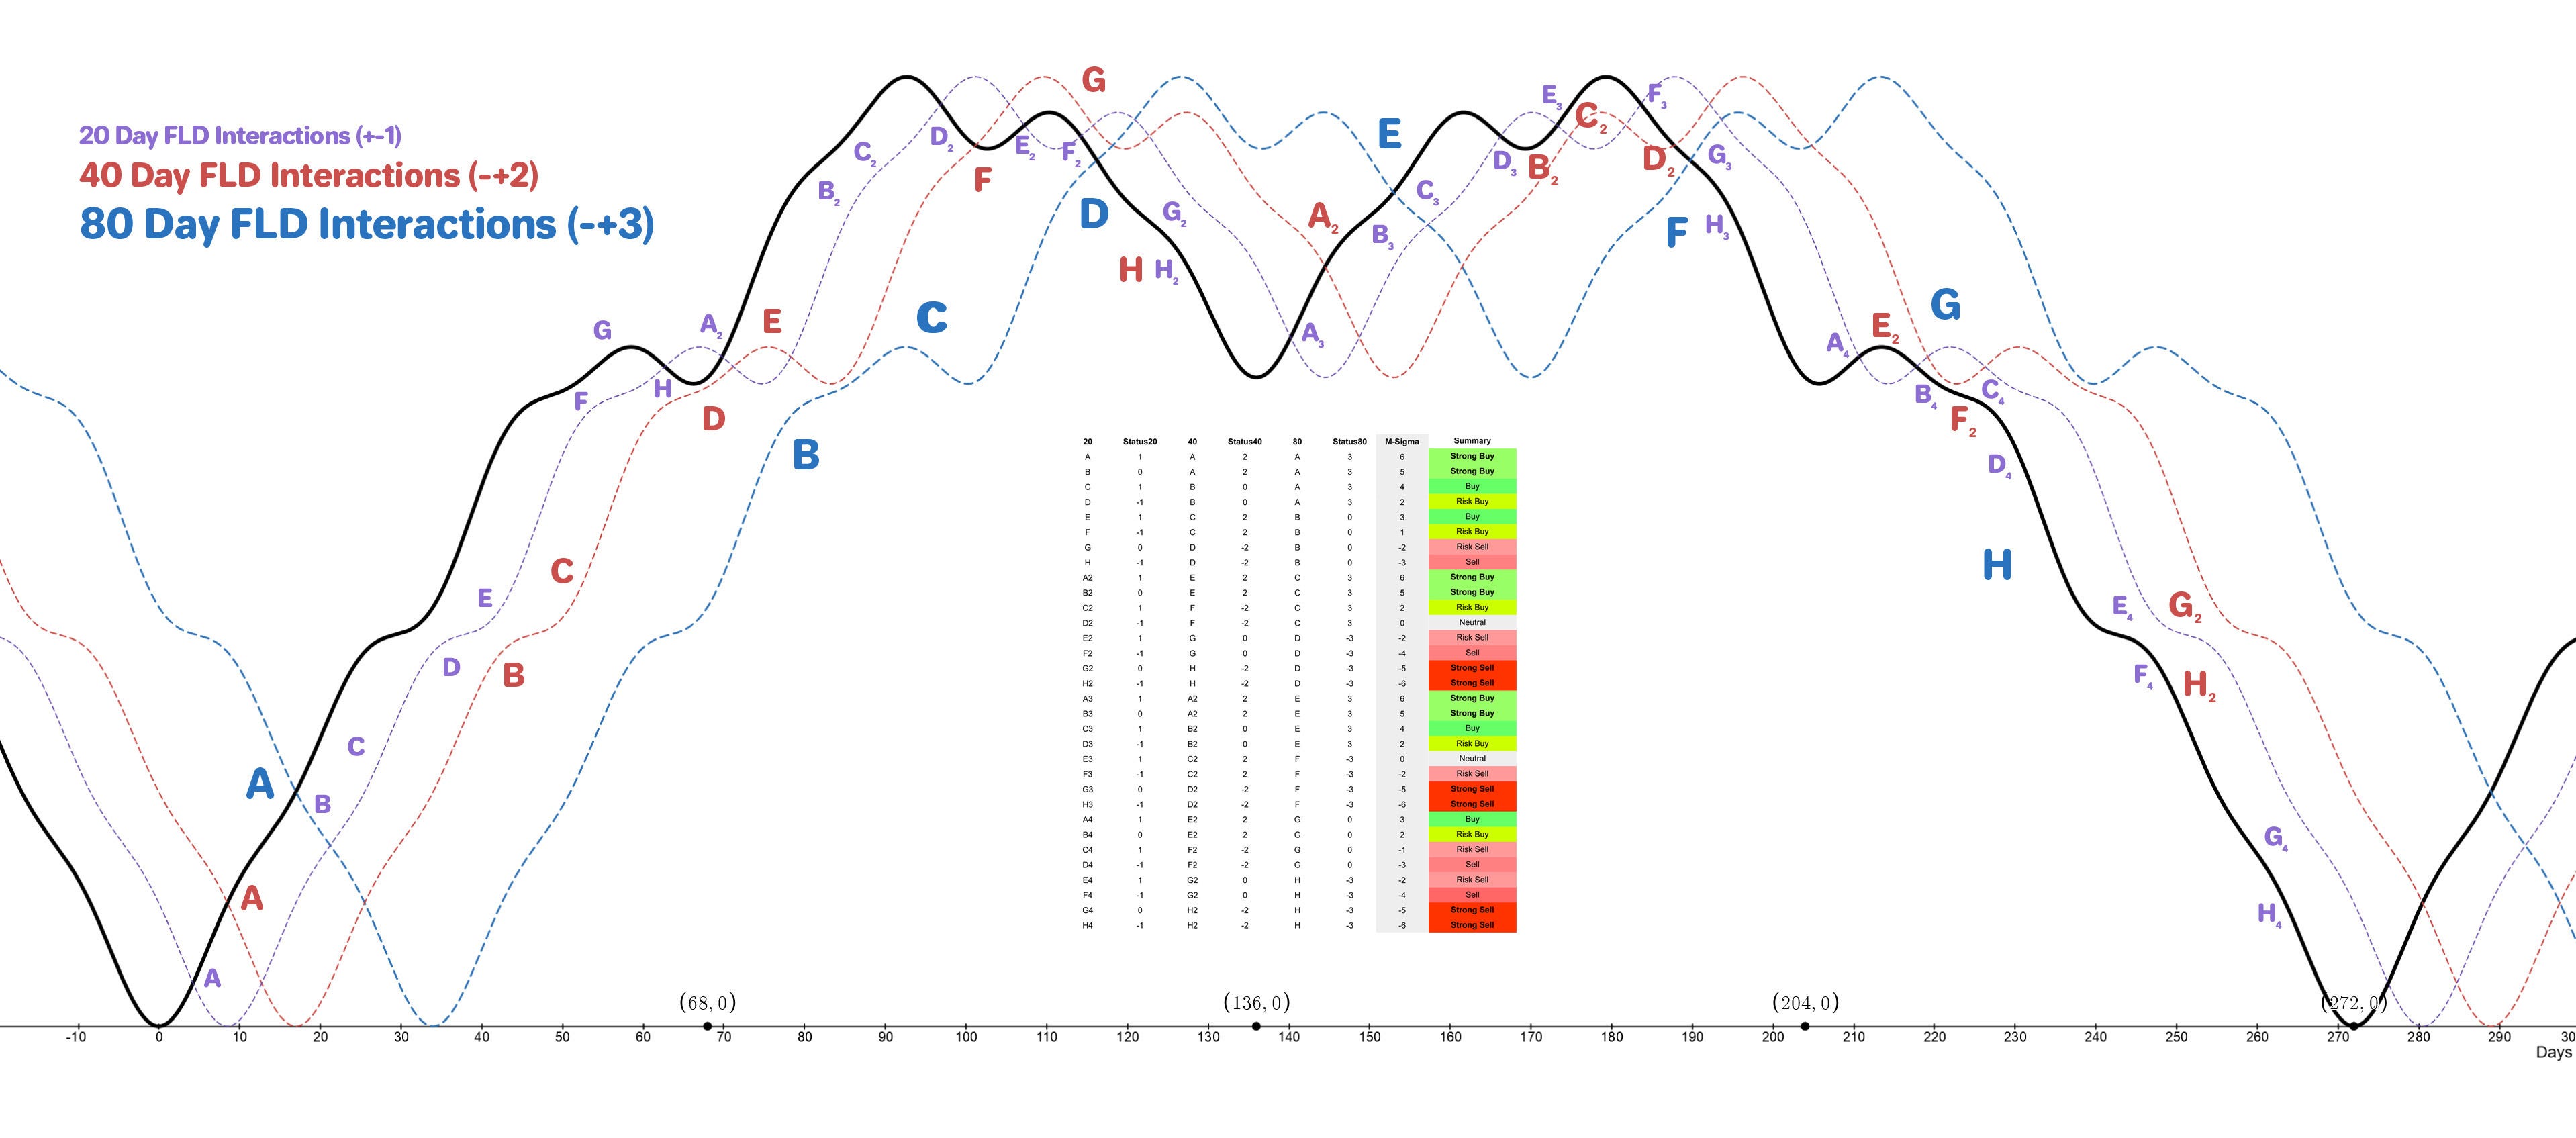
Interactions and price in the FLD Trading Strategy (Advanced). This looks at an idealised 40 week cycle and an array of 3 FLD signal cycles. We apply the instrument’s phasing to the model and arrive at an overall summary for the interactions with the 20 day FLD, current and forthcoming.
Sigma-L recommendation: Strong Buy
Entry: 10 Day FLD (risk on) / 20 day FLD
Stop: Below formed 80 day nominal low (also probable 20 / 40 week low)
Target: 1.20 - 1.22
Reference 20 Day FLD Interaction: A
Underlying 40 Day FLD Status: A
Underlying 80 Day FLD Status: A
A classic bullish cascade has formed above price for the large low we are expecting, accompanied by a tight nest of lows, shown on the short term chart. Entries via the 10 day FLD or VTL are risk on, the 20 day FLD or 40 day VTL offer less risk but less reward, as always. Targets are up at the 40 week FLD in the next month or two, around 1.20-1.22.
FLD Settings
If you do not have the use of Sentient Trader use these settings to plot FLDs in your trading software (daily scale) to more easily follow trading signals and strategy from Sigma-L.
Make sure to account for non-trading days if your broker omits them in the data feed (weekends, for example). The below offsets are given with no added calculation for non-trading days.
80 day nominal: 72 days | 36 day FLD offset
40 day nominal: 34.7 days | 17 day FLD offset
20 day nominal: 17 days | 8 day FLD offset
10 day nominal: 8 days | 4 day FLD offset