


ΣL Gold Composite - 26th April 2023 | @ 527 Days | Snippet
'C' class signal detected in Gold composite (XAU vs USD/EUR/CAD/GBP). Average wavelength of 527 Days over 5 completed sample iterations since February 2015. Currently approaching a peak

See Also: Gold Snippet: 56 Day Cycle | Gold Market Cycles March 2023
Signal Class & Attributes
Defining characteristics of the component detected over the sample period.
Detected Signal Class: C - learn more
Average Wavelength: 527 Days
Completed Iterations: 5
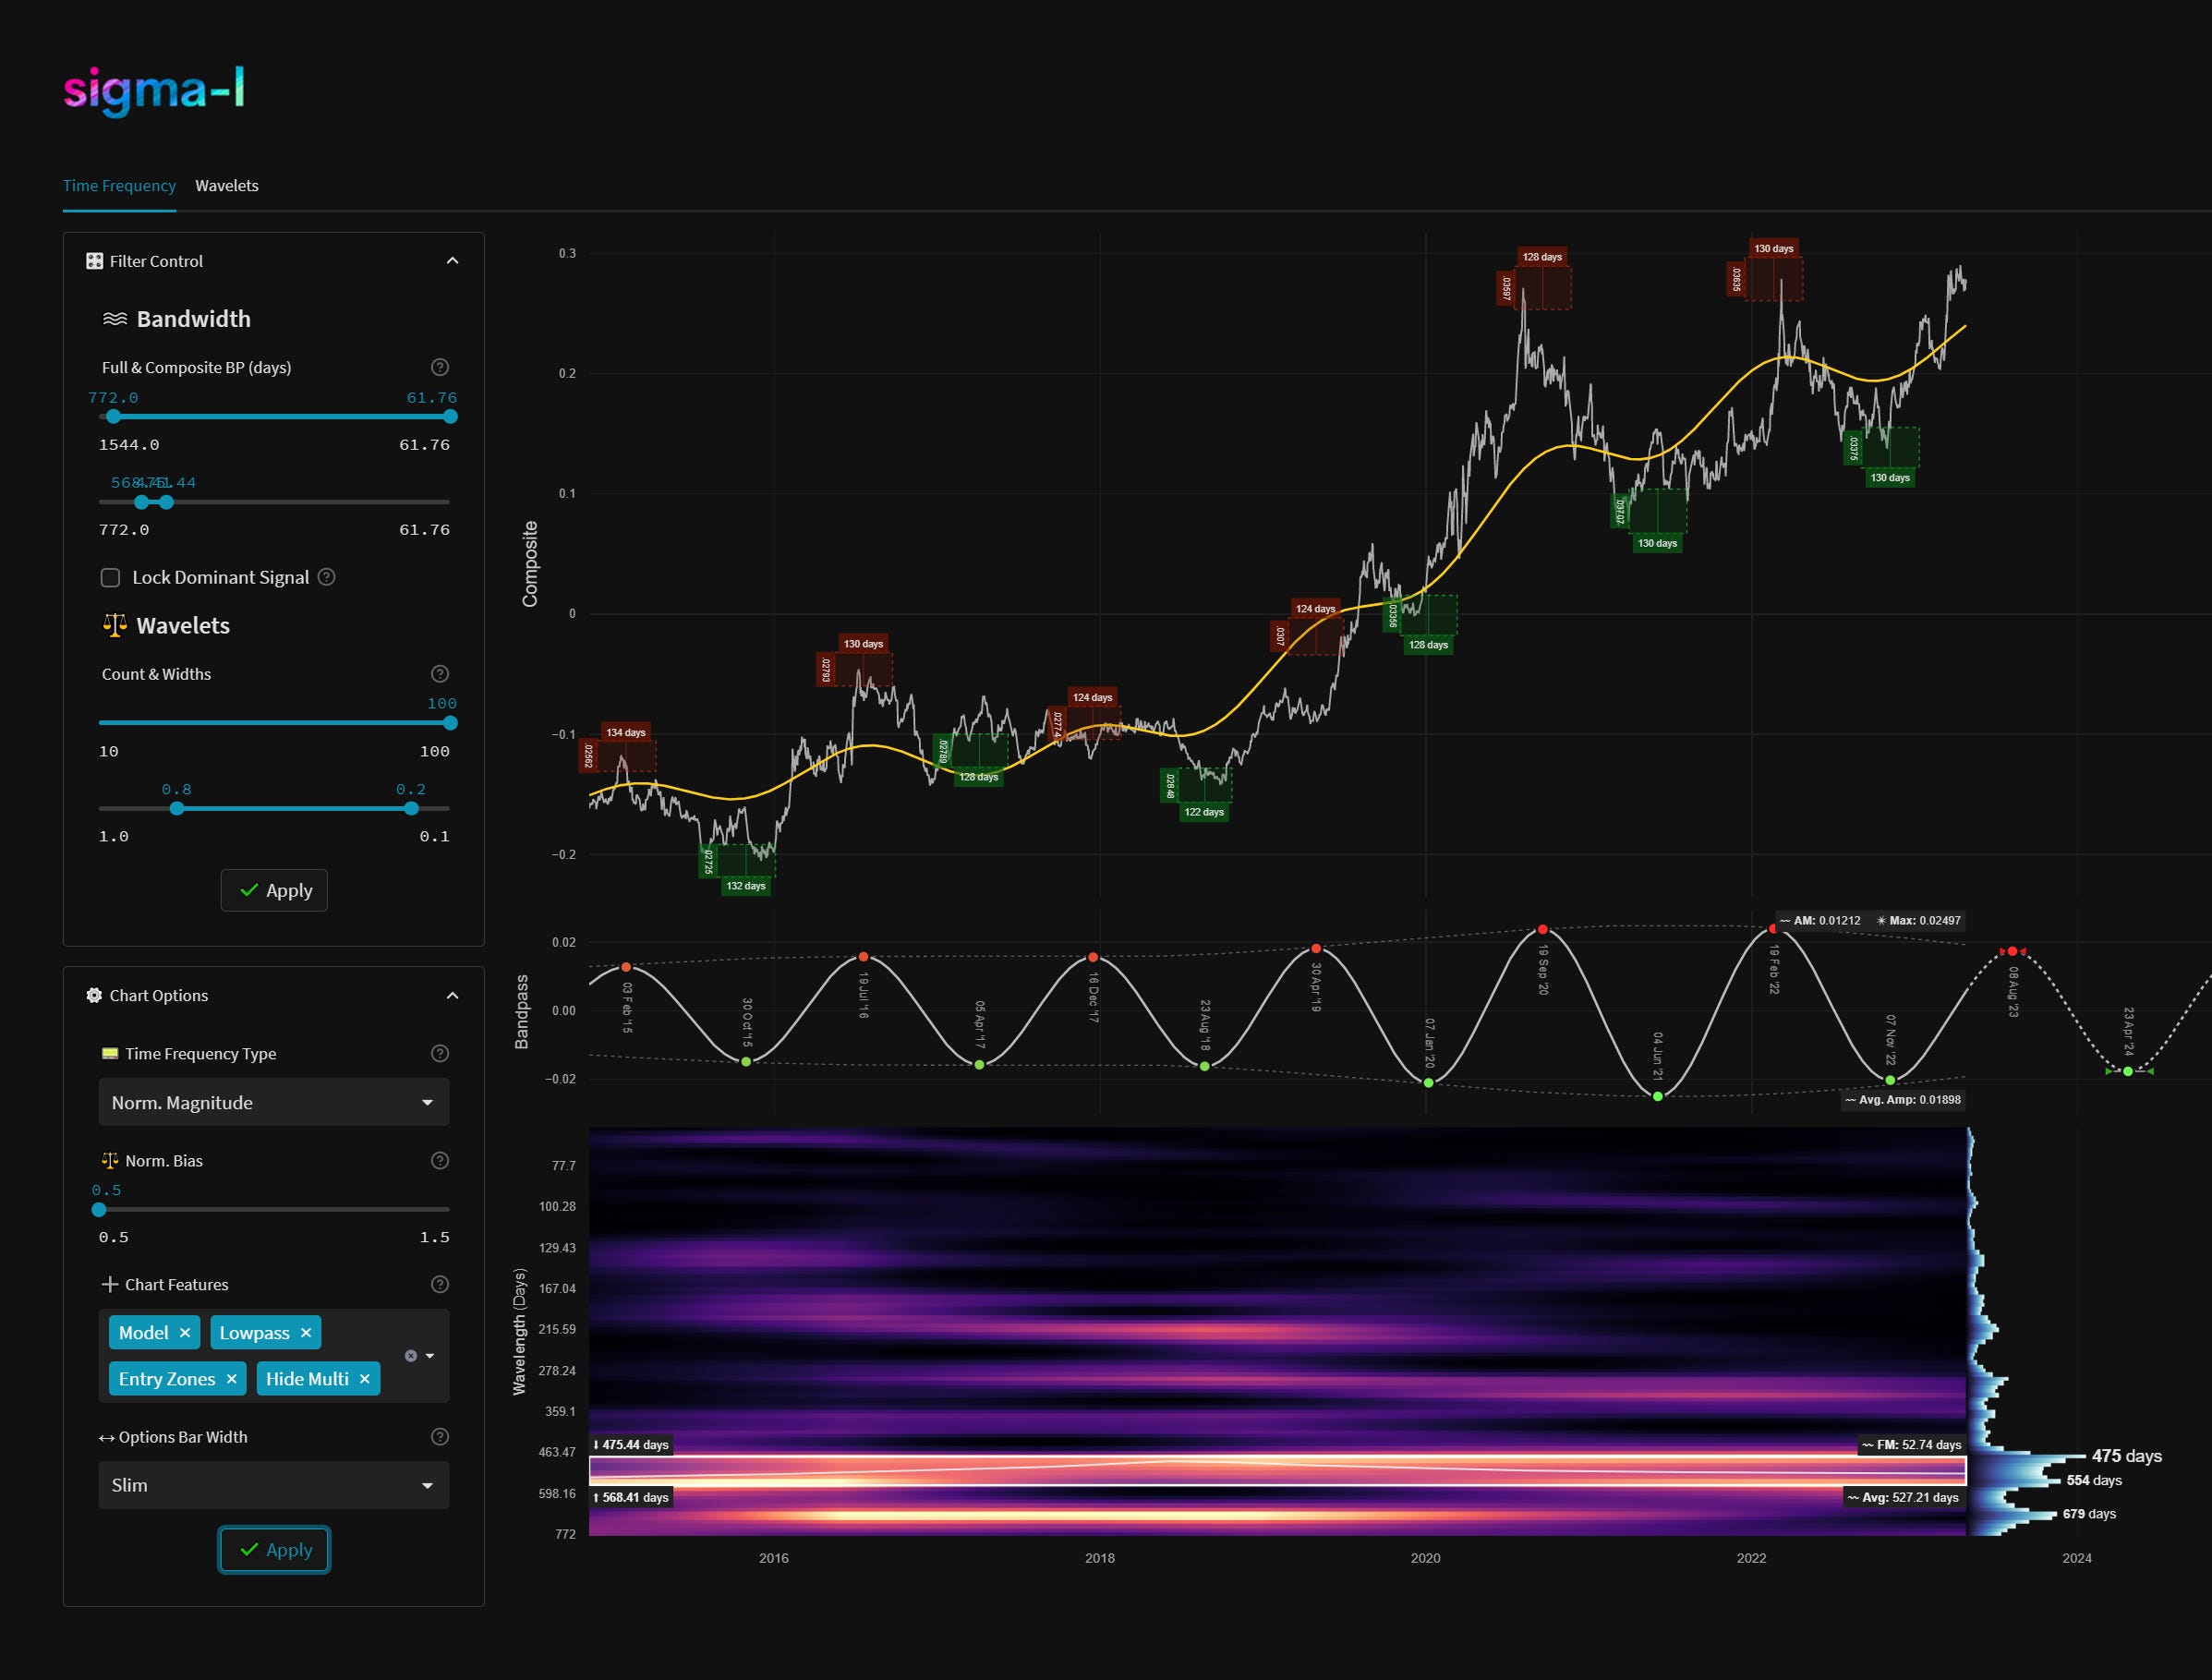
Time Frequency Analysis
Time frequency charts (learn more) below will typically show the cycle of interest against price, the bandpass output alone and the bandwidth of the component in the time frequency heatmap, framed in white. If a second chart is displayed it will usually show highpassed price with the extracted signal overlaid for visual clarity.
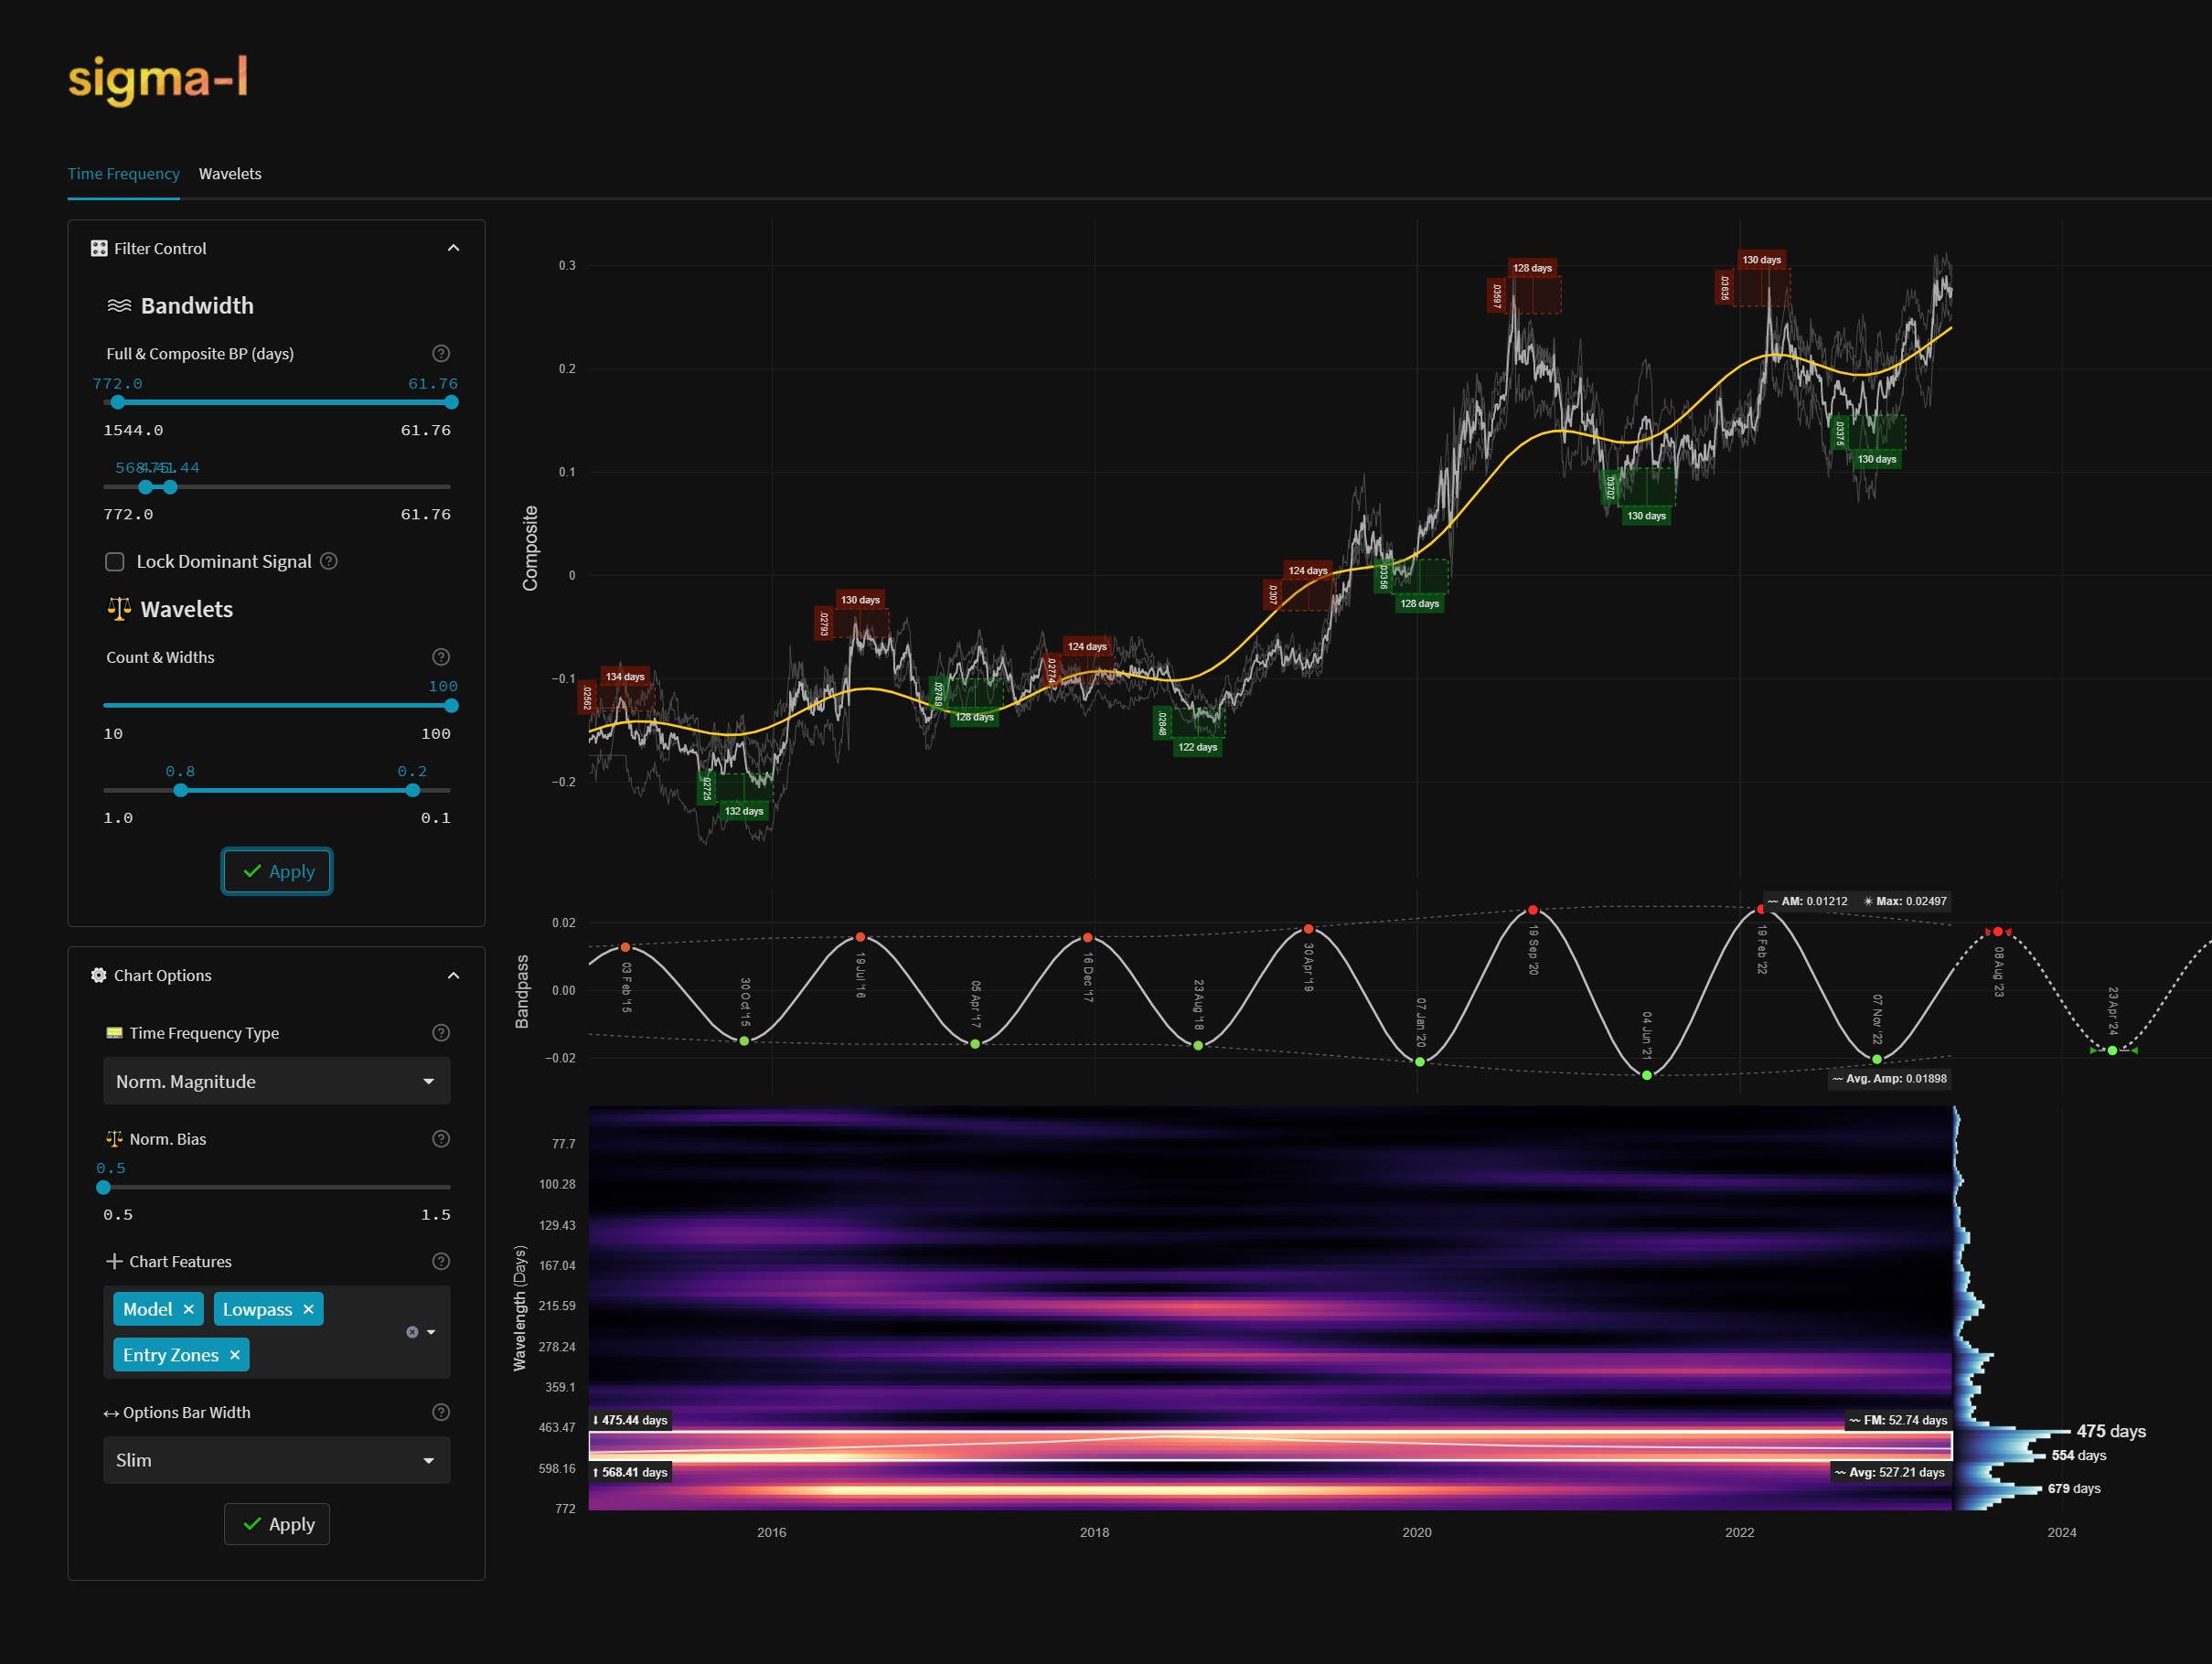
Signal Detail & Targets
Here we give more detail on the signal and our expectations for price, given the detected attributes of the component. In most cases the time target to hold a trade for is more important, given we focus on cycles in financial markets. Forthcoming trough and peak ranges are based upon the frequency modulation in the sample.
Phase: Approaching Peak1
FM: +- 52 Days2
AM: N/A (Composite)3
Next Trough Range: March 2nd - June 14th 2024
Next Peak Range: June 17th - September 29th 2023
Sigma-L Recommendation: Early Sell
Time Target: ~ 23rd April 2024
Price Target: N/A (Composite)
DISCLAIMER: This website/newsletter and the charts/projections contained within it are intended for educational purposes only. Results and projections are hypothetical. We accept no liability for any losses incurred as a result of assertions made due to the information contained within Sigma-L. This report is not intended to instruct investment or purchase of any financial instrument, derivative or asset connected to the information conveyed in the report. Trade and invest at your own risk.
Signal Phase: This is ‘how far along’ the cycle is in it’s period at nowtime and is related to the predicted price action direction.
Signal Frequency Modulation: This is how much, on average, the signal detected varies in frequency (or wavelength) over the whole sample. A lower variance is better and implies better profitability for the component. Frequency modulates relatively slowly over several iterations usually.
Signal Amplitude Modulation: This is how much the component gains or loses power (price influence) across the sample, on average. Amplitude modulation can happen quite quickly and certainly is more evident than frequency modulation in financial markets. The more stable the modulation the better.
Just wanna thank you for put hard work putting together so many high-quality updates in various markets. I'm feeling lucky as subcriber. I believe much more people should subcribe to this.
Nice detection! Somewhat less robust than the 55~days but very interesting to watch how gold would react approaching this cycle peak.