


Gold - Market Cycles - 27th March 2023
Gold moves strongly up via the beacon at ~55 days, reaching and exceeding all our upside targets. A peak in this wave is due, we look at the latest in this report, alongside longer term analysis

Essentials: Nominal Model | FLD | FLD Trading Strategy | FLD Trading Strategy (Advanced) | Underlying Trend | Time Frequency Analysis
Analysis Summary
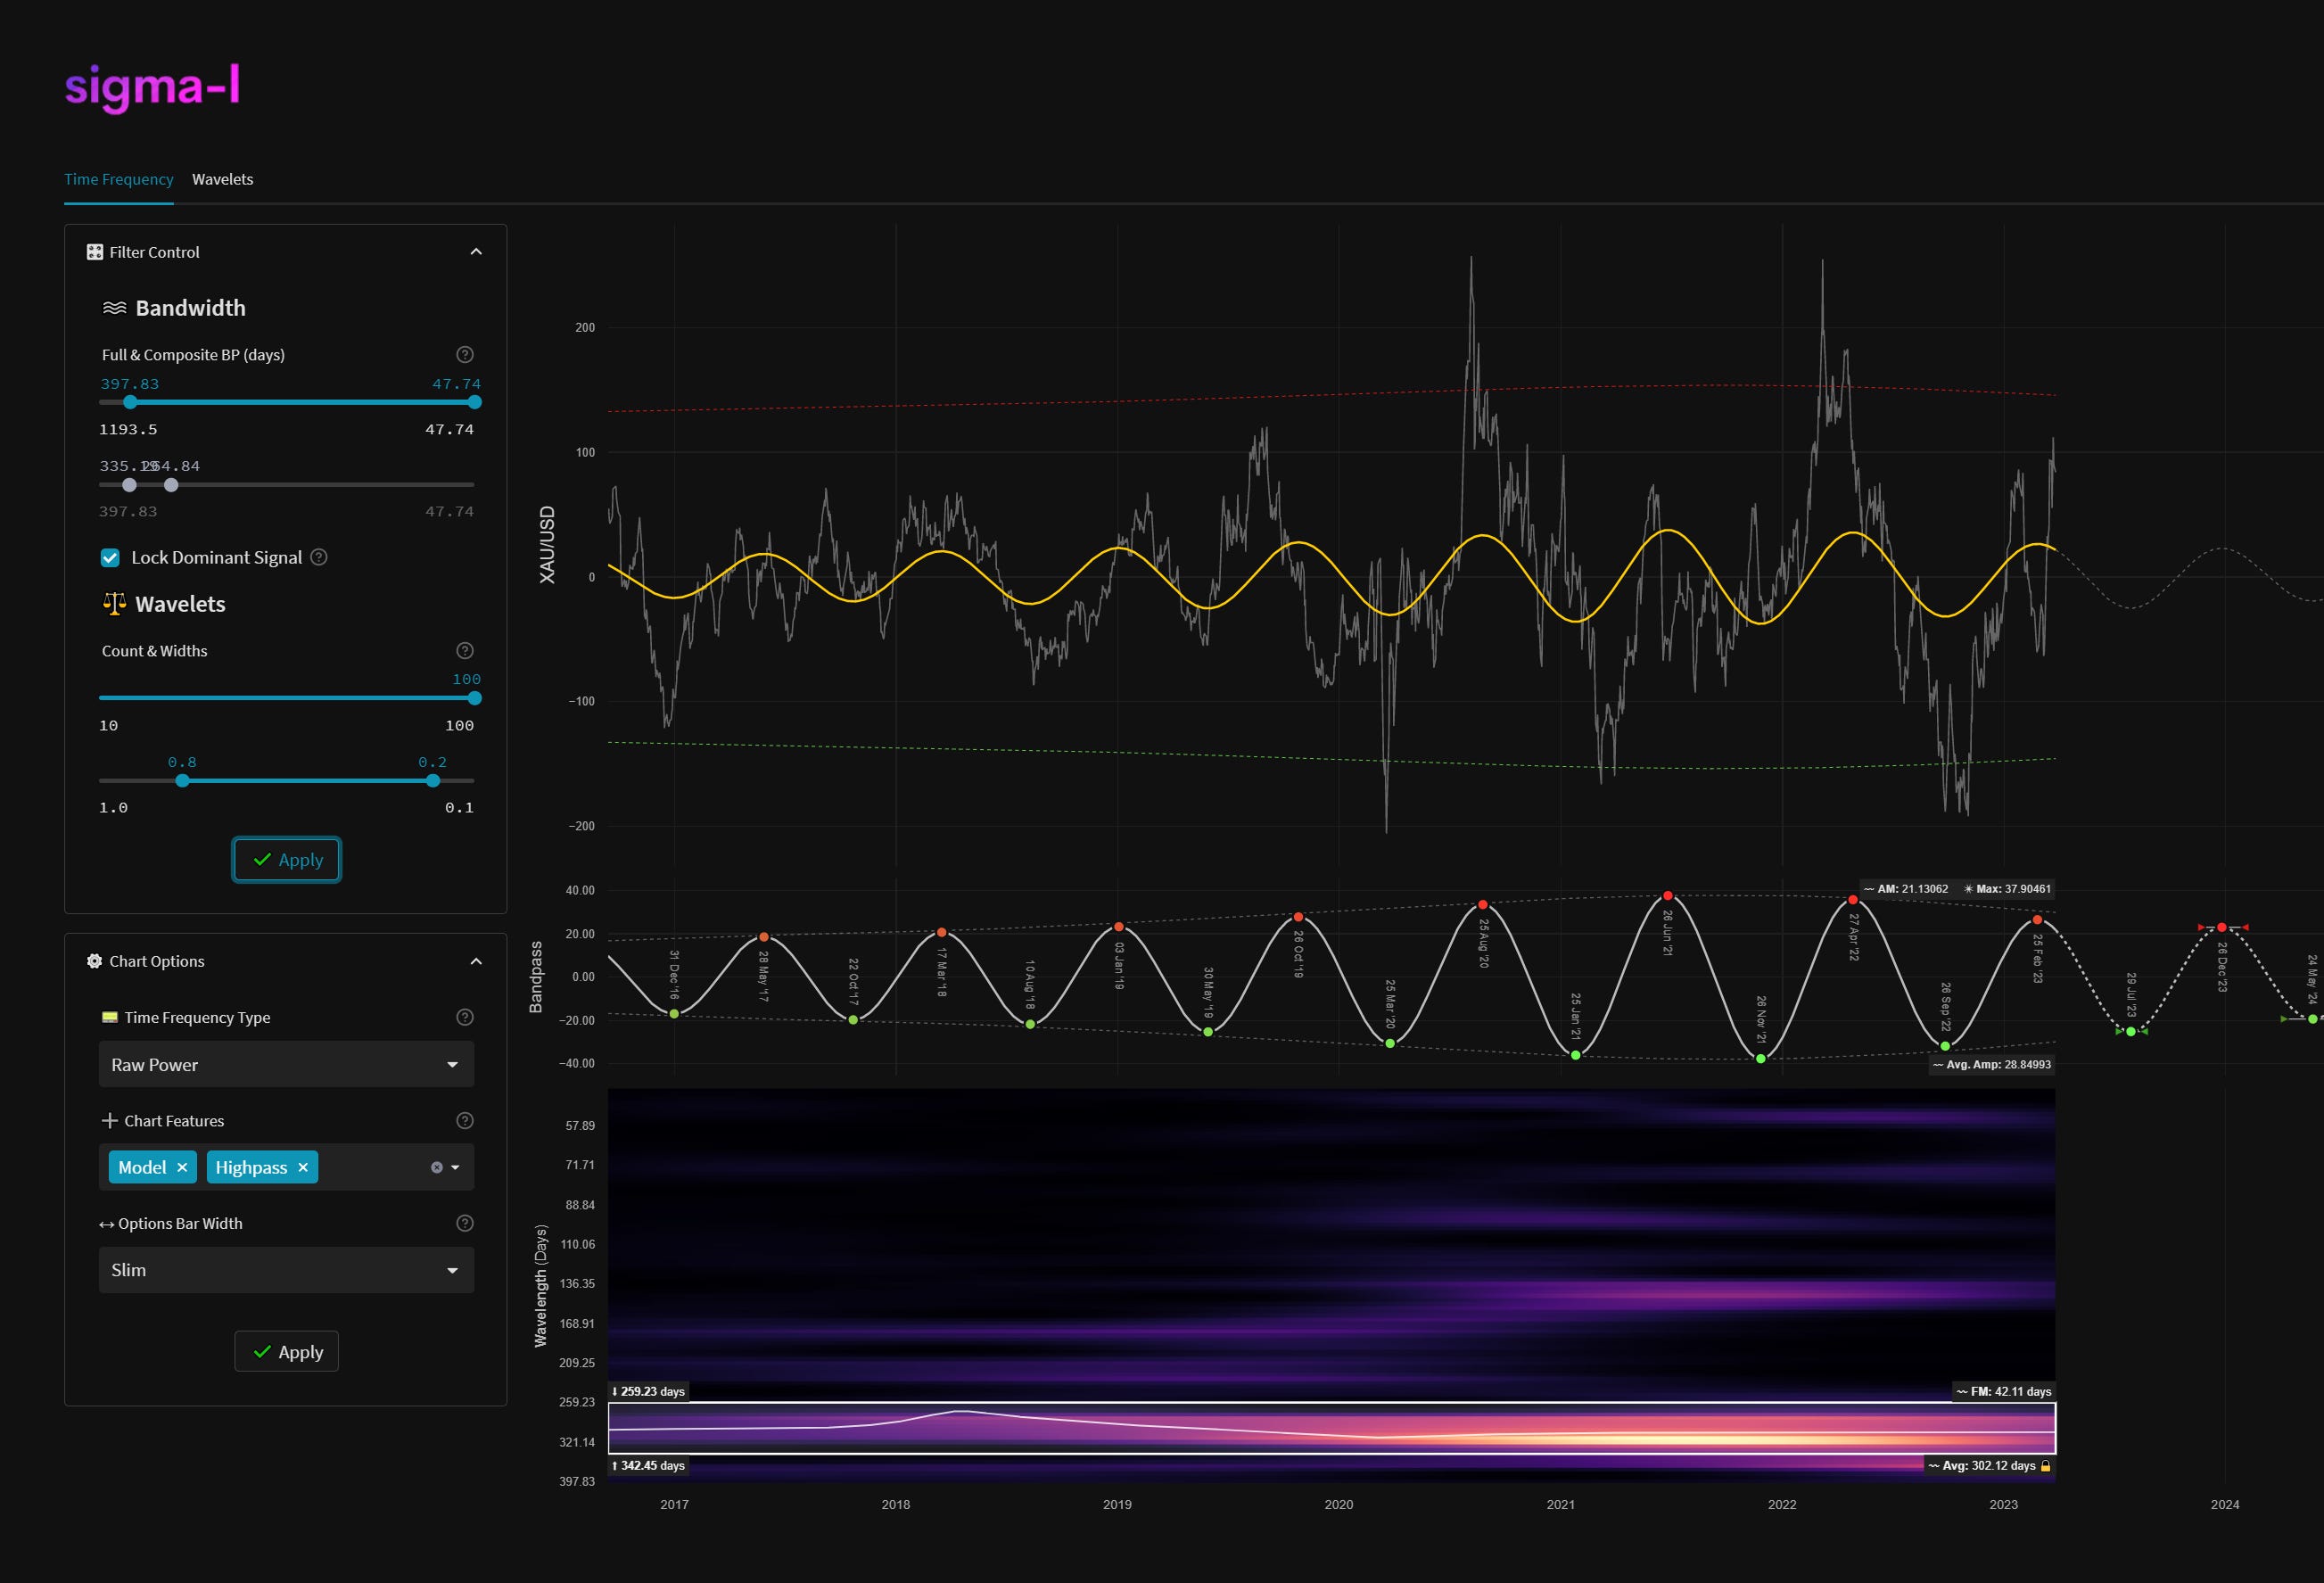
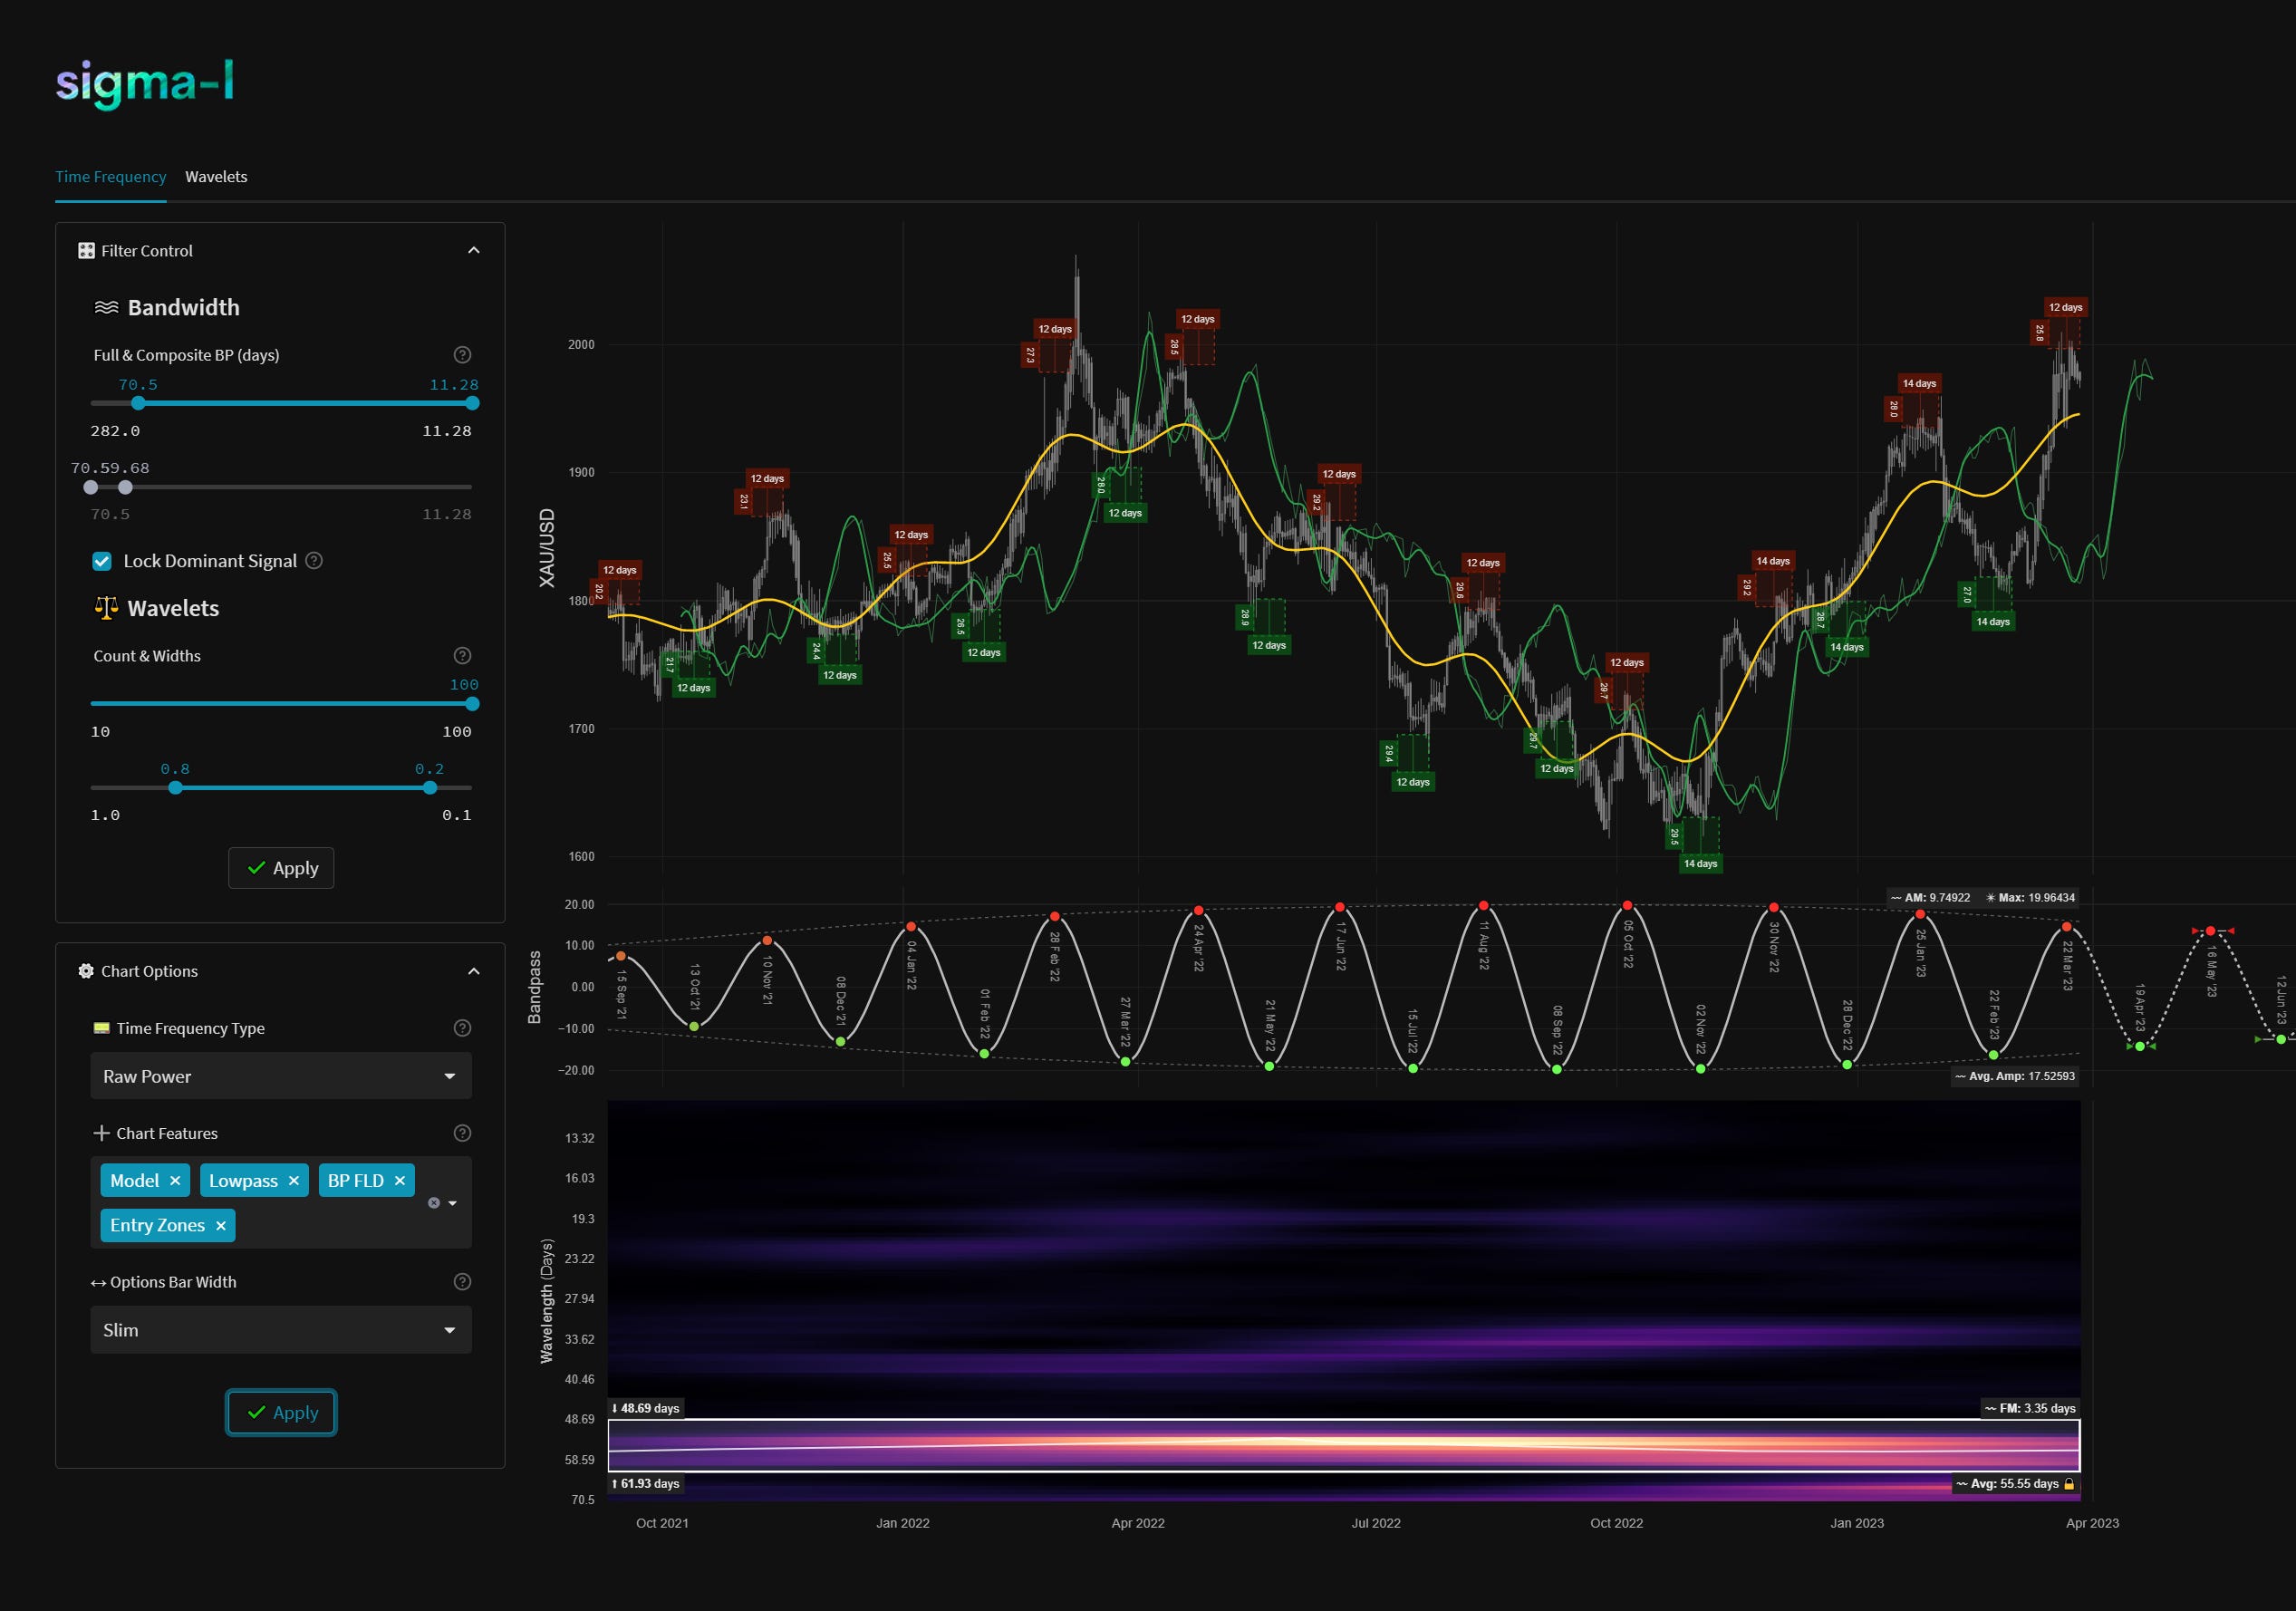
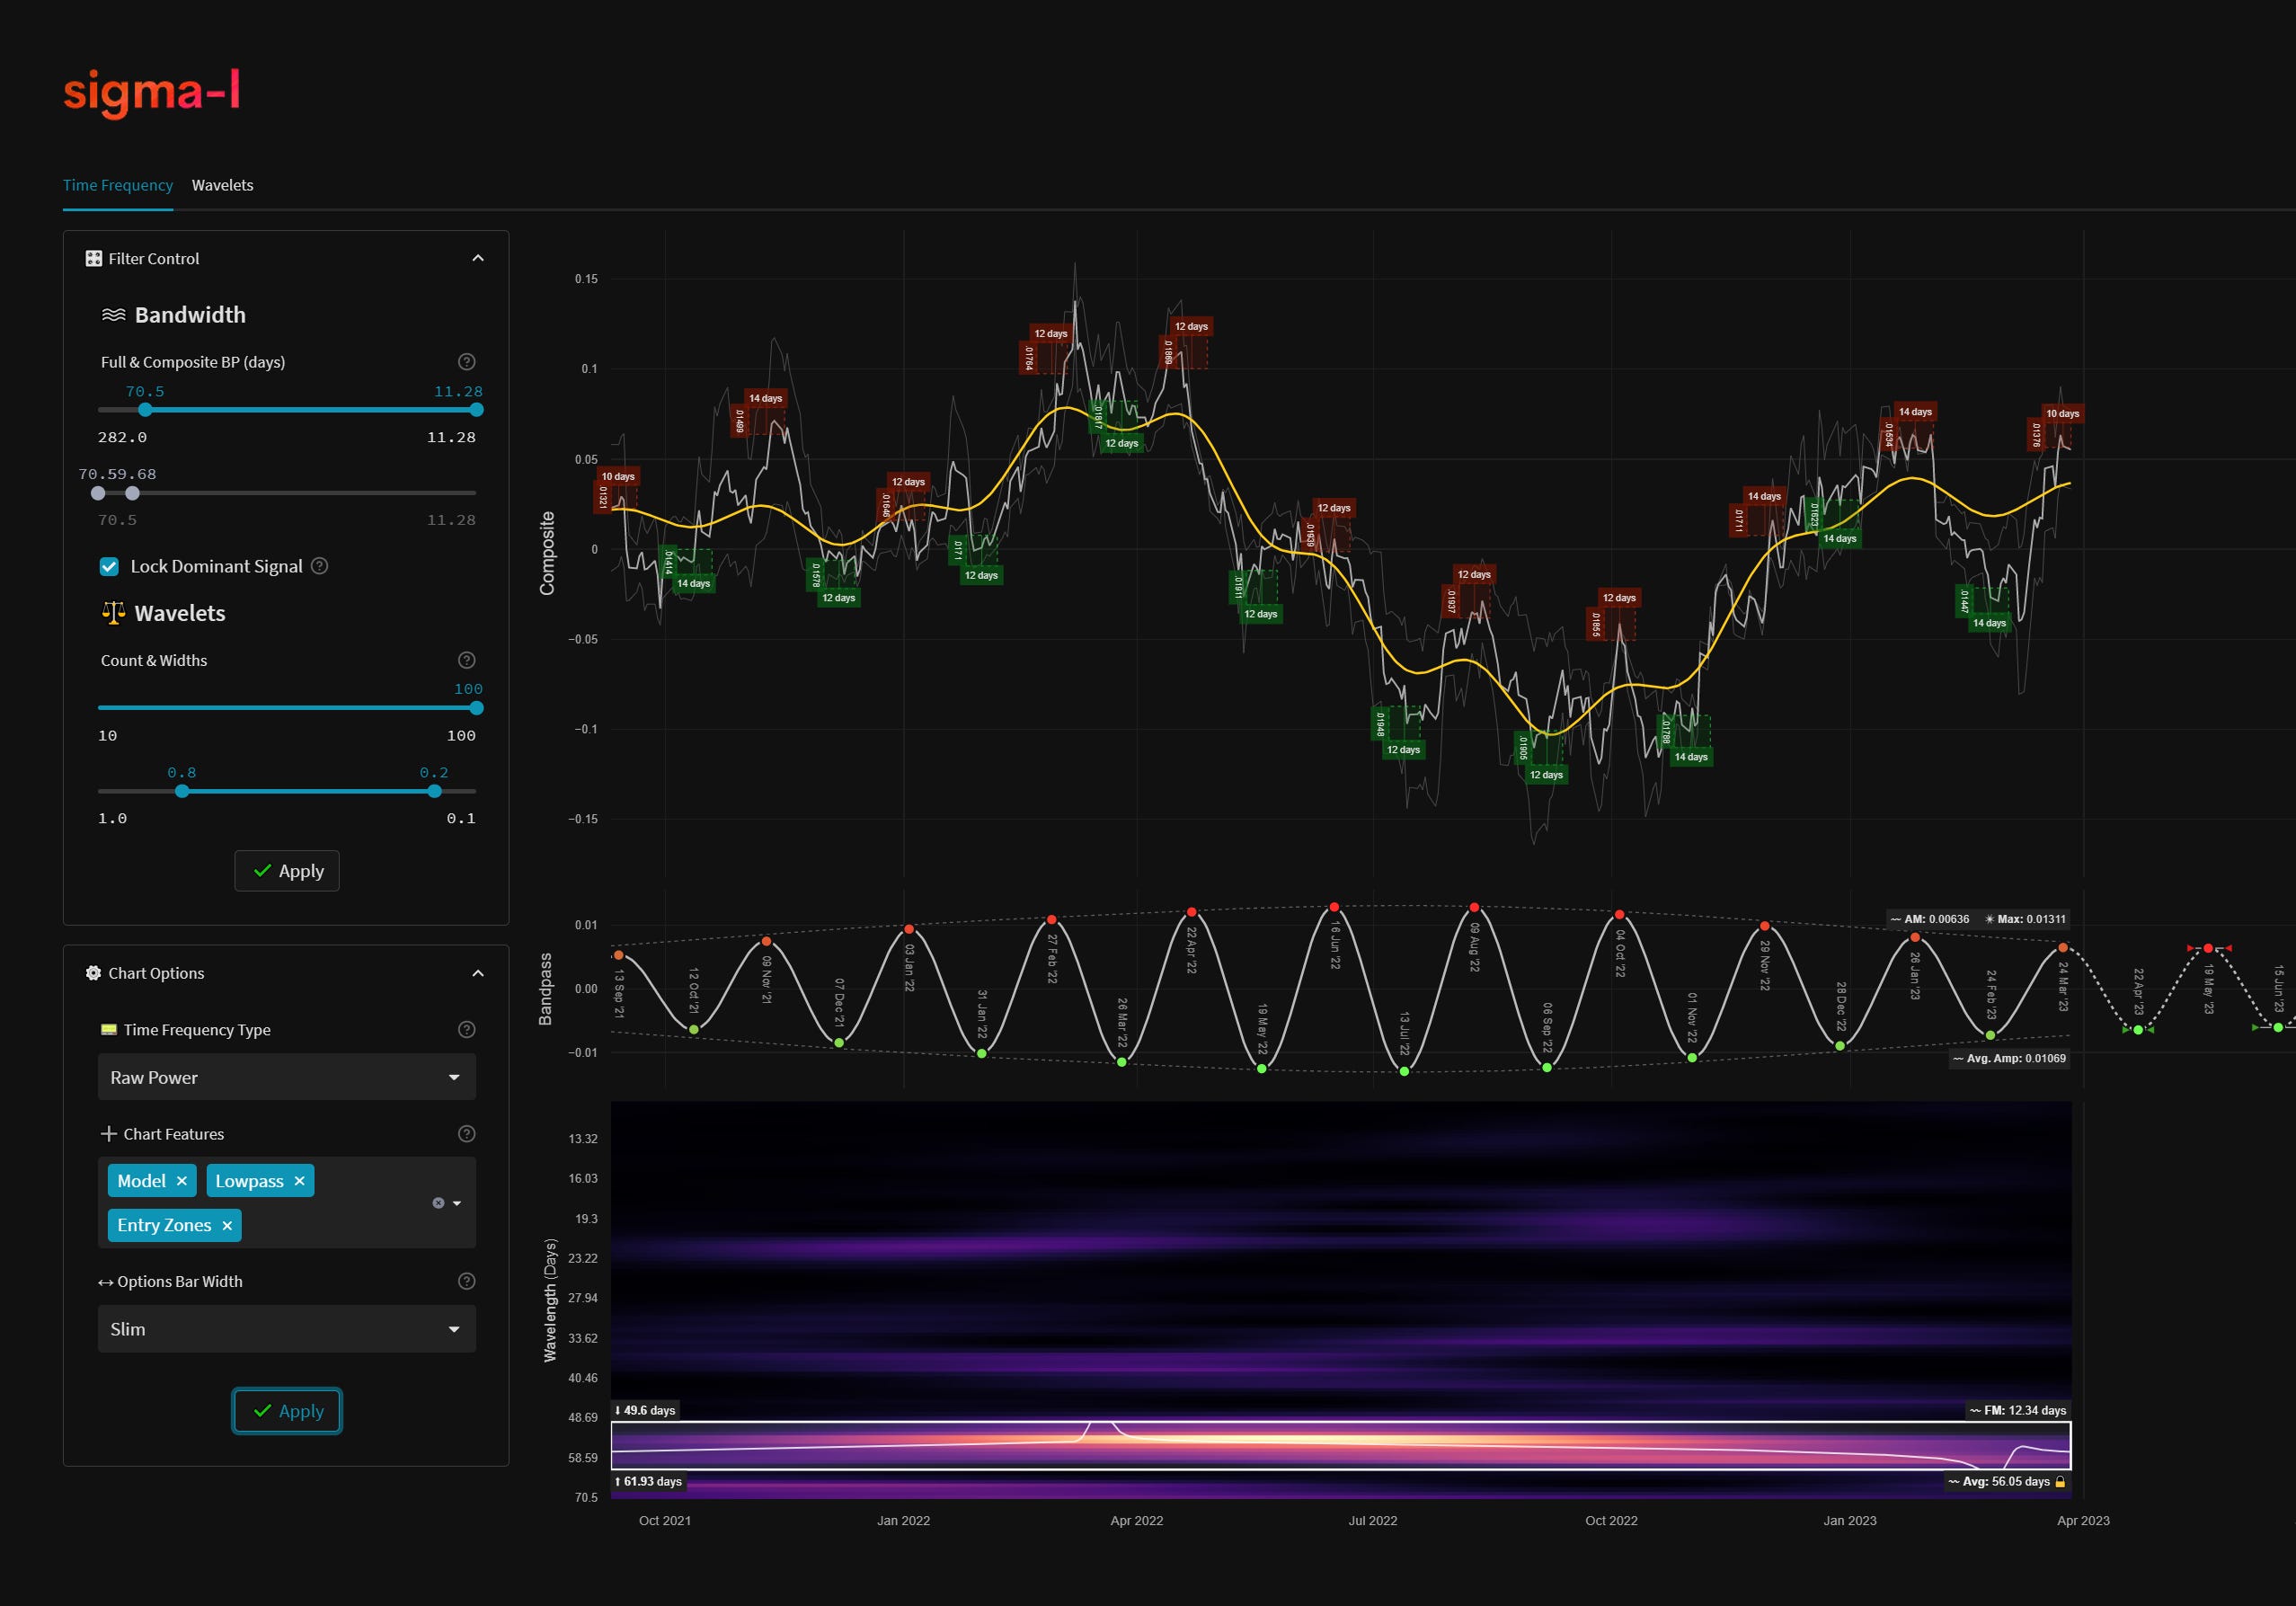
The latest move up in Gold exceeded our targets from the last report at 1900, 1950 and also exceeded 1960. The medium term phasing comes into focus here as the 40 week component is due to peak in this timezone with a subsequent trough due in July. The ‘beacon’ component at 55 day continues to be an excellent trading signal with high amplitude, as shown below in the time frequency analysis on both Gold and a Gold/Silver composite.
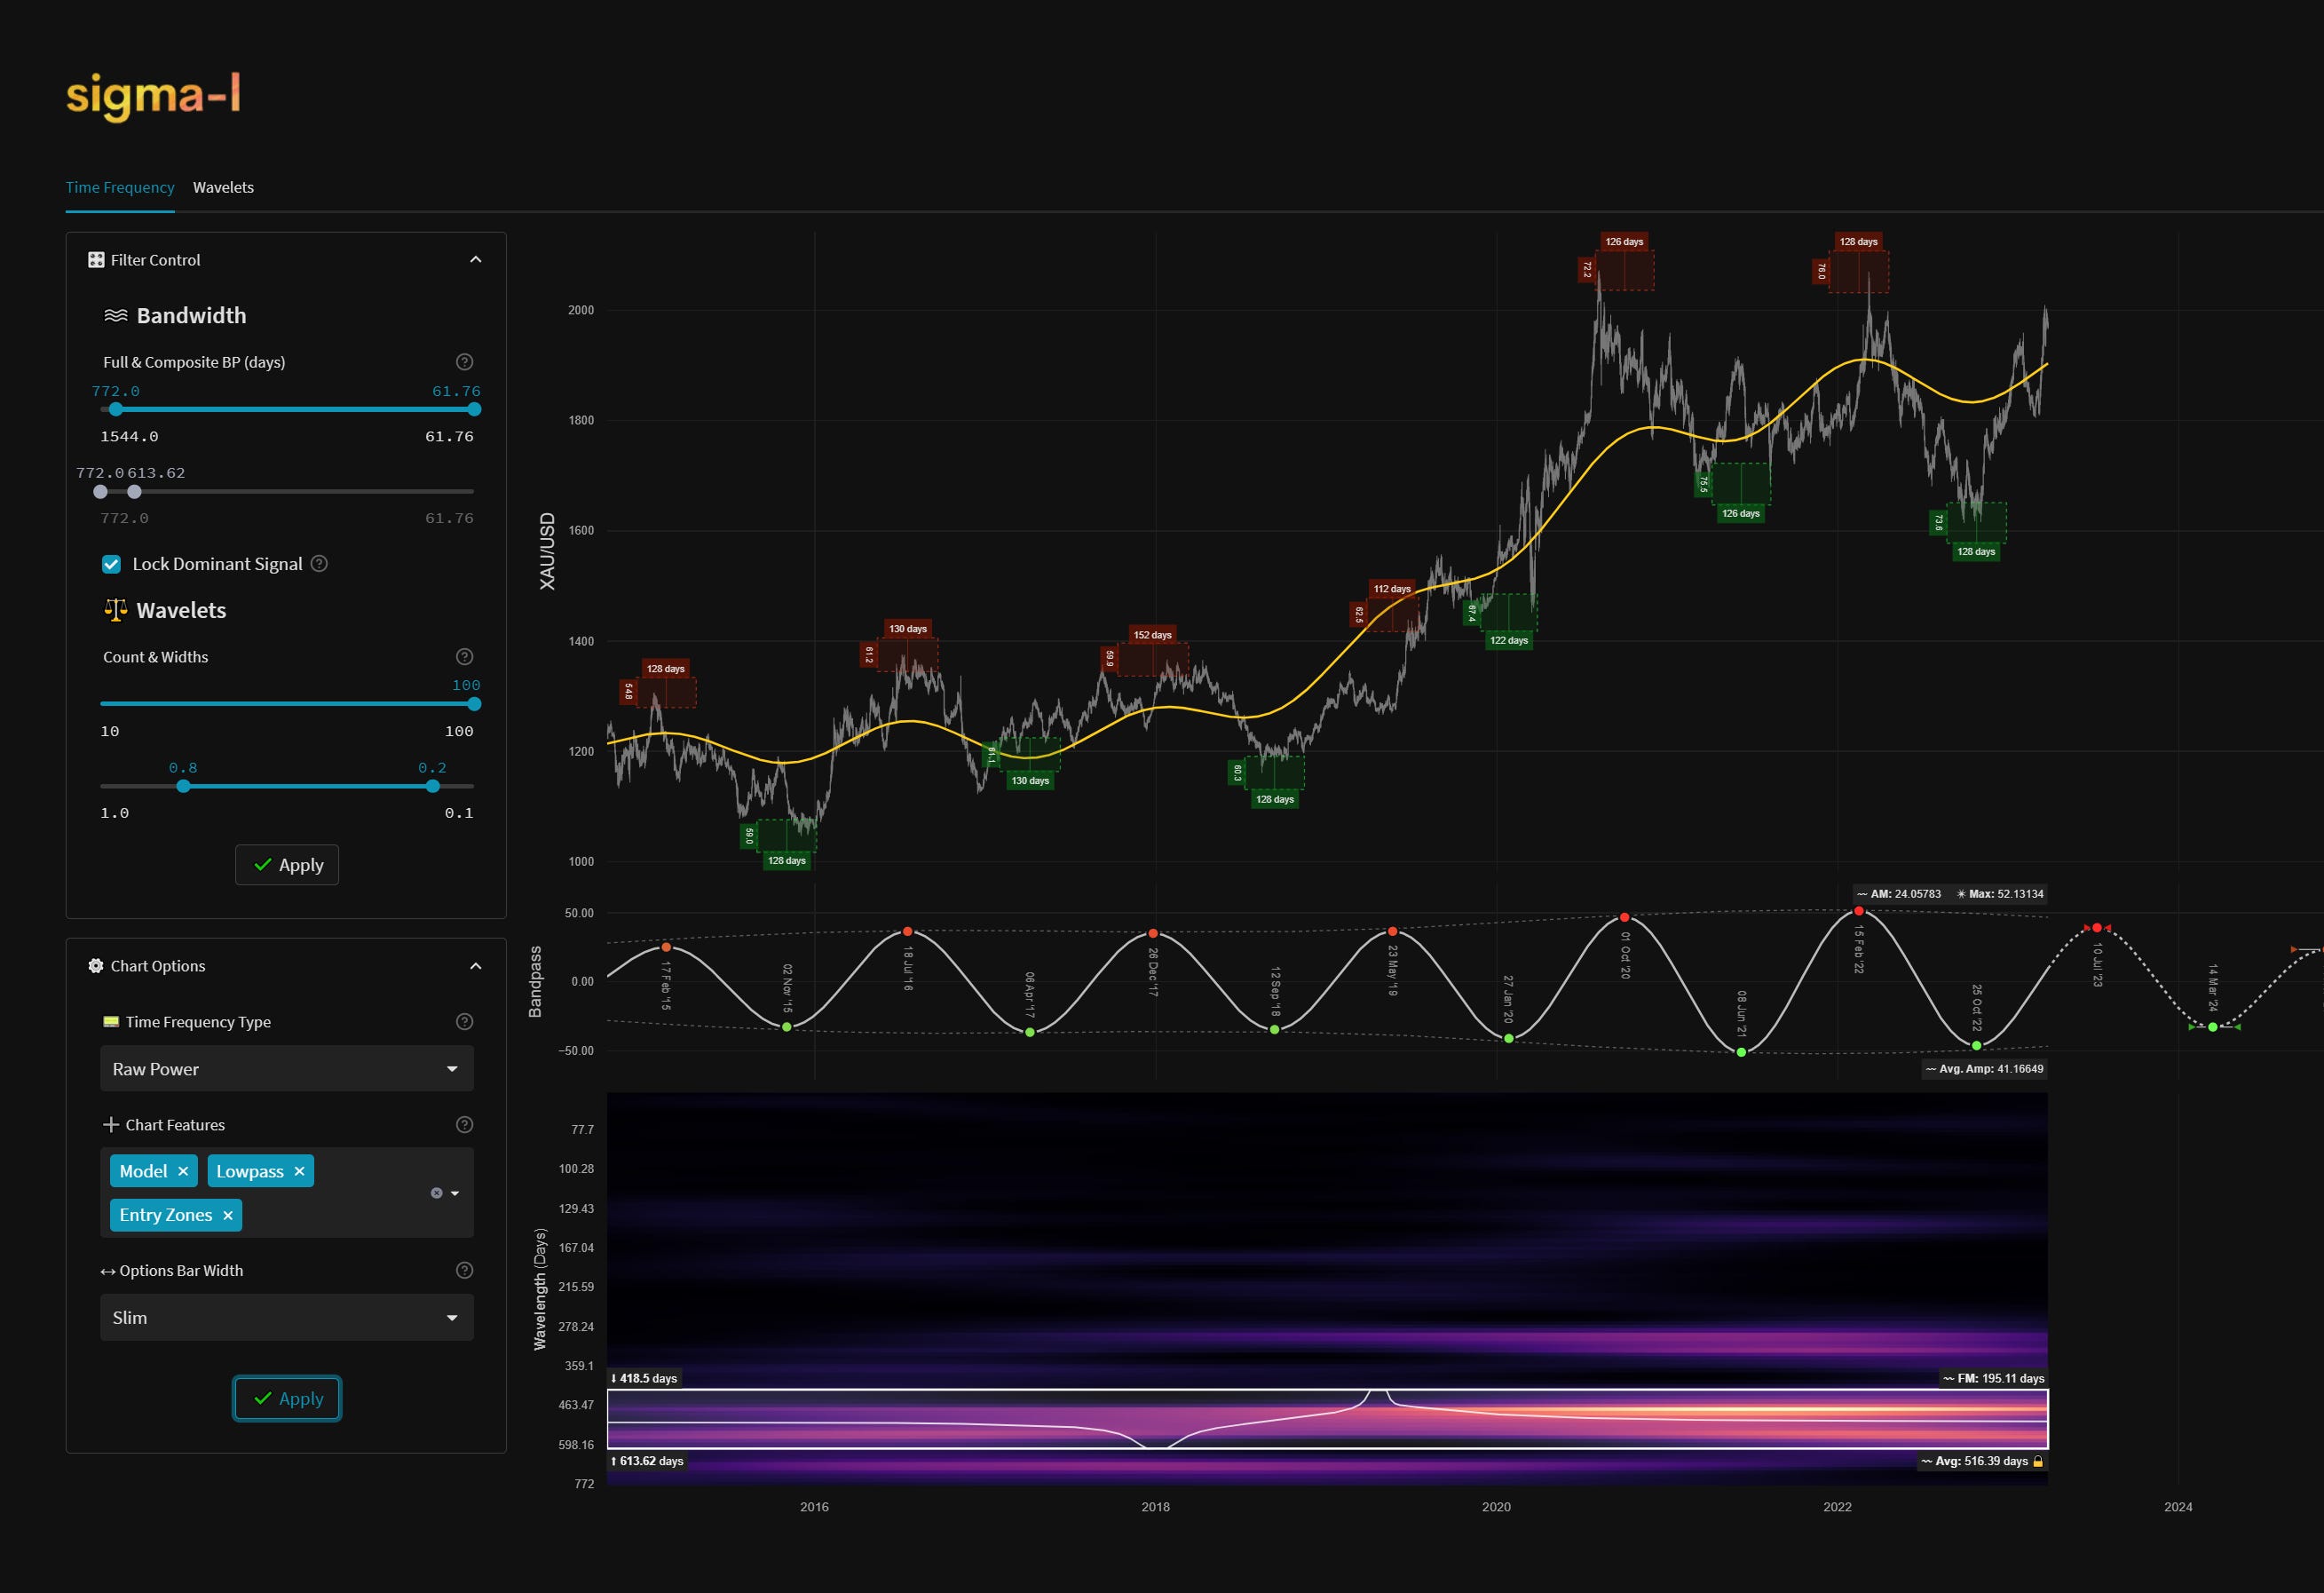
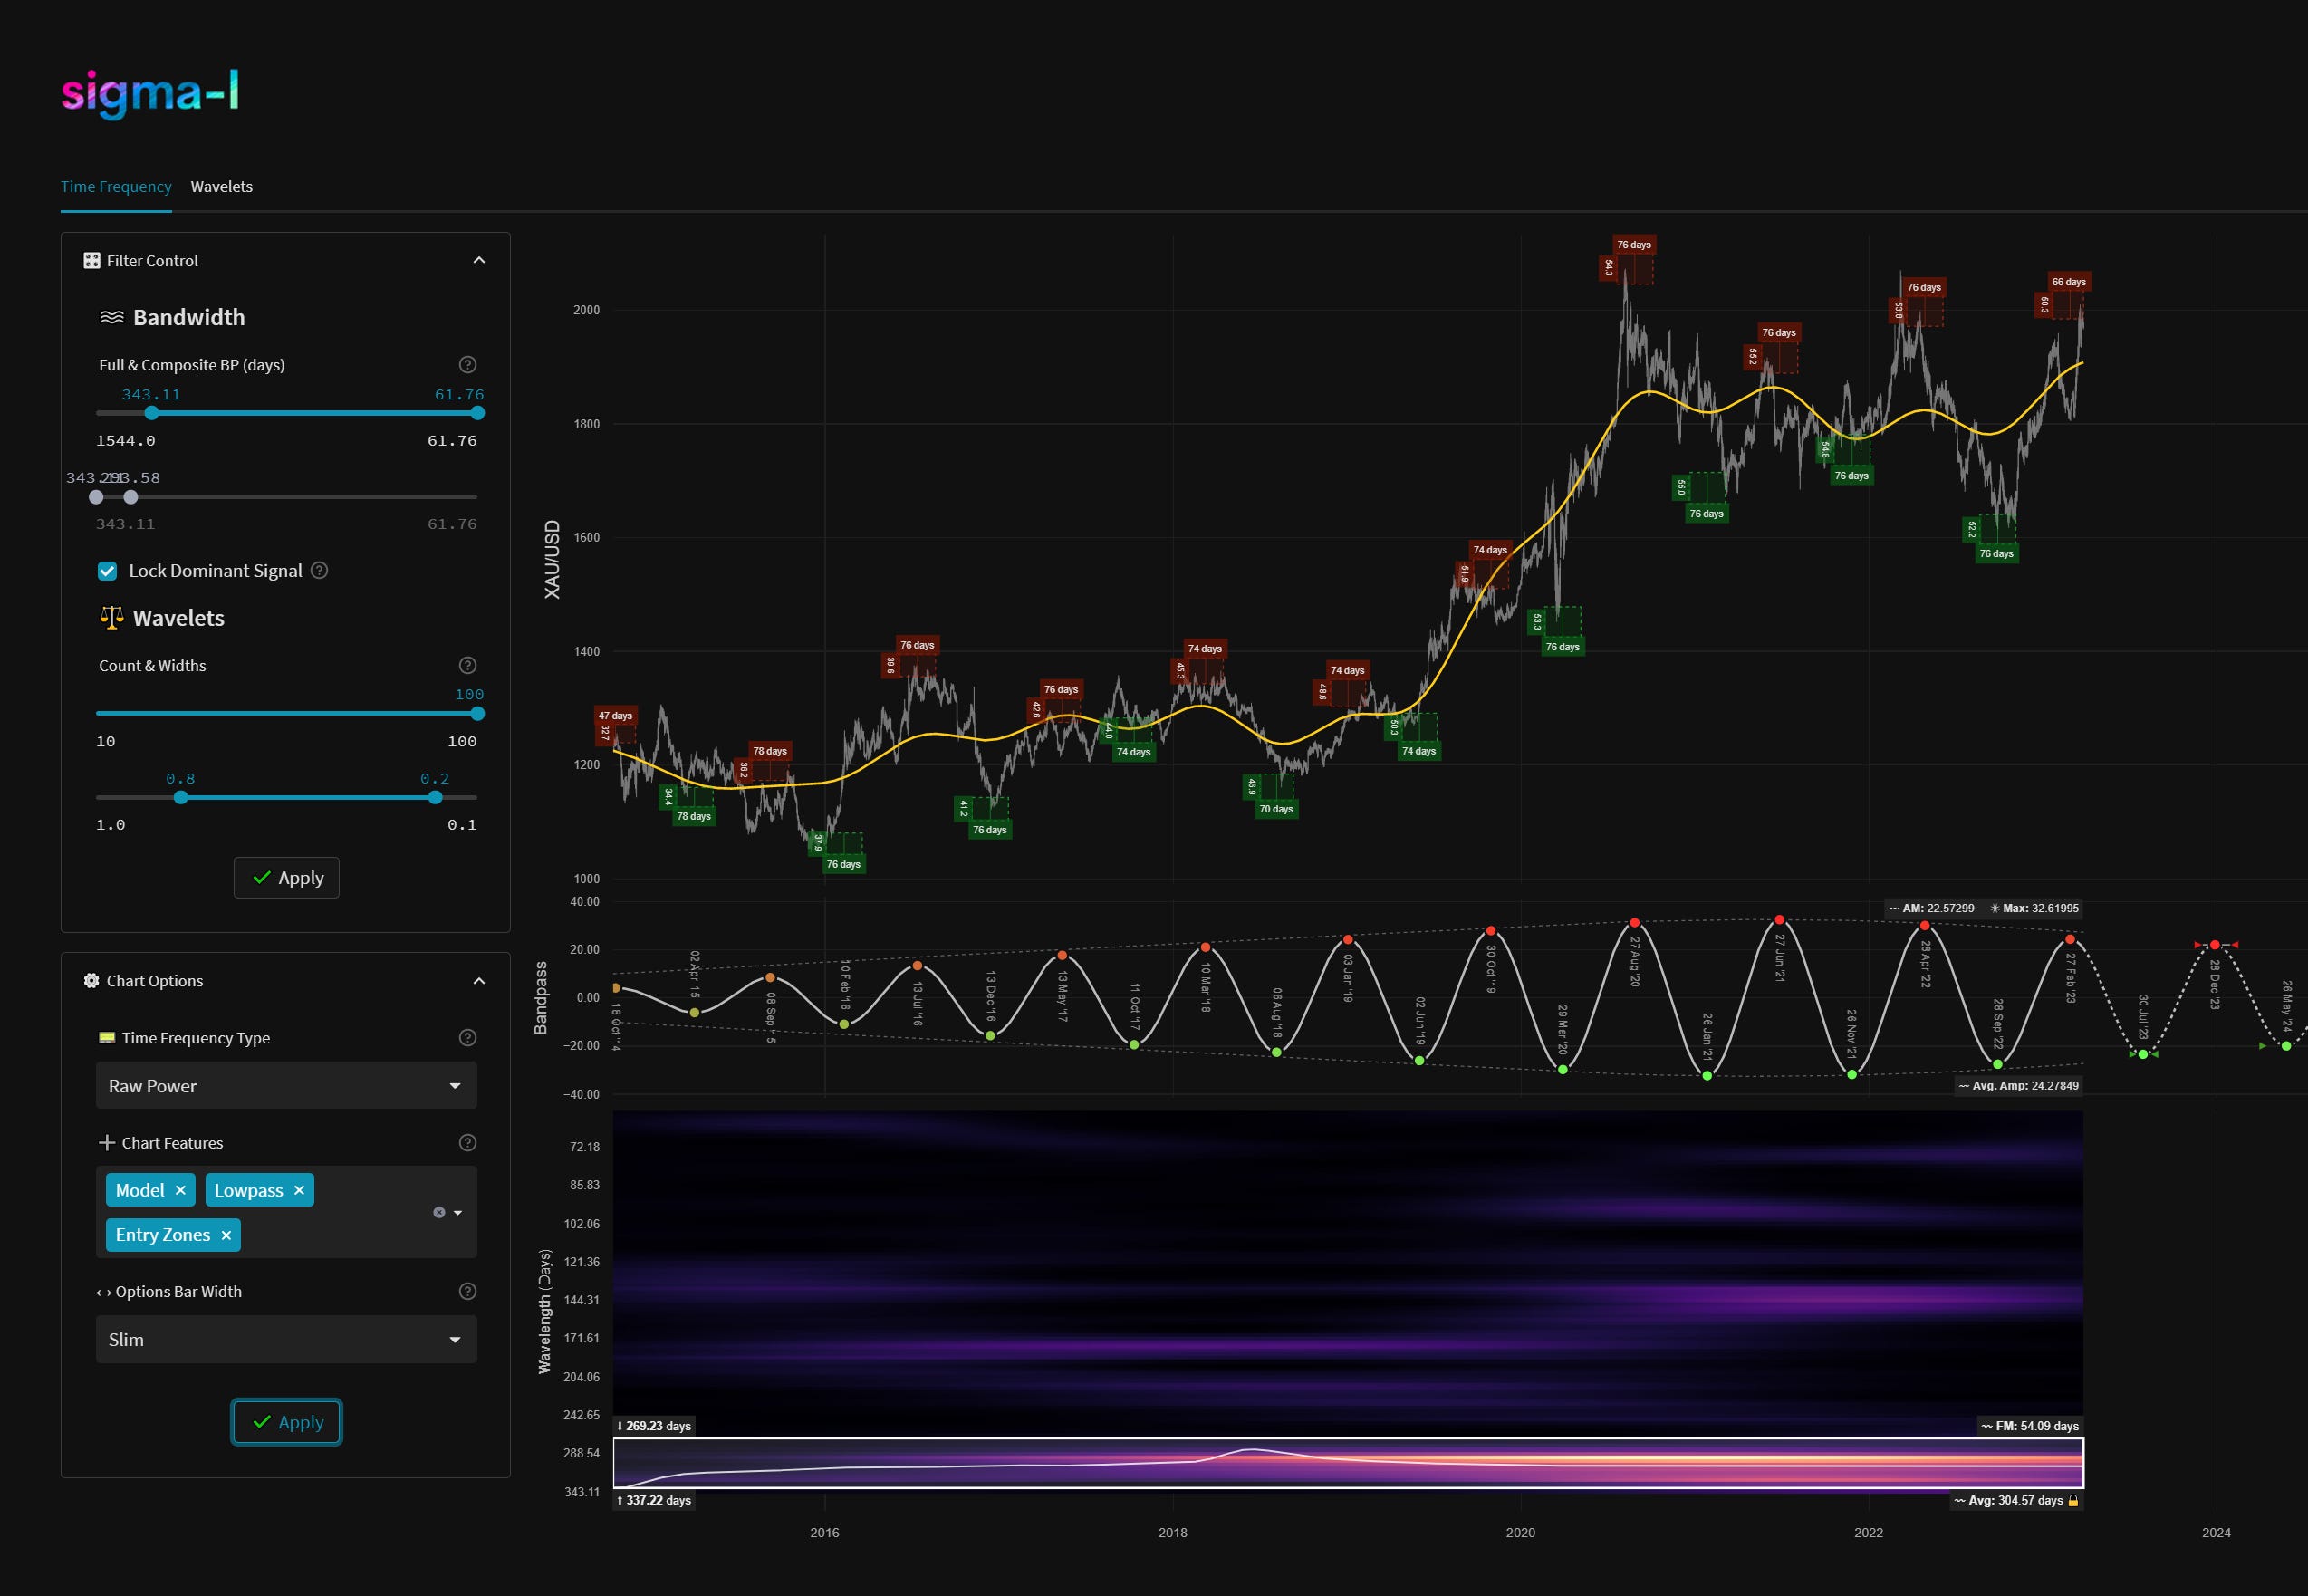
The 40 week component has been fairly coherent in Gold for a prolonged period, running at an average wavelength of around 315 days. Current phase is indicating a peak, this is set against the still bullish power of the longer component (notionally 18 month, ~516 days) and the bullish 20 week component (~140 days).
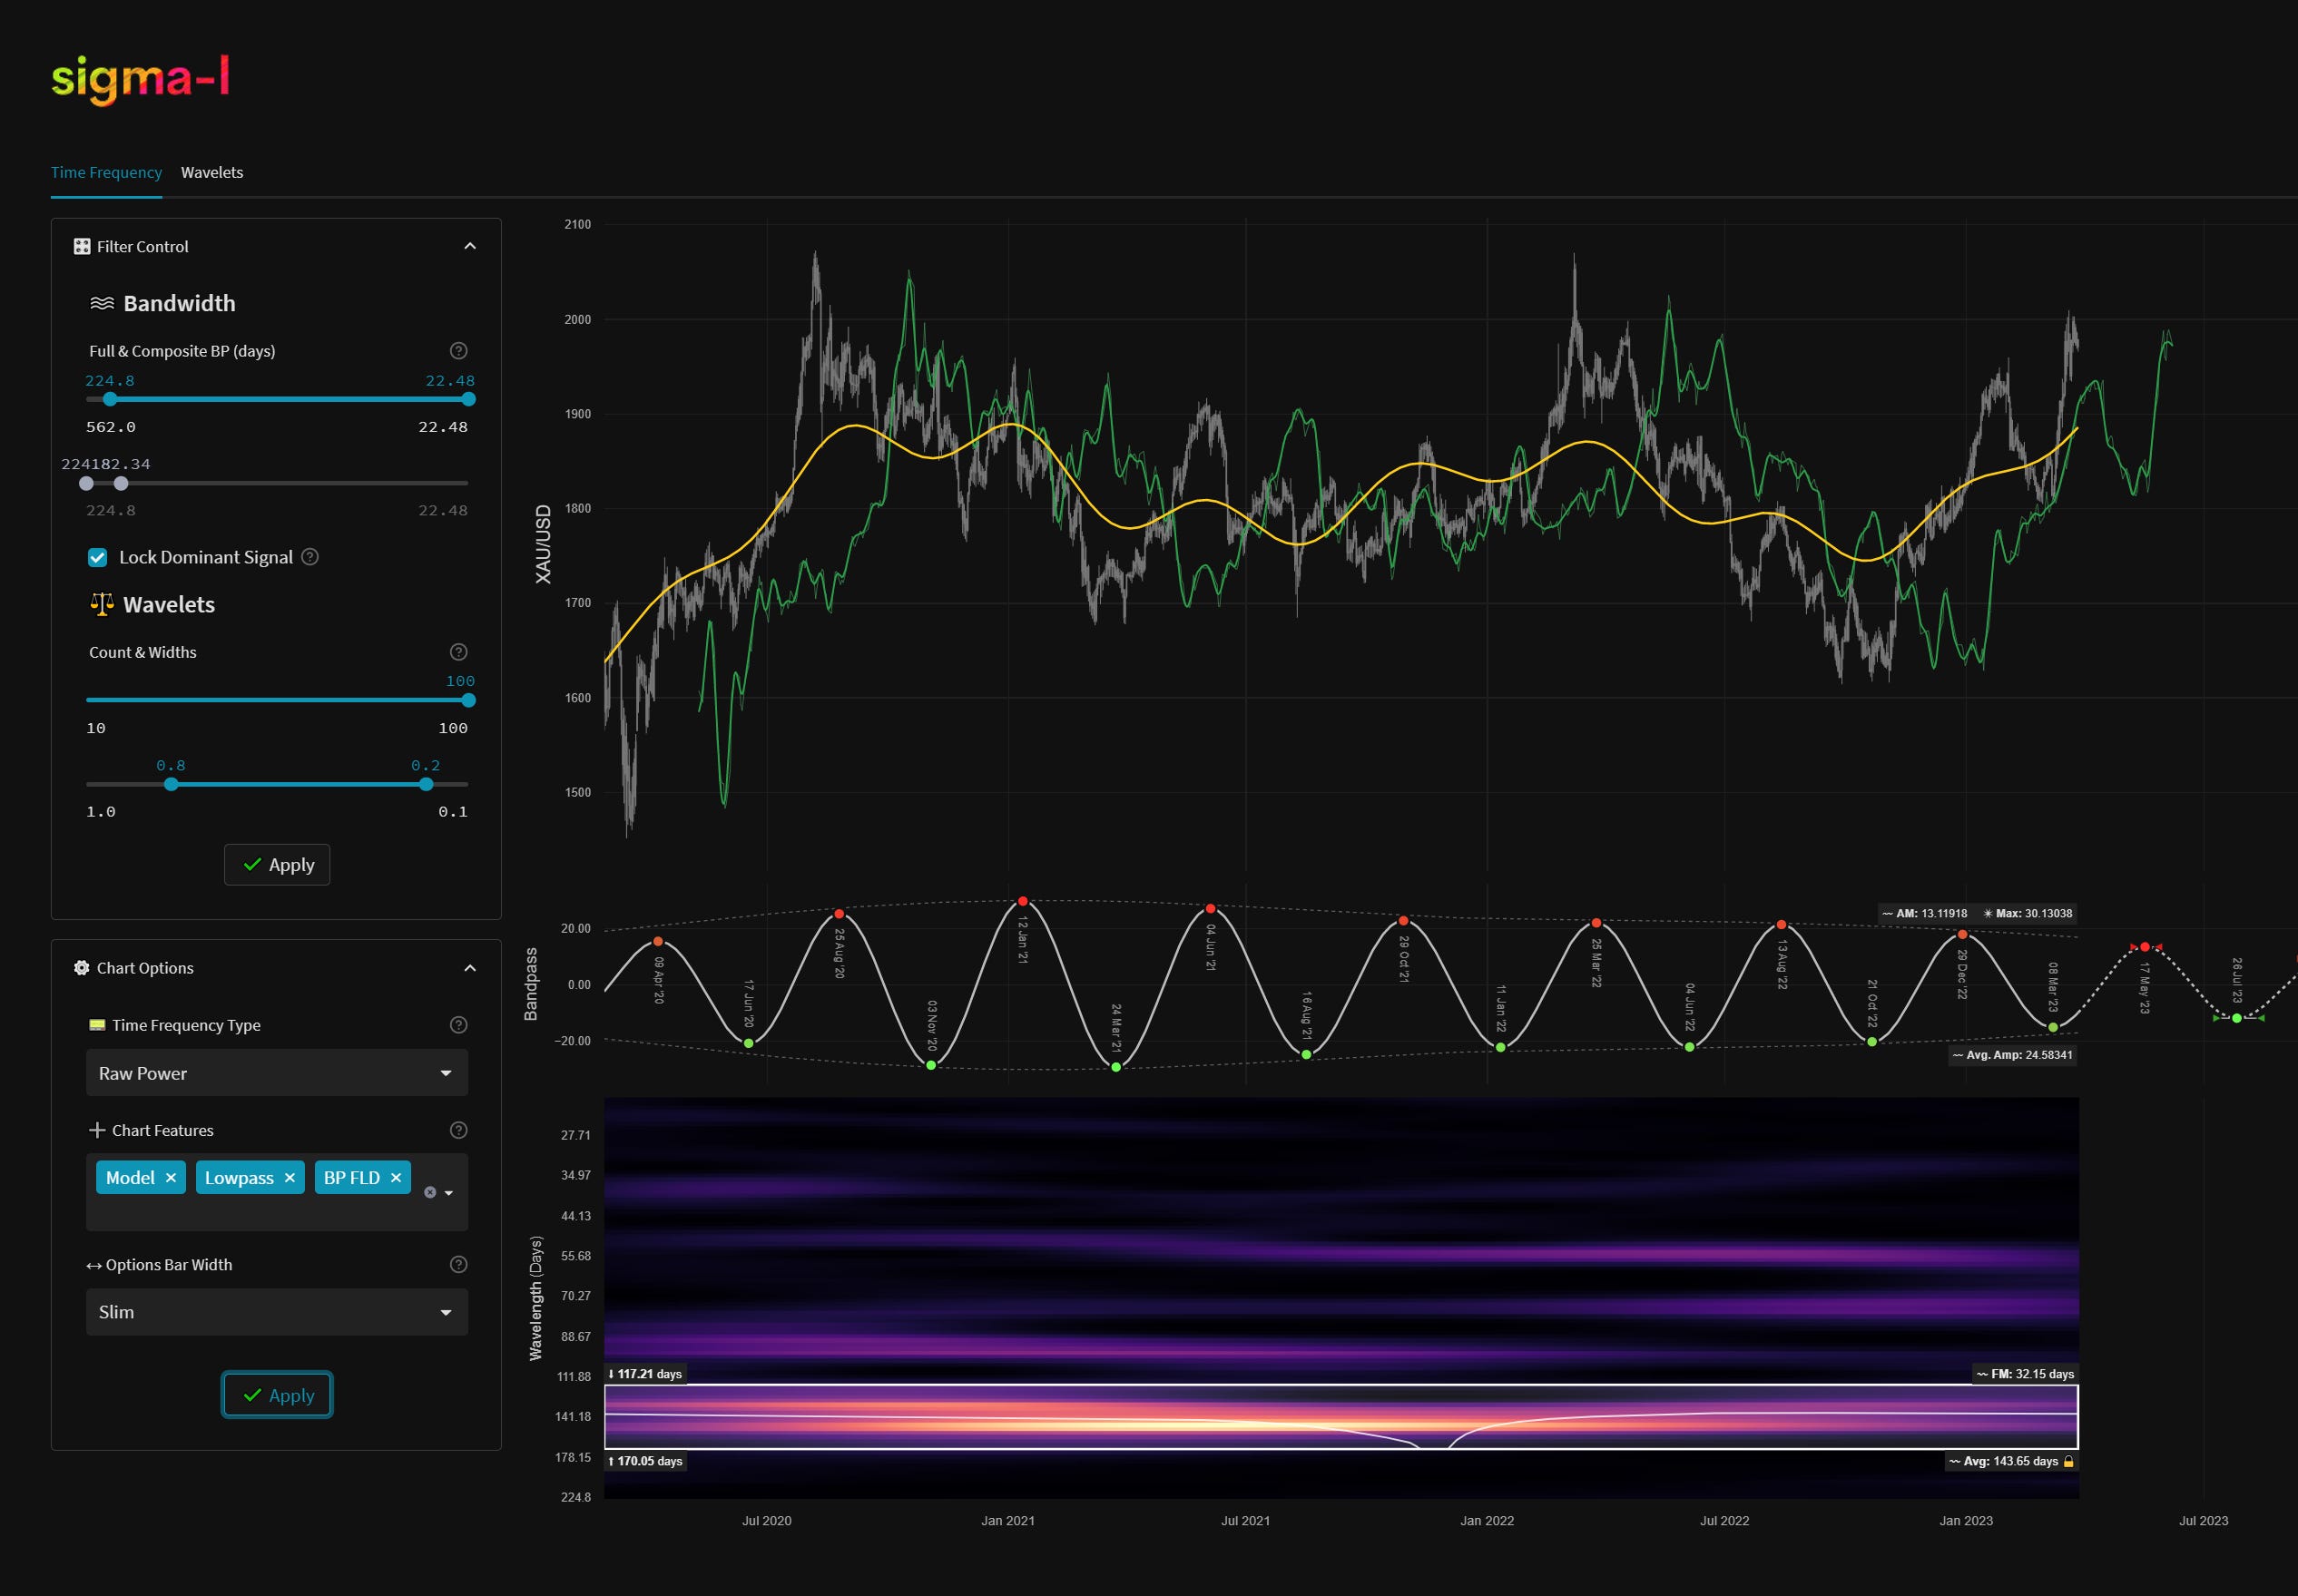
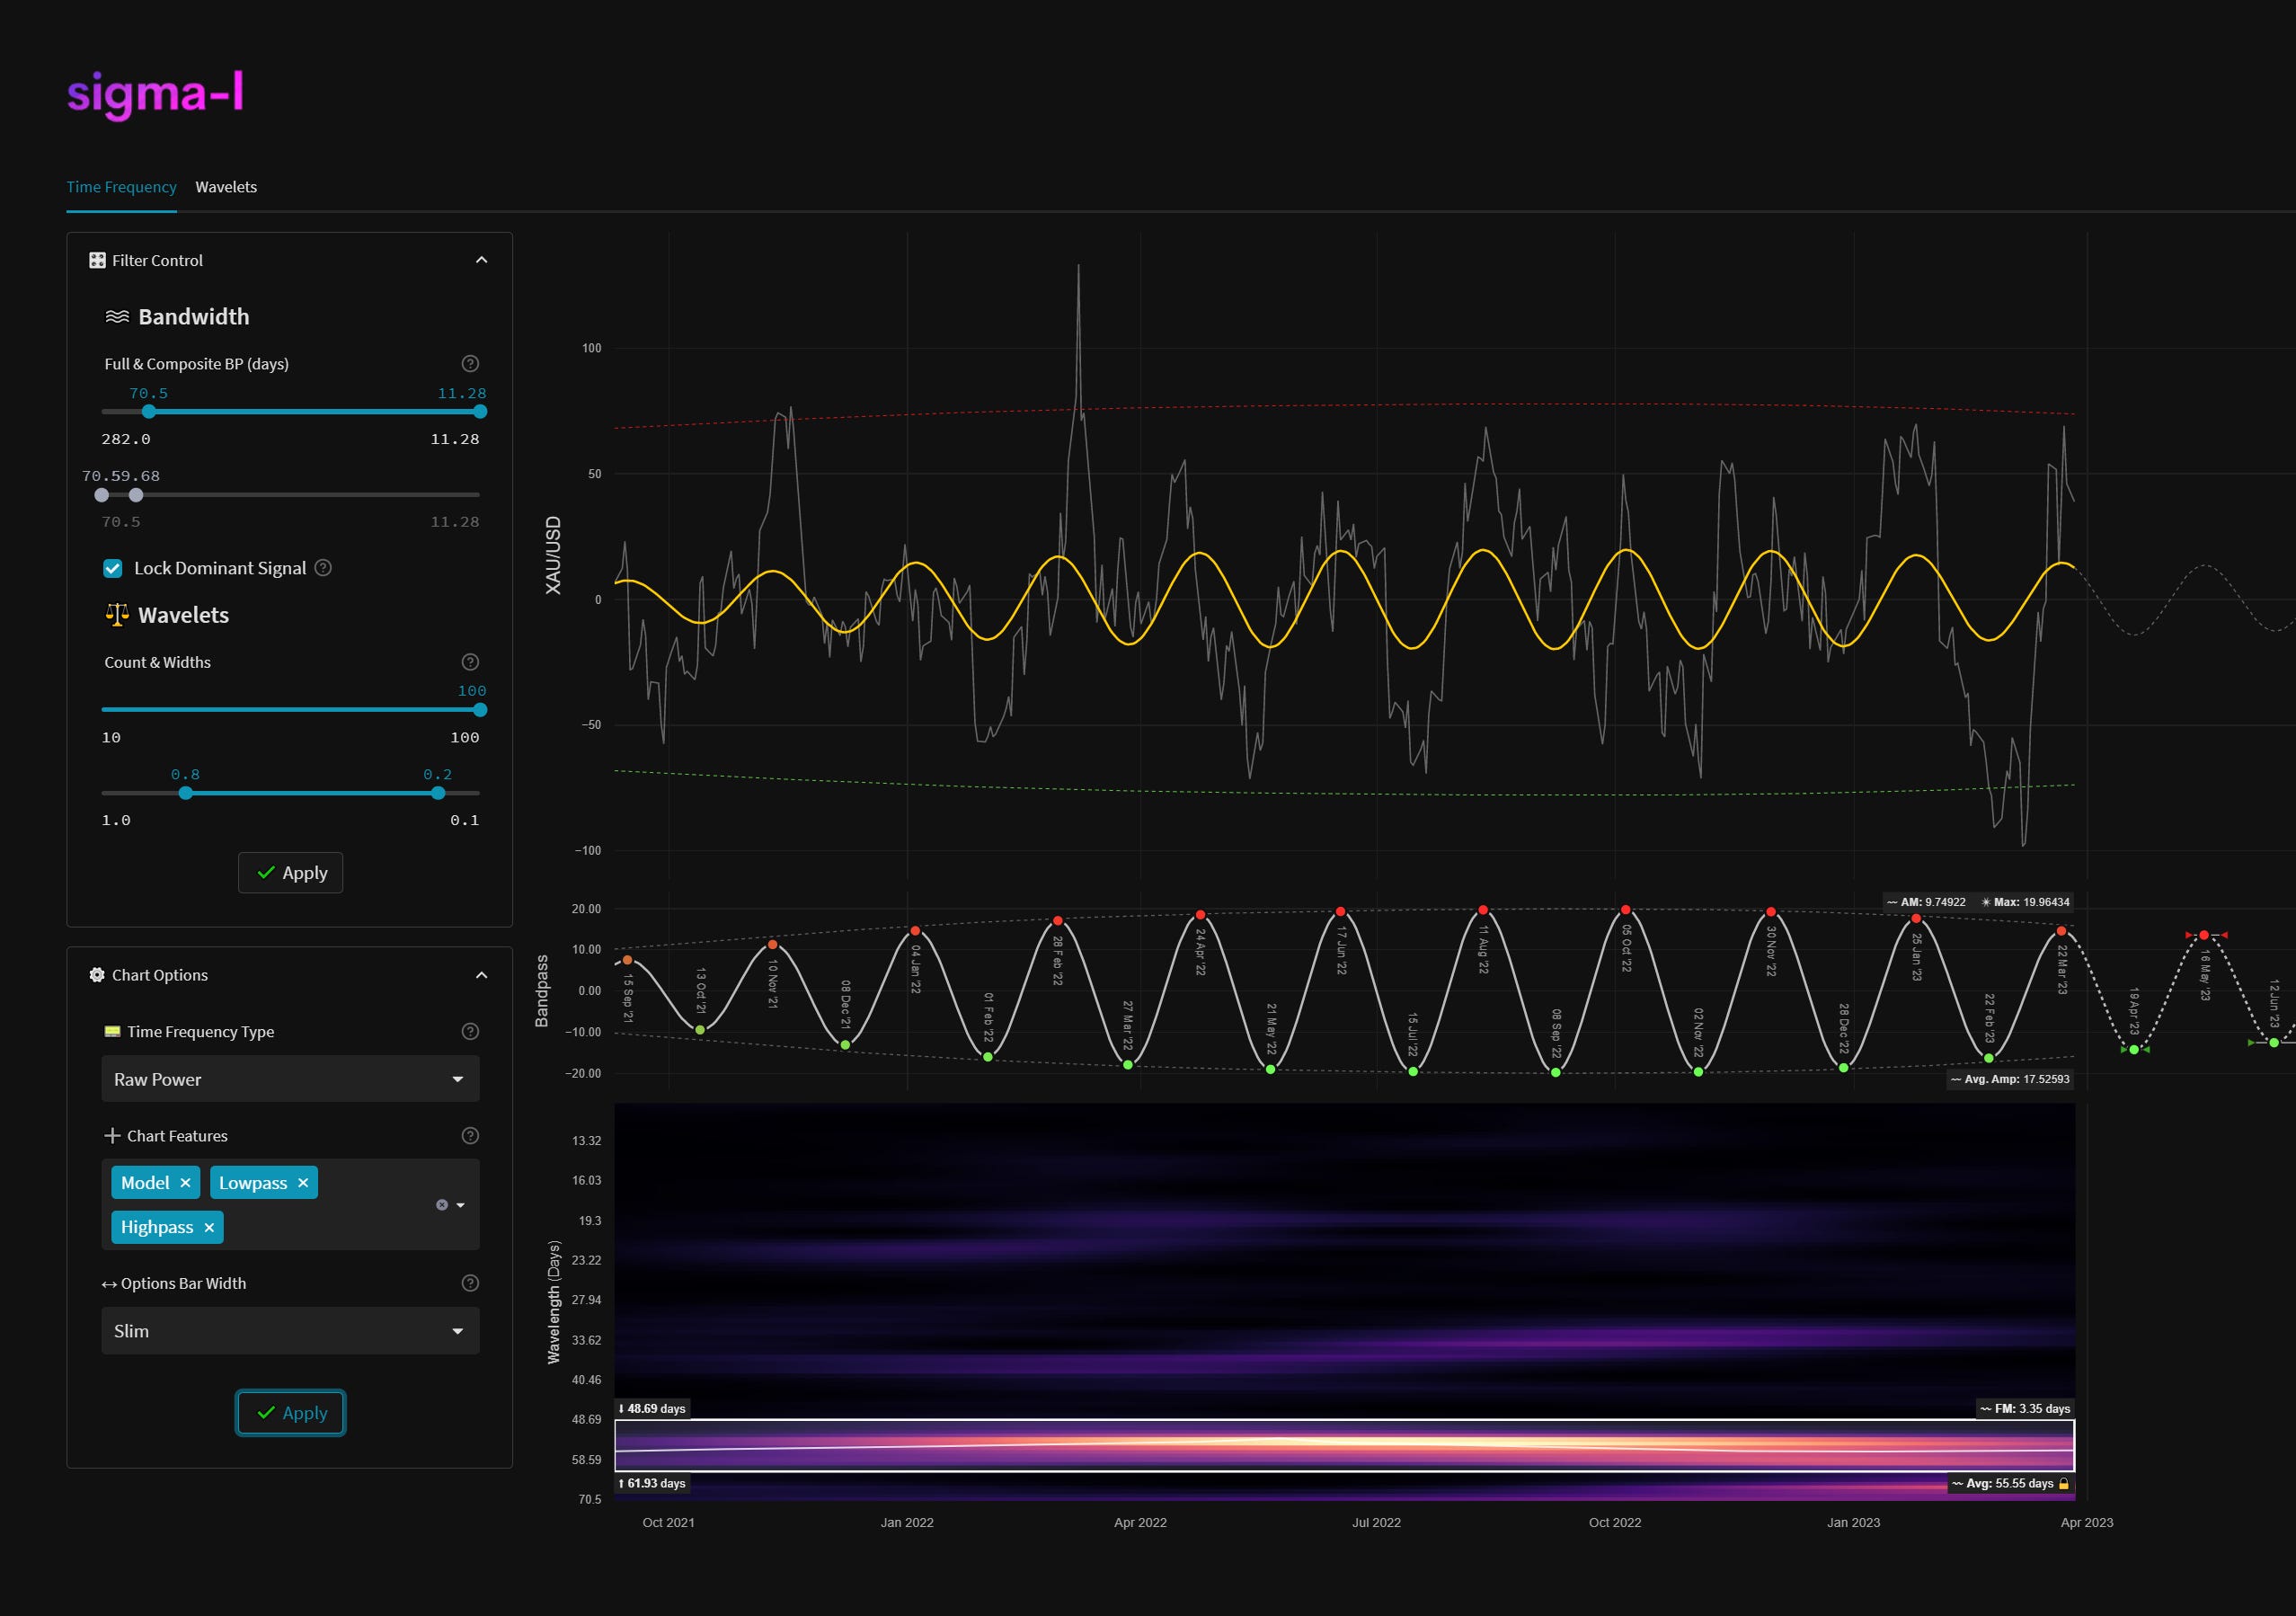
The 20 week component bounced very crisply off the 20 week FLD (shown below) at the last trough, now established to have occurred at the end of February. This component is due to peak mid May so a likely possible scenario is a shallow retrace here (from the 55 day component influence) and further push up to what would be a late (bullish) 40 week component peak in May.
The outlier scenario would see a full retrace back down of the recent move up from the 55 day component, due to trough around 19th April. This would then most likely imply the 40 week component has occurred and we could expect a lower high for the 20 week component peak in May.
As has been the case for months now, the component at 55 days is providing an excellent guide within the longer components. We will continue to track and report on this outstanding signal with our unique approach.
Phasing Analysis
Long Term
Components including and longer than the 18 month nominal wave
Medium Term
Components between the 20 week to 18 month nominal wave
Short Term
Components shorter than the 20 week nominal wave
Trading Strategy
Sigma-L recommendation: Risk Sell
Entry: 10 Day FLD / 20 Day FLD
Stop: Above forming 55 day component peak
Target: 1850 - 1900
Time Target: 17th - 23rd April
The metronomic component at 55 days is suggesting a peak here that will establish a low in mid-late April. The 40 week component peak could also have occurred, this move will be quite telling in that respect. A shallow move down will suggest further upside to a later 40 week peak in May. A sharper move down here will confirm the current phasing.
Correlated Exposure
A non exhaustive list of correlated instruments for consideration
SPDR Gold Shares iShares Gold Trust IAU 0.00%↑
SPDR Gold MiniShares Trust GLDM 0.00%↑
Aberdeen Physical Gold Shares ETF SGOL 0.00%↑
Granite Shares Gold Shares BAR 0.00%↑
VanEck Merk Gold Trust OUNZ 0.00%↑
Goldman Sachs Physical Gold ETF AAAU 0.00%↑
ProShares Ultra Gold UGL 0.00%↑
Invesco DB Precious Metals Fund DBP 0.00%↑
Invesco DB Gold Fund DGL 0.00%↑
wShares Enhanced Gold ETF WGLD 0.00%↑
Barrick Gold Corporation GOLD 0.00%↑
Newmont Goldcorp NEM 0.00%↑
Wheaton Precious Metals WPM 0.00%↑
VanEck Junior Gold Miners ETF GDXJ 0.00%↑
VanEck Gold Miners ETF GDX 0.00%↑
Franklin Responsibly Sourced Gold ETF FGLD 0.00%↑
Amplify Pure Junior Gold Miners ETF JGLD 0.00%↑