The Nominal Model
The nominal model is our goto reference point for a phasing analysis and is the bedrock of a standard Hurst cycles approach. Learn more in this article!
Modelling Markets
Throughout Sigma-L readers will find references to ‘nominal’ cycles. What does this mean? Hurst coalesced his spectral work in ‘Profit Magic for Stock Transaction Timing’ into a concise and easily referenced ‘model’ for average wavelengths of components in financial markets, most notably stockmarkets, but research and experience shows valid utility in other markets.
This model consists of several entries; from the 18 year component down to the 5 day component. Although the model was somewhat more populated in Hurst’s original work the classic version we use frequently today was introduced in the Cycles Course and attempted to simplify the lineup for practical trading purposes. Let’s take a look at it below.
JM Hurst Nominal Model
Name: 18 year nominal cycle | Average wavelength: 17.93 years
Name: 9 year nominal cycle | Average wavelength: 8.96 years
Name: 54 month cycle | Average wavelength: 53.77 years
Name: 18 month cycle | Average wavelength: 17.93 months
Name: 40 week cycle | Average wavelength: 38.97 weeks
Name: 20 week cycle | Average wavelength: 19.48 weeks
Name: 80 day cycle | Average wavelength: 68.2 days
Name: 40 day cycle | Average wavelength: 34.1 days
Name: 20 day cycle | Average wavelength: 17 days
Name: 10 day cycle | Average wavelength: 8.5 days
Name: 5 day cycle | Average wavelength: 4.3 days
The important aspect to grasp from this model is the fact that wavelengths specified in the model are a guide because they are average wavelengths found to be present in the sample set Hurst originally researched upon in the 1960s and 1970s.
Of course today we can bring to bear the power of modern software to any market and it is striking to see this model work extremely well for most financial instruments, cryptocurrency being the most recent and compelling.
The principle of variation dictates that the wavelengths of components in this model will inherently oscillate around the average wavelengths. We see this as frequency modulation visually. For example, stockmarkets are in general running faster than nominal globally. This may well continue or may indeed revert to longer cycles to compensate in the coming years. Clearly there is also the chance that the average wavelengths are in need of adjustment - the more samples we have the closer we come to converging on the most cogent, consistent period for each component.
What is really wonderful is that over the last 80 years the components listed above have changed very little. This is compelling evidence that the model above is a true synopsis of financial market motion. The 18 month component in particular has stayed very close to the nominal average in stockmarkets, only really decreasing in wavelength in recent years.
Hurst Nominal Model - Visualised
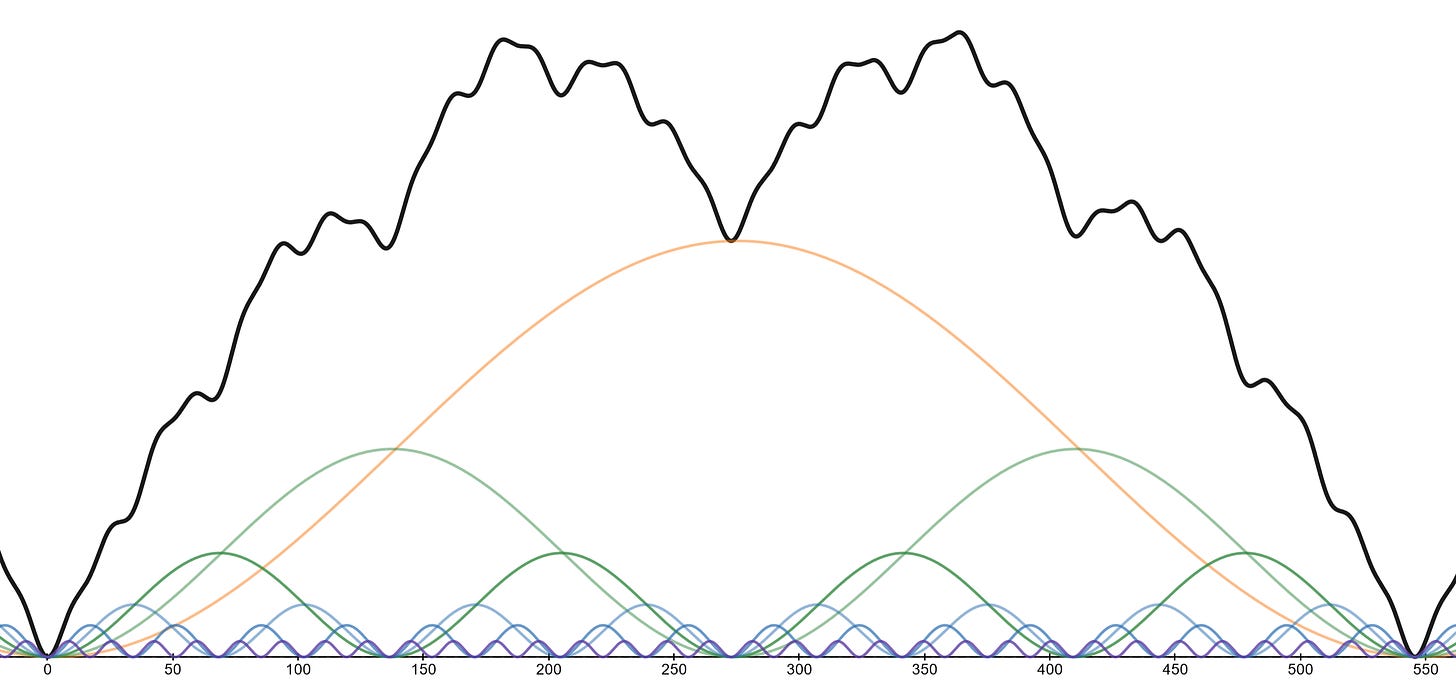
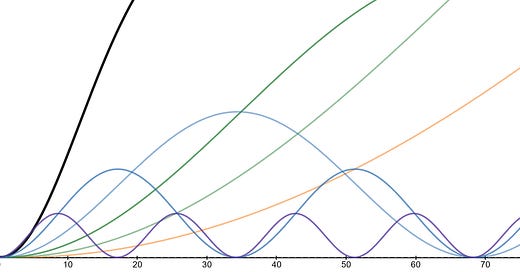
Below is a visual representation of Hurst’s nominal model using simple sinusoids and spanning one 18 month nominal cycle (545.6 days). Cycles here obey principles of proportionality (longer cycles = larger amplitude) and the principle of harmonicity (cycles are related by a simple integer ratio, usually 2:1 or 3:1).
The model here assumes a flat sigma-l and so is an entirely neutral cycle.

For in depth Hurst Cycles analysis of most popular live markets with long and short term overviews, price targets and levels, composite modelling and expert tips, please consider subscribing!
If you enjoy this article please consider sharing it with friends and colleagues.


