ΣL January 2024 Results & February Preview
The Sigma-L portfolio gained 31.21% (normalised 10.76%) in January 2024, across 20 trades. Join us as we examine the detailed figures and look forward to a tantalising February schedule
ΣL January 2024 Performance
Covering trade reports posted in January 2024 on Sigma-L.
View the full trade list and details in Google Sheets
Headline Numbers
Sigma-L Nominal vs Benchmarks - January 2024
vs. S&P 500 (1.49%): 29.72%
vs. Gold (-1.15%): 32.36%
vs. WTI Crude Oil (5.69%): 25.52%
vs. Bitcoin (0.01%): 31.20%
Monthly Breakdown

Total Nominal Gain: 31.21%
Total Normalised Gain: 10.76%
Total Trades: 20
Win:Loss Ratio: 1.5:1 (12:8)
Average Gain Per Trade: 1.56%
Win Percentage: 60%
Average Win: 3.98% / Average Loss: -2.07%
Average Duration: 45 Days
Breakdown by Direction & ΣL Category

Sell Side (Nominal)
Total Gain: 7.63% / Trade Count: 12 / Win:Loss Ratio: 2:1 (8:4)
Average Gain Per Trade: 0.64%
Win Percentage: 67%
Average Win: 1.6% / Average Loss: -1.29%
Average Duration: 37 Days
Biggest Win: 3.32% → Sell - ΣL Japanese Yen Composite 30th November 2023
Biggest Loss: -2.99% → Sell - S&P 500 8th December 2023
Buy Side (Nominal)
Total Gain: 23.58% / Trade Count: 8 / Win:Loss Ratio: 1:1 (4:4)
Average Gain Per Trade: 2.95%
Win Percentage: 50%
Average Win: 8.73% / Average Loss: -2.84%
Average Duration: 57 Days
Biggest Win: 10.96% → Buy - CBOE Volatility Index 1st December 2023
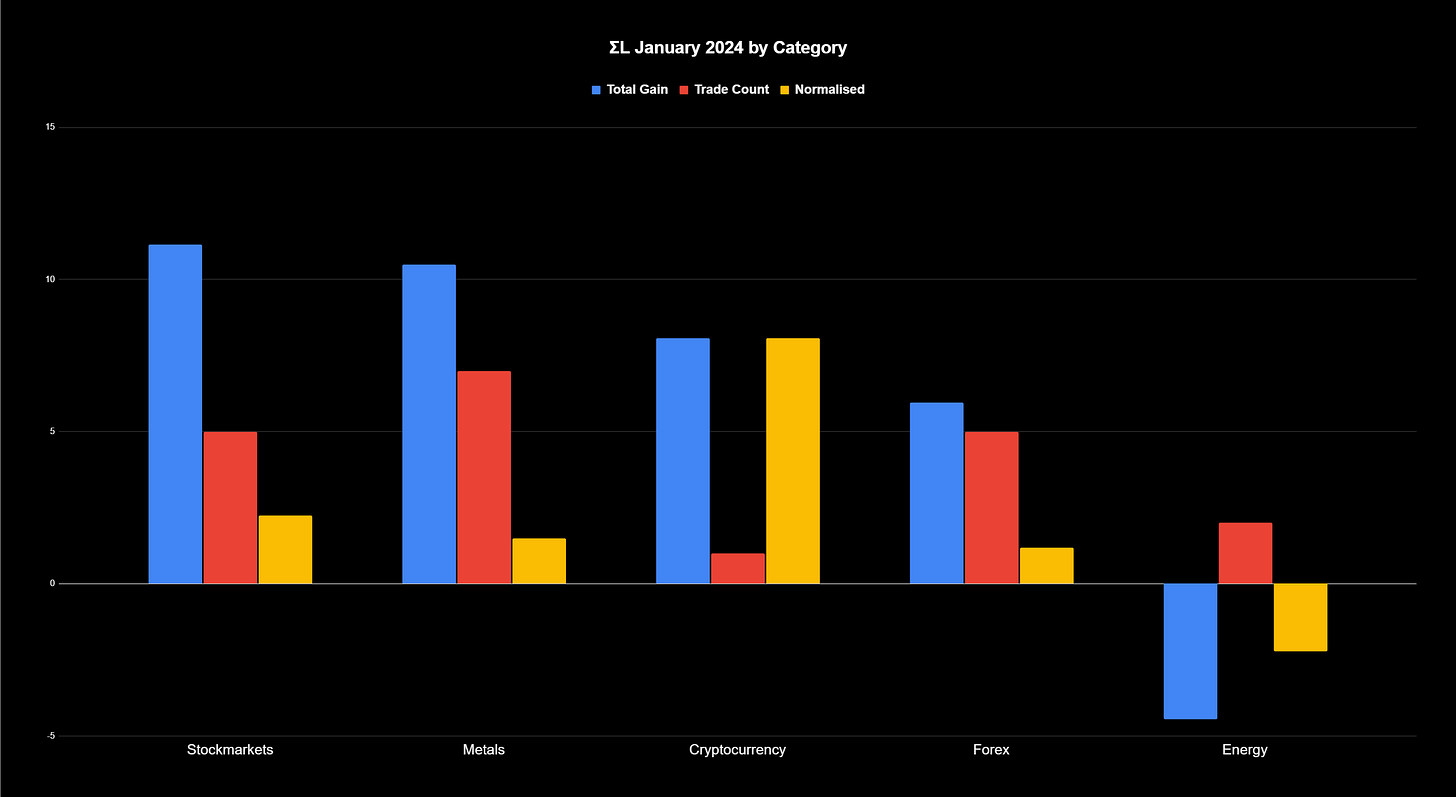
Biggest Loss: -6.32% → Late Buy - Silver 4th December 2023Nominal / Normalised Gain By ΣL Category (Trade Count)
Stock Markets: 11.16% / 2.23% (5)
Metals: 10.48% / 1.50% (7)
Cryptocurrency: 8.06% / 8.06% (1)
Forex: 5.56% / 1.19% (5)
Energy: -4.45% / -2.23% (2)
Commodities: no trades
Dates for your Diary - February 2024
January 2024 Recap
January was fairly quiet in the grand scheme of things, recording a relatively small nominal gain of 31.21% over the period. Stock markets led the way with a mild correction via the ubiquitous 80 day nominal wave being slightly profitable, most notably via it’s inversion in the VIX. Following the large cycle trough in late October stock markets are now pushing toward what should be a highly anticipated peak of the nominal 40 week wave (~ 250 days) mid-late February. The 80 day nominal wave (~ 75 days at current phasing) should provide guidance. Our schedule above outlines the reporting dates to be aware of for individual measures.
Metals were subdued, Copper being once again the highlight with a small gain on a sell trade into the most recent 79 day low. Forex outperformed, the Dollar Index is currently exhibiting an outstanding stationarity at what might be termed the 20 week nominal wave, currently around 180 days. Energy was mixed, the current phasing in Oil is somewhat tricky at the shorter scale but we should be approaching a trough of the component around 80 days very soon. Over the last few iterations it has lost amplitude, causing the phase uncertainty. There is good news for crypto followers as the component around 180 days (previously retired) has resurfaced quite nicely from an analysis with our time frequency toolset. We will be reporting on that at the next projected low, currently scheduled for the end of February.
Don’t Miss..
Wednesday 8th February - ΣL Oil Composite 82 Days
The amplitude of this wave, as mentioned above, has been recently diminished. This generally happens for two reasons - suppression in a larger up or downtrend by a lower frequency component OR extra volatility (amplitude) via a higher frequency wave. In this case it is likely the latter. Subscribers should be aware of the highly stationary longer term wave in Oil, which is currently hard down.
Monday 12th February - Dollar Index 599 Days
This long term cyclical component in the Dollar Index is highly stationary and we should be starting to approach the next peak iteration mid-late February. Traders should be aware of the relatively large frequency modulation intrinsic for this kind of long term wave, currently around 52 days. However, this is a highly significant incoming peak for the Dollar and world currencies in general.
Wednesday 14th February - CBOE Volatility Index 77 Days
Currently one of the best signals featured on Sigma-L, options traders will be anticipating an explosion of volatility around this date as this periodic component approaches it’s latest trough. The current iteration has been characterised by sideways price action and the oscillations of a smaller component.
Thursday 22nd February - S&P 500 77 Days
Inverted to the VIX but with a slightly less discernible signal, this peak has been hotly anticipated for some time now with a plethora of furus(!) on fintwit proclaiming that price can not possibly move any higher. Well, timing is key and this wave has been known to subscribers since our launch, and to Hurst cycles aficionados for much longer. What is also known to subscribers is that the incoming peak is also likely a phase clustered peak of the 40 week wave, currently measured at around 250 days. We will be adding an analysis of the 40 week wave in US Stock Markets around the peak later this month.
Saturday 24th February - Copper 79 Days
The latest move up in copper from this component was anticipated to be weak due to the downward pressure of the larger wave around 160 days. This has, thus far, proved to be the case. A peak of the smaller wave is due around the 24th and could be a further chance to profit from the downside.
Monday 26th February - ΣL Uranium Composite 153 Days
Uranium fever has reached almost cryptocurrency levels of mania recently on fintwit. This is sometimes a rather esoteric measure of over exuberance but one which tends to repeat in a fascinating manner on social media. The peak of this prominent wave is due toward the end of February. Subscribers should also be aware of the smaller component around 77 days in uranium, which is currently also peaking.


