ΣL July 2023 Results & August Preview
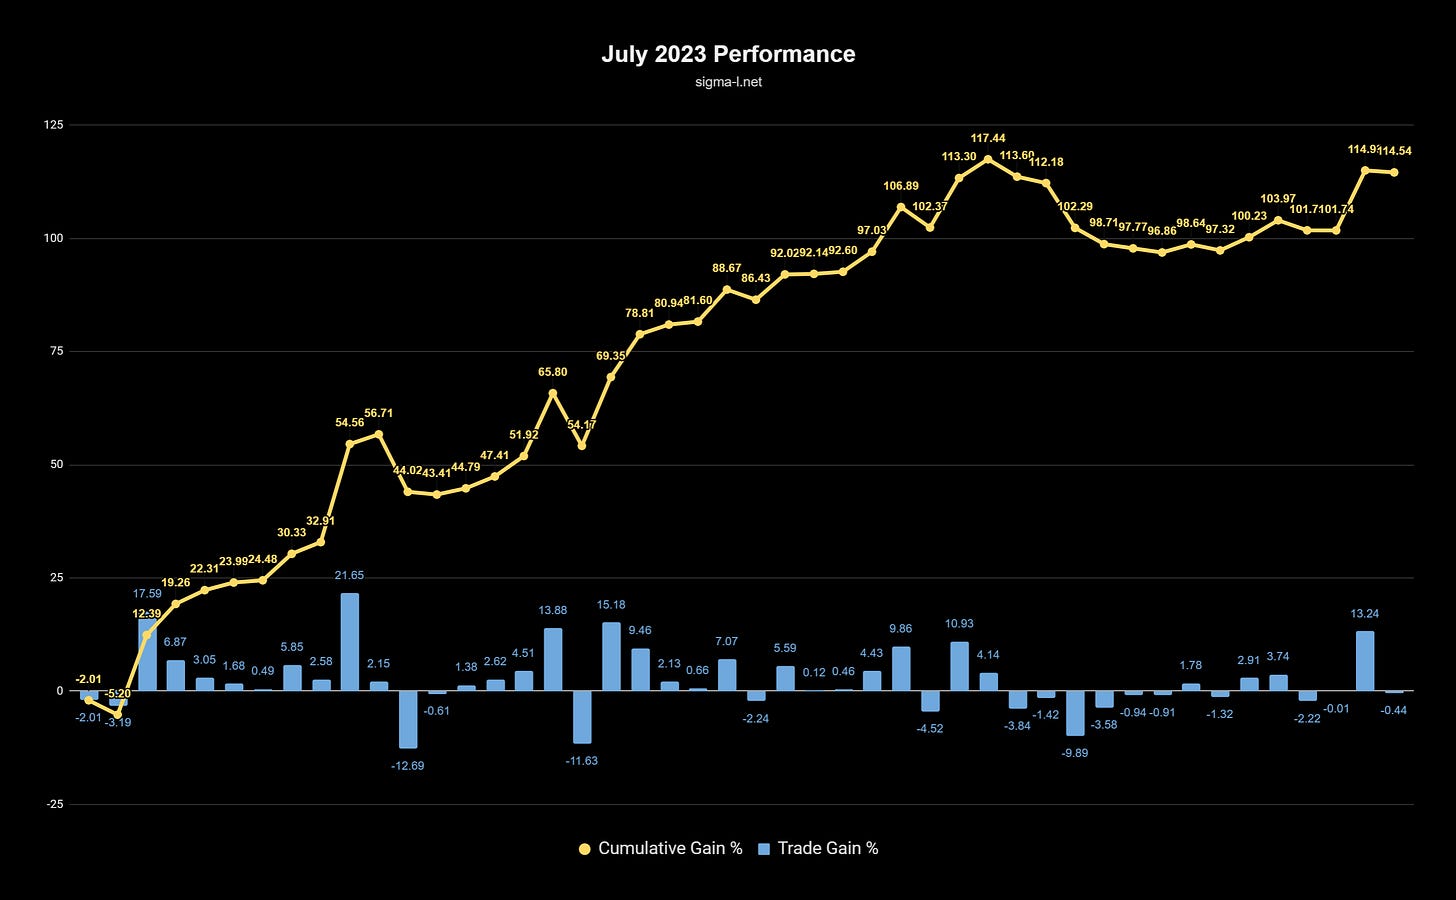
The Sigma-L portfolio saw a nominal gain of 114.54% (normalised 18.27%) in July 2023 from 46 trades. We also preview the August schedule and identify some crucial highlights.
ΣL July 2023 Performance
Covering trade reports posted in July 2023 on Sigma-L.
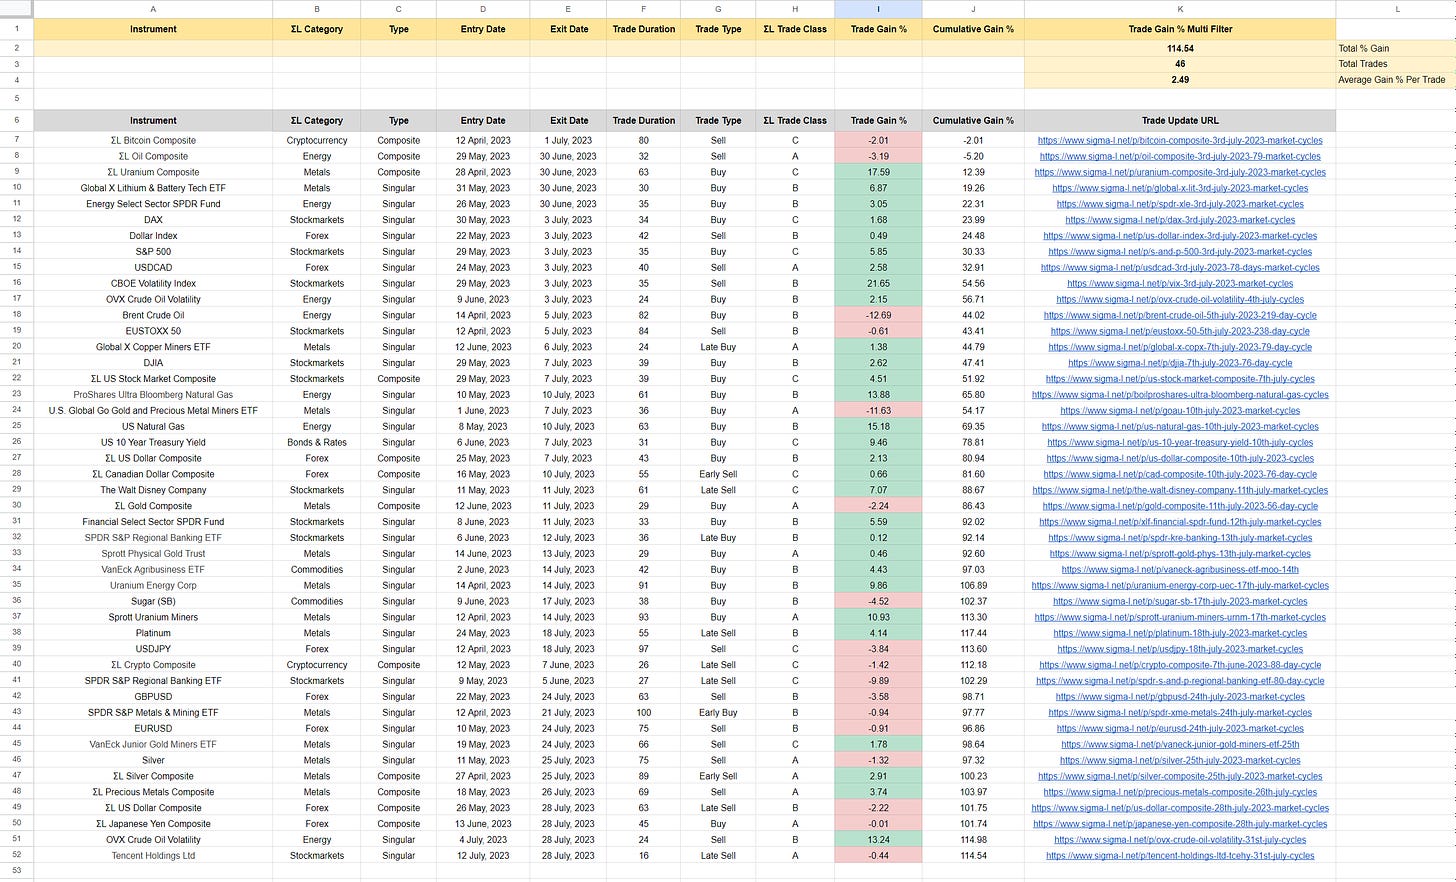
View the full trade list and details in Google Sheets
Headline Numbers
Sigma-L Nominal vs Benchmarks - July 2023
S&P 500 (2.99%): +111.55%
Gold (2.29%): +112.25%
WTI Crude Oil (16.80%): +97.74%
Bitcoin (-4.44%): +118.98%

Total Gain: 114.54% / Total Trades: 46 / Win:Loss Ratio: 1.71:1 (29:17)
Average Gain Per Trade: 2.49%
Win Percentage: 63%
Average Win: 6.07% / Average Loss: -3.62%
Average Duration: 51 Days
Breakdown by Direction & ΣL Category

Sell Side
Total Gain: 28.83% / Trade Count: 21 / Win:Loss Ratio: 0.91:1 (10:11)
Average Gain Per Trade: 1.37%
Win Percentage: 48%
Average Win: 5.83% / Average Loss: -2.68%
Average Duration: 56 Days
Biggest Win: 21.65% → Sell - CBOE Volatility Index 29th May 2023
Biggest Loss: -9.89% → Late Sell - SPDR S&P Regional Banking ETF 9th May 2023
Buy Side
Total Gain: 85.71% / Trade Count: 25 / Win:Loss Ratio: 3.17:1 (19:6)
Average Gain Per Trade: 3.43%
Win Percentage: 76%
Average Win: 6.20% / Average Loss: -5.34%
Average Duration: 47 Days
Biggest Win: 17.59% → Buy - ΣL Uranium Composite 28th April 2023
Biggest Loss: -12.69% → Buy - Brent Crude Oil 14th April 2023Gain By ΣL Category (Trade Count)
Metals: 43.53% (14)
Stock Markets: 38.15% (11)
Energy: 31.62% (7)
Bonds & Rates: 9.46% (1)
Commodities: -0.09% (2)
Cryptocurrency: -3.43% (2)
Forex: -4.7% (9)
Dates for your Diary - August 2023

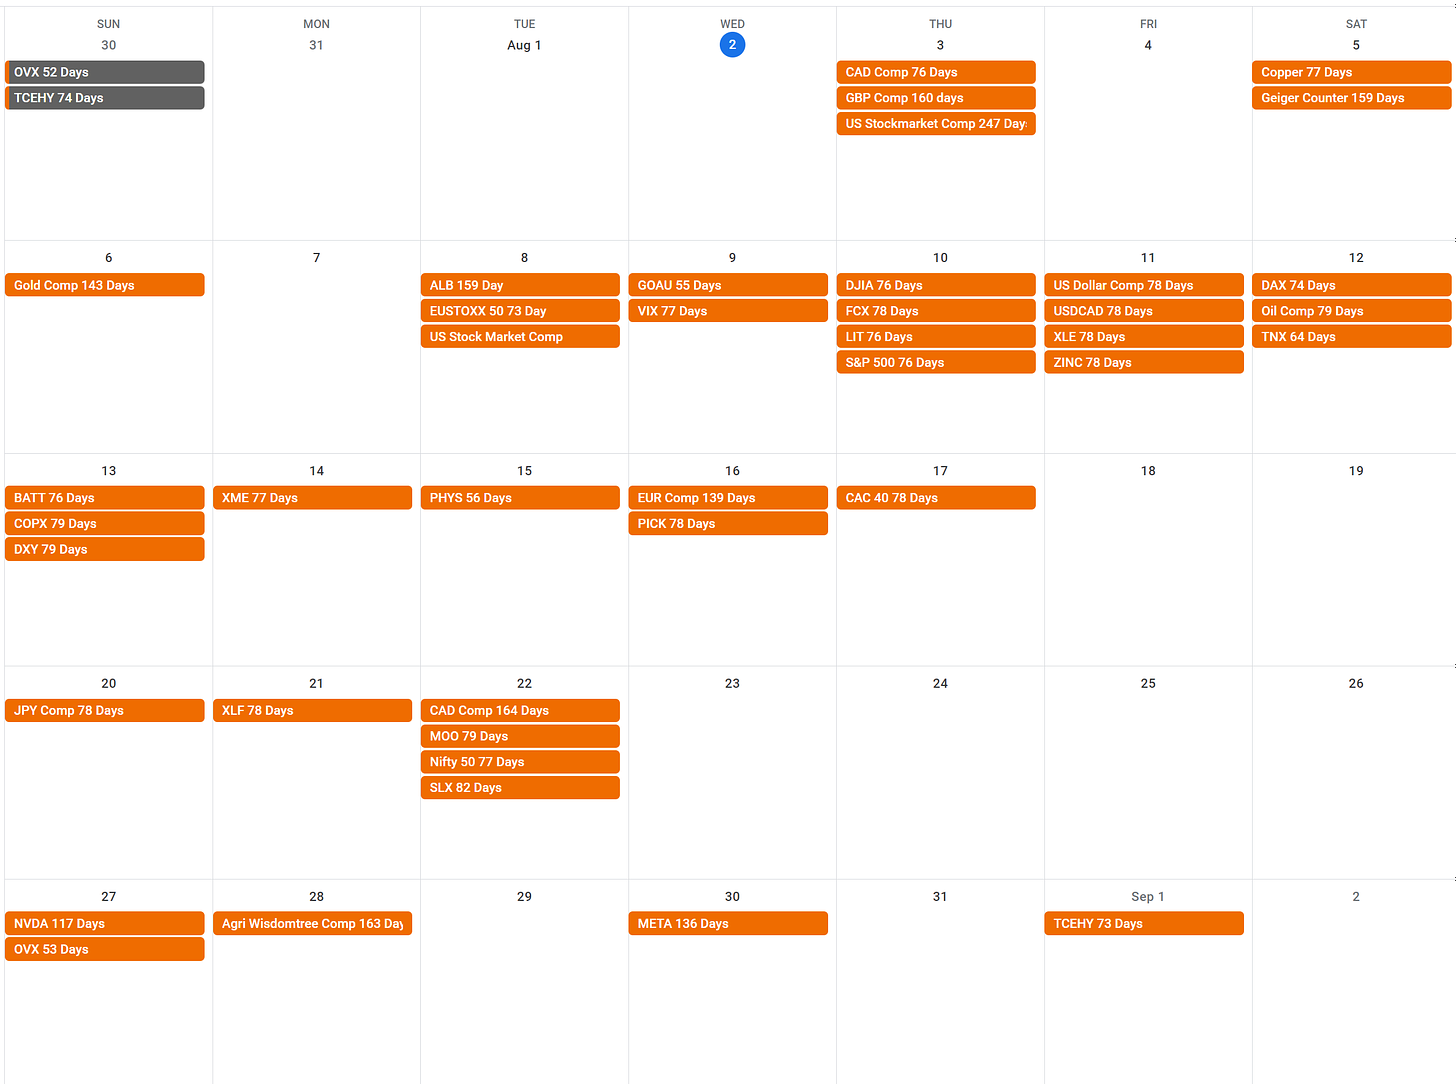
ΣL August 2023 Highlights
As we say goodbye to a profitable July with metals, stock markets and energy leading the way, August promises some fascinating results to come. Below we select a non exhaustive look at some highlights to watch out for.
Note: for component time targets that fall on a Saturday or Sunday, we will generally update these on the preceding Friday or following Monday.
Thursday 3rd August - GBP Composite 160 Days
The notable ‘20 week nominal’ component in USD pairs has been clear over the last few iterations since a significant low in late 2022, likely of yearly magnitude. The British Pound has been more bullish than others recently, will that trend continue as we anticipate the next trough?
Saturday 5th August - Copper (HG) 77 Days
The current iteration of the ~ 75 day component in High Grade Copper, has been sideways so far, setting up what could be an excellent with trend buy setup at the start of August. Watch out for that one.
Thursday 10th August - Global X Lithium & Battery Tech ETF 76 Days
Notionally the ‘80 day nominal’ component in Hurst nomenclature, the Global X Lithium & Battery Tech ETF has shown excellent periodicity over the last 7-8 iterations. A trough is due early August.
Saturday 12th August - Oil Composite 79 Days
There is suppression of the downleg section of the component at 79 days in oil at the moment. This generally occurs when a longer term and more powerful periodic component is pushing in the opposite direction - in this case, upward. The incoming component low may well be another with trend buy setup to look out for.
Tuesday 15th August - Sprott Physical Gold Trust (PHYS) 56 Days
The outstanding beacon component around 55 days in Gold is, as you may expect, also present in this instrument to a great degree. As price pulls back into the low, expected mid August, this could potentially be an excellent entry point long.
Sunday 27th August - NVIDEA Corp. (NVDA) 117 Days
The 20 week component, present in US and global stock markets at around 115 - 130 days average wavelength, is apparent here in the recently very bullish NVIDEA. This component has been forming a consolidation peak over the last few weeks and is due for a trough middle to late August.
A Quick Note on Strategy Optimisation
The time based signals and analysis we give on Sigma-L, grounded in our time frequency analysis, are deliberately under optimised. When proposing a trading strategy with a anticipated statistical edge, the analyst must be extremely careful to not overfit (curve fitting) and subsequently be fooled by randomness. In our case the error terms in the predictions are defined by modulation characteristics of the signal identified. It is these modulation ‘ranges’ which can possibly be further optimised to increase the already excellent edge this approach has.
Readers are, of course, free to add additional filters, time or price based, to optimise entry. One time based example might be to only enter trades which also have a larger, with trend, periodic component providing additional impetus. One price based example might be to use a momentum indicator as a signal for peak or trough occurrence.
New Results and Schedule Format
I hope you have enjoyed July’s updates and I also hope this report brings some transparency to bear upon the results we post using our time / signal processing based strategy.
Going forward, this will be the format for reporting each month to subscribers in addition to the regular updates on each instrument we post.


Great performance. Most focus on price level but we focus on time. Surely a less crowded path towards alpha.
amazing!