ΣL Signal Rating System
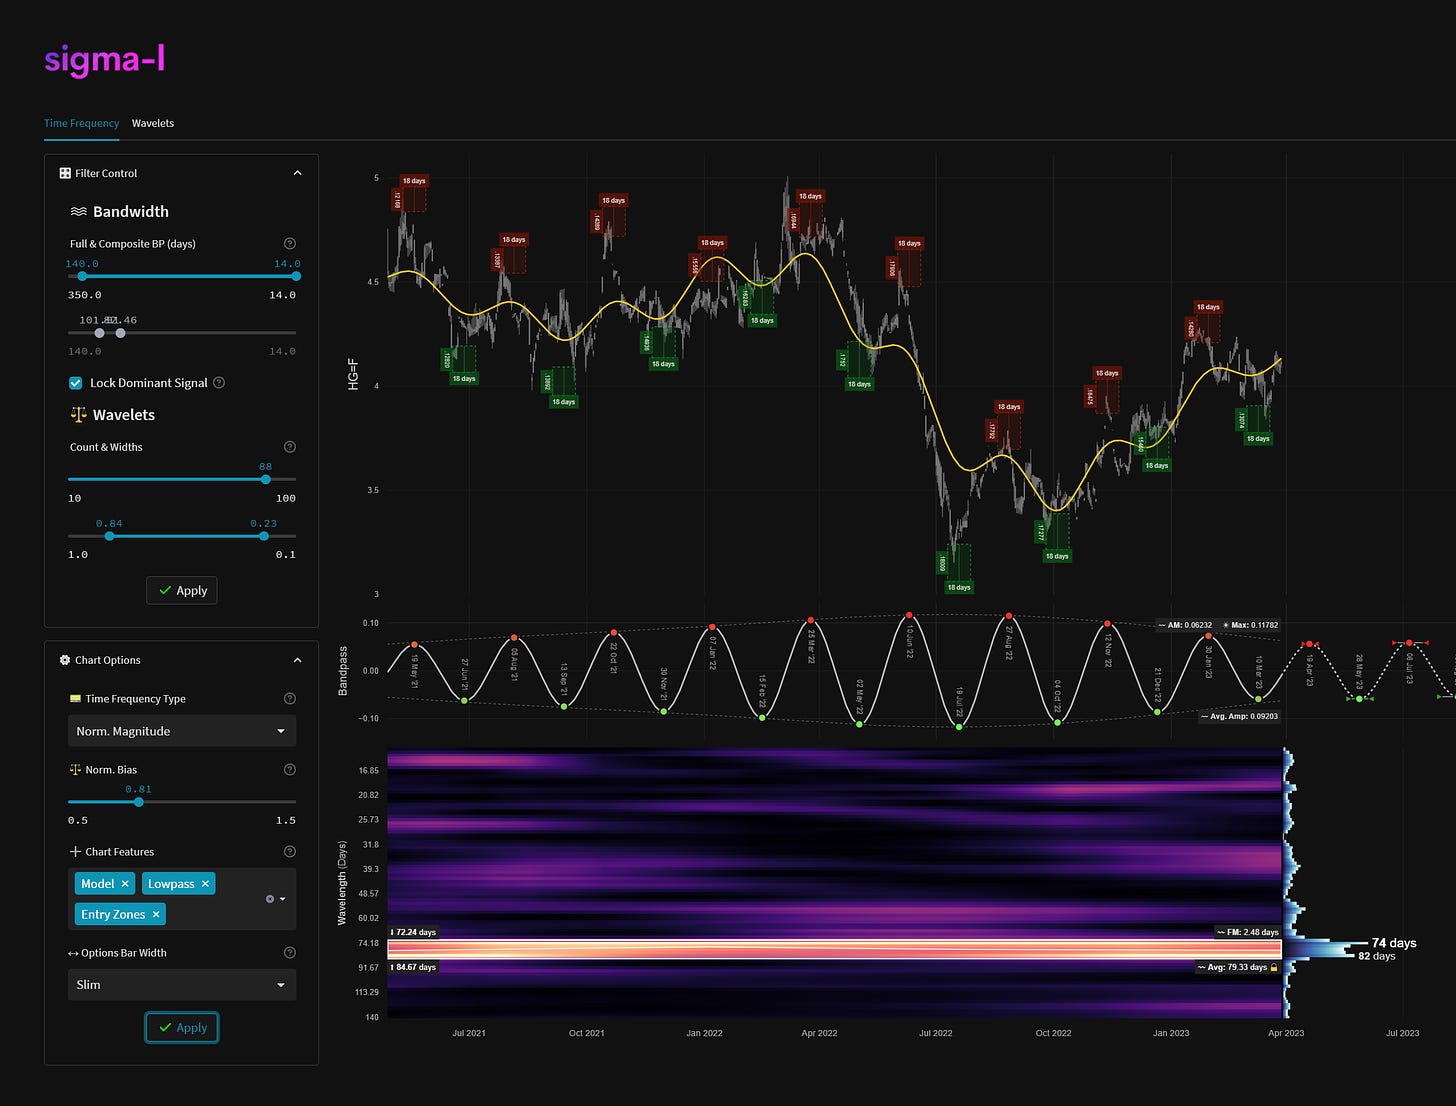
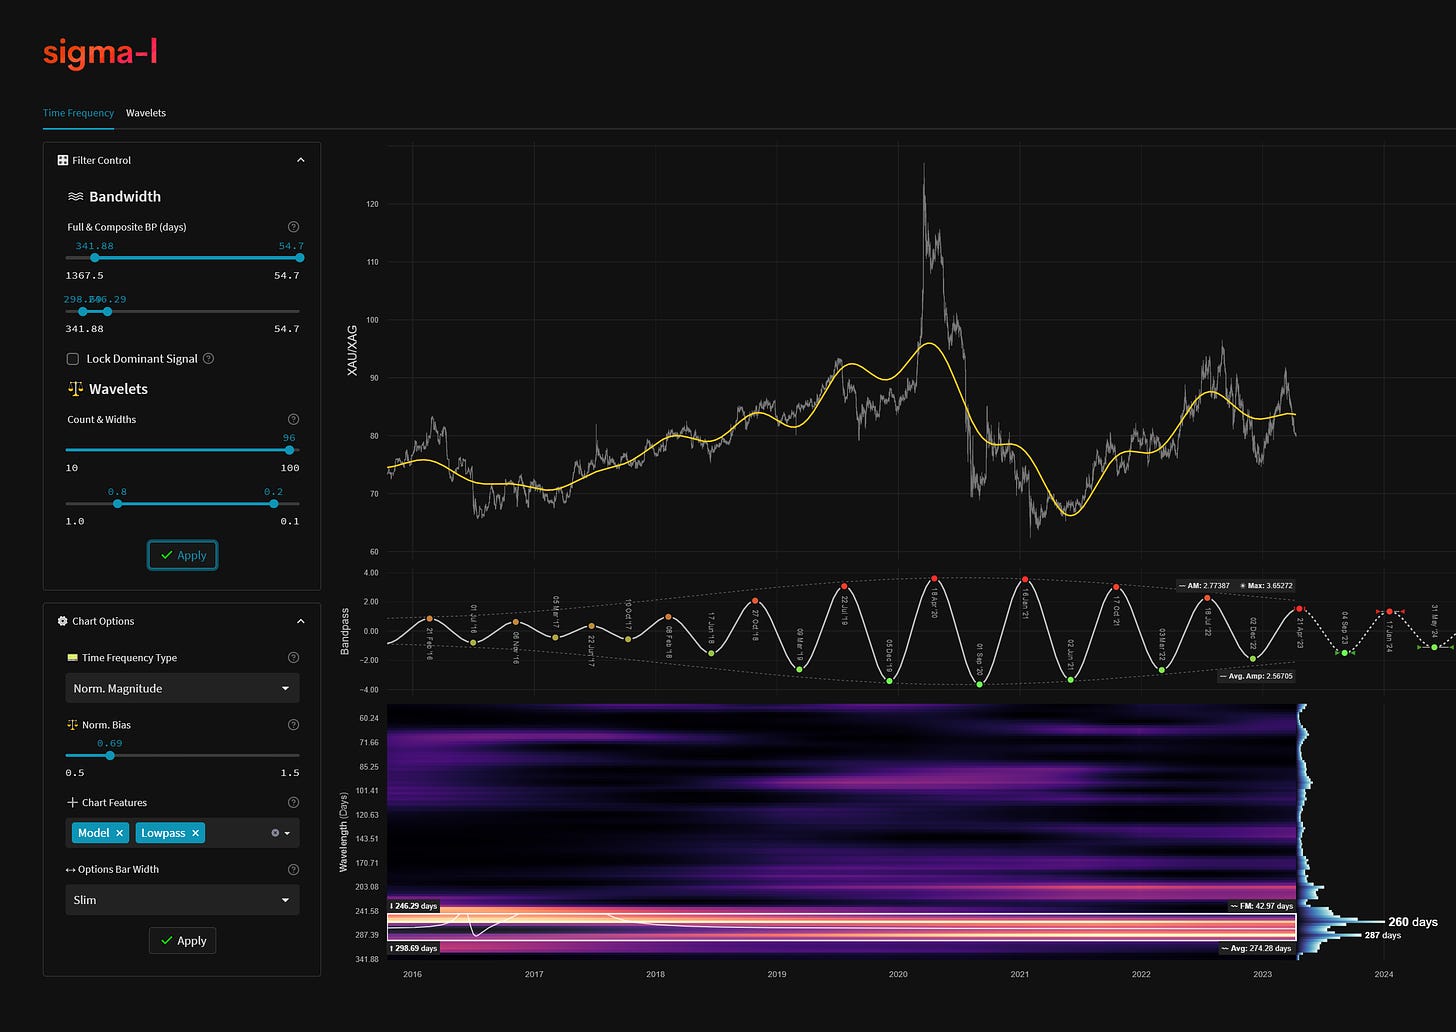
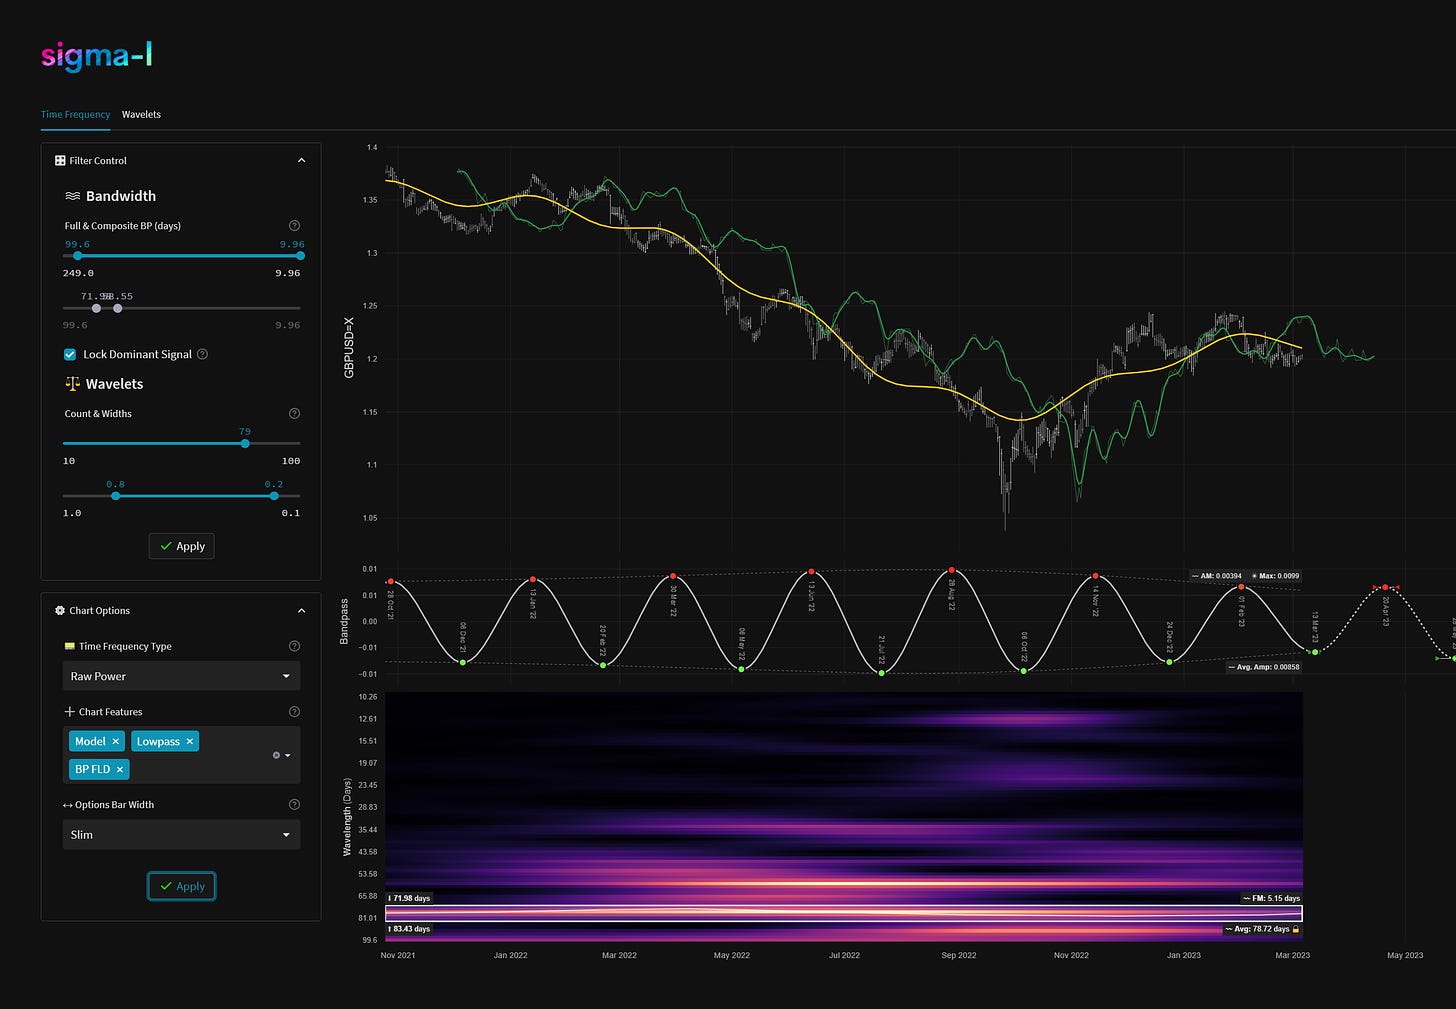
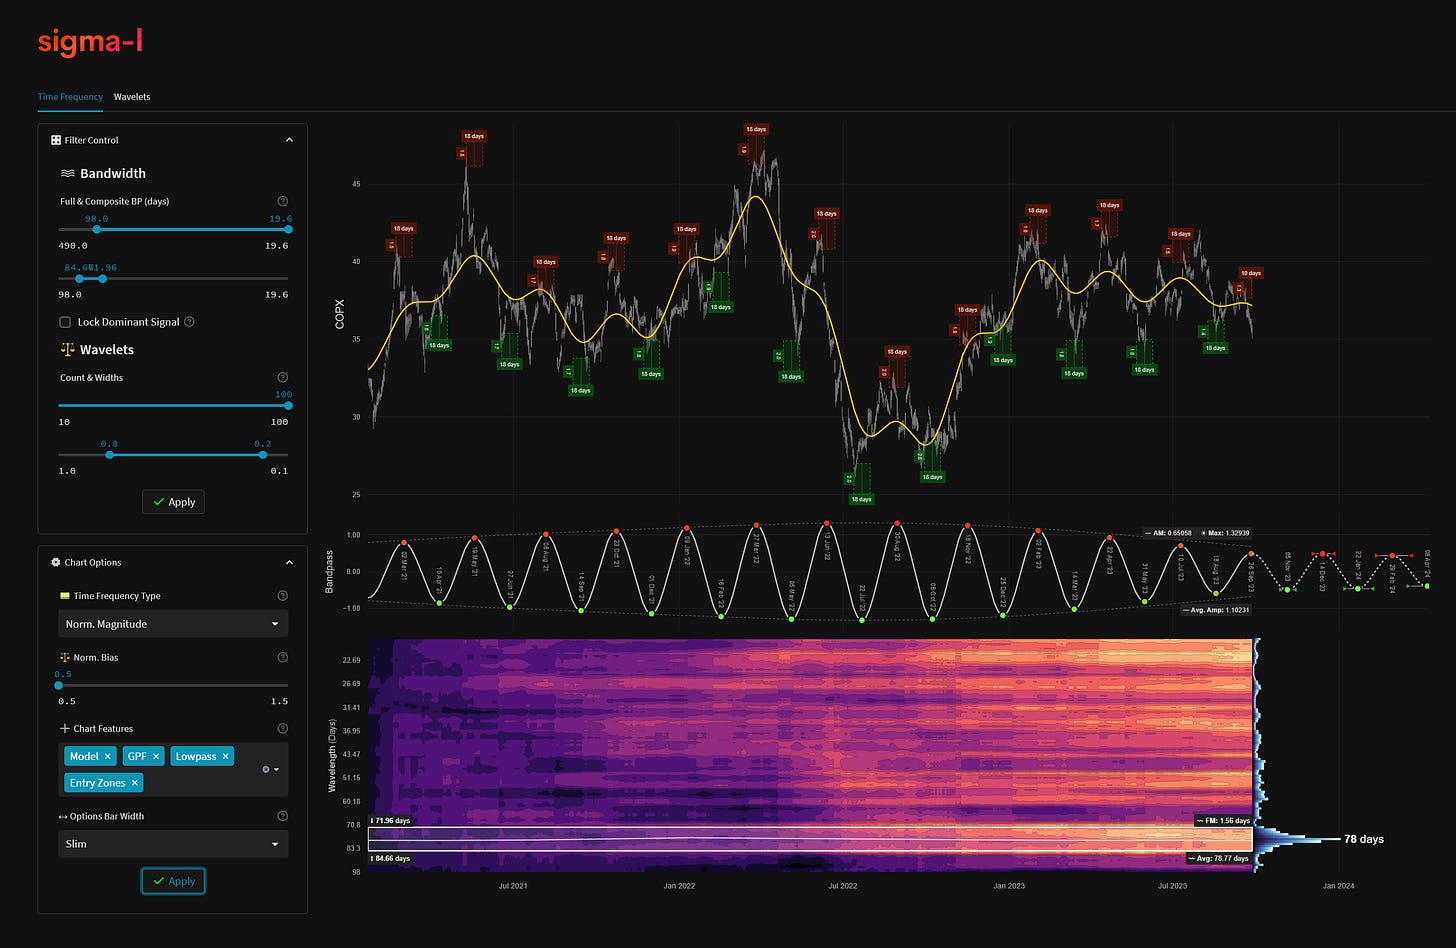
This article looks at how we differentiate periodic signal classes on Sigma-L. This is a helpful resource to refer to when interpreting the time frequency plots presented in our market reports.
‘A’ Class
Highly amplitude stationary for the majority of the sample
Highly frequency stationary for the majority of the sample
Maximum gain per frequency across the frequency range and within the bandwidth of the signal, within the sample timeframe
Clear spectral spacing around the signal

‘B’ Class
Highly amplitude stationary for at least half of the sample
Highly frequency stationary for at least half of the sample
Maximum or second highest gain per frequency across the frequency range and within the bandwidth of the signal, within the sample timeframe
Clear spectral spacing around the signal

‘C’ Class
Highly amplitude stationary for at least half of the sample
Highly frequency stationary for at least half of the sample
Maximum or second highest gain per frequency across the frequency range and within the bandwidth of the signal, within the sample timeframe

Component Yield Over Sample
This metric uses our gain per frequency measure to show the total notional yield over the sample timeframe if a trader/investor had bought / sold short at the troughs and peaks given by the time frequency analysis. The component highlighted in the report is measured for the duration of the timeframe, with a running cumulative total of yield at each timepoint. This can be thought of as a ‘brute force’ time frequency analysis with amplitude replaced by yield, in some sense.


