Lloyds Banking Group PLC (LLOY) - 25th August 2023 | @ 79 Days
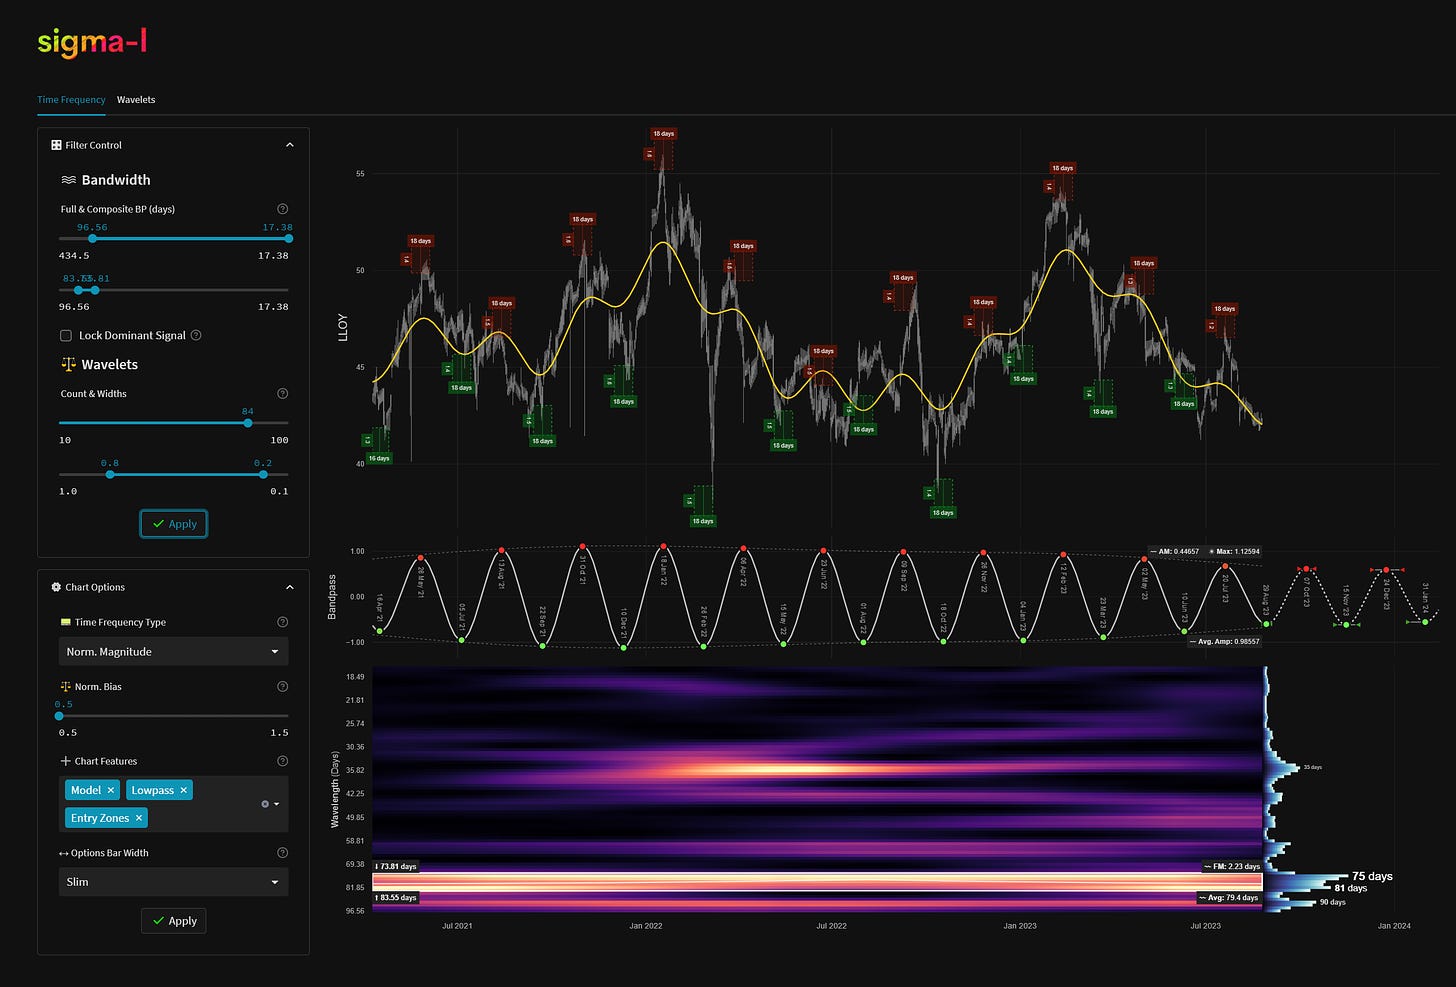
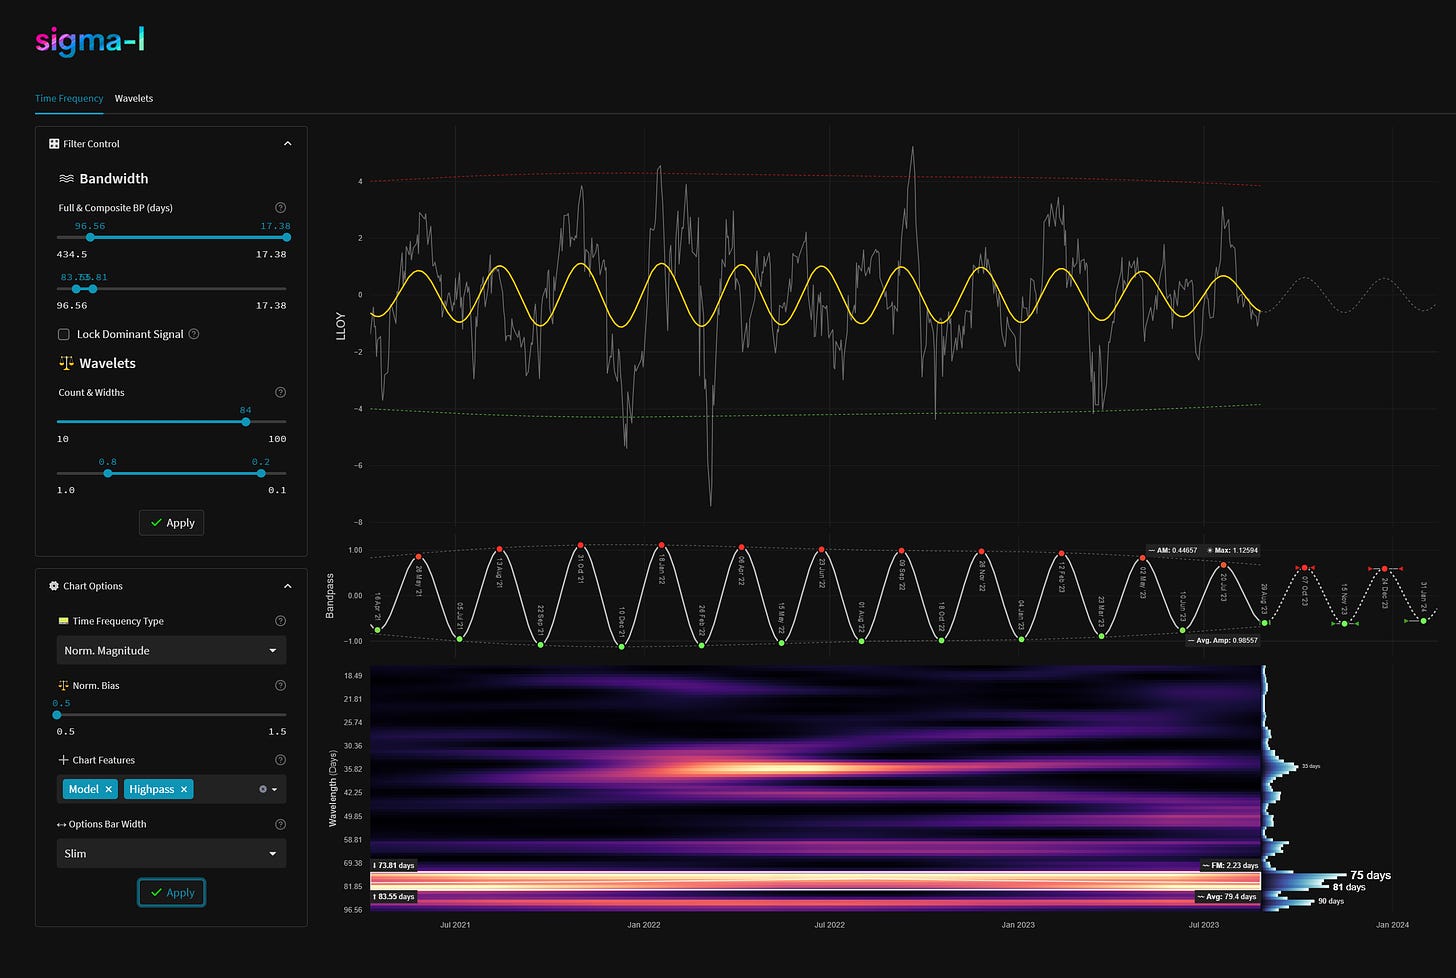
'B' class signal detected in Lloyds Banking Group PLC (LLOY). Running at an average wavelength of 79 days over 11 iterations since April 2021. Currently approaching a trough.
Instrument Summary
Lloyds Banking Group, a prominent UK financial institution, emerged in 2009 from Lloyds TSB's acquisition of HBOS. With a rich history dating back over 320 years to the founding of the Bank of Scotland, it serves 30 million customers and employs 65,000 people. Headquartered in London and Edinburgh, it operates across the UK and internationally in the US, Europe, the Middle East, and Asia, with its EU base in Berlin. Brands like Lloyds Bank, Halifax, and Bank of Scotland cater to diverse customer attitudes. Listed on the London Stock Exchange, it's a constituent of the FTSE 100 Index.
Current Signal Status
Defining characteristics of the component detected over the sample period.
Detected Signal Class: B - learn more
Average Wavelength: 79.4 Days
Completed Iterations: 11
Time Frequency Analysis
Time frequency charts (learn more) below will typically show the cycle of interest against price, the bandpass output alone and the bandwidth of the component in the time frequency heatmap, framed in white. If a second chart is displayed it will usually show highpassed price with the extracted signal overlaid for visual clarity.
Current Signal Detail & Targets
Here we give more detail on the signal relative to speculative price, given the detected attributes of the component. In most cases the time target to hold a trade for is more important, given we focus on cycles in financial markets. Forthcoming trough and peak ranges are based upon the frequency modulation in the sample (learn more).
Phase: Troughing
FM: +- 2 Days
AM: 0.44657
Next Trough Range: 27th August - 1st September, 2023
Next Peak Range: 5th October - 9th October, 2023
Sigma-L Recommendation: Early Buy
Time Target: ~ 7th October, 2023
Current Signal Phase
This is ‘how far along’ the cycle is in it’s period at now time and is related to the predicted price action direction.
Current Signal Frequency Modulation (FM)
This is how much, on average, the signal detected varies in frequency (or wavelength) over the whole sample. A lower variance is better and implies better profitability for the component. Frequency usually modulates relatively slowly and over several iterations.
Current Signal Amplitude Modulation (AM)
This is how much the component gains or loses power (price influence) across the sample, on average. Amplitude modulation can happen quite quickly and certainly is more evident than frequency modulation in financial markets. The more stable the modulation the better.


