


US Natural Gas - 18th March 2024 | @ 104 Days | - 5.59%
Last trade: - 5.59% | 'B' class signal detected in US Natural Gas. Average wavelength of 104 days over 10 iterations since July 2021. Currently troughing


ΣL Cycle Summary
This coherent component continues to be diminished as the price of US Natural Gas meanders in a sideways manner around the $1.5 - $2 mark, attempting to establish a bottom of both this wave and the larger component around 360 days. Both are now within the range of error for a low to occur so bulls should be alive to this opportunity. Whilst the larger component is due to peak in September of this year, this shorter wave should signify the turning point by establishing a right translated peak in May, before a pullback and continuation higher occurs into the 3rd quarter of 2024.
Trade Update
See also: Live ΣL Portfolio & History
Summary of the most recent trade enacted with this signal and according to the time prediction detailed in the previous report for this instrument, linked below.
Type: Late Sell - US Natural Gas 14th February 2024
Entry: 14th February 2024 @ 1.61
Exit: 18th March 2024 @ 1.70
Gain: - 5.59%
Before and After
Signal comparison between our last report and the current time, in chart format.
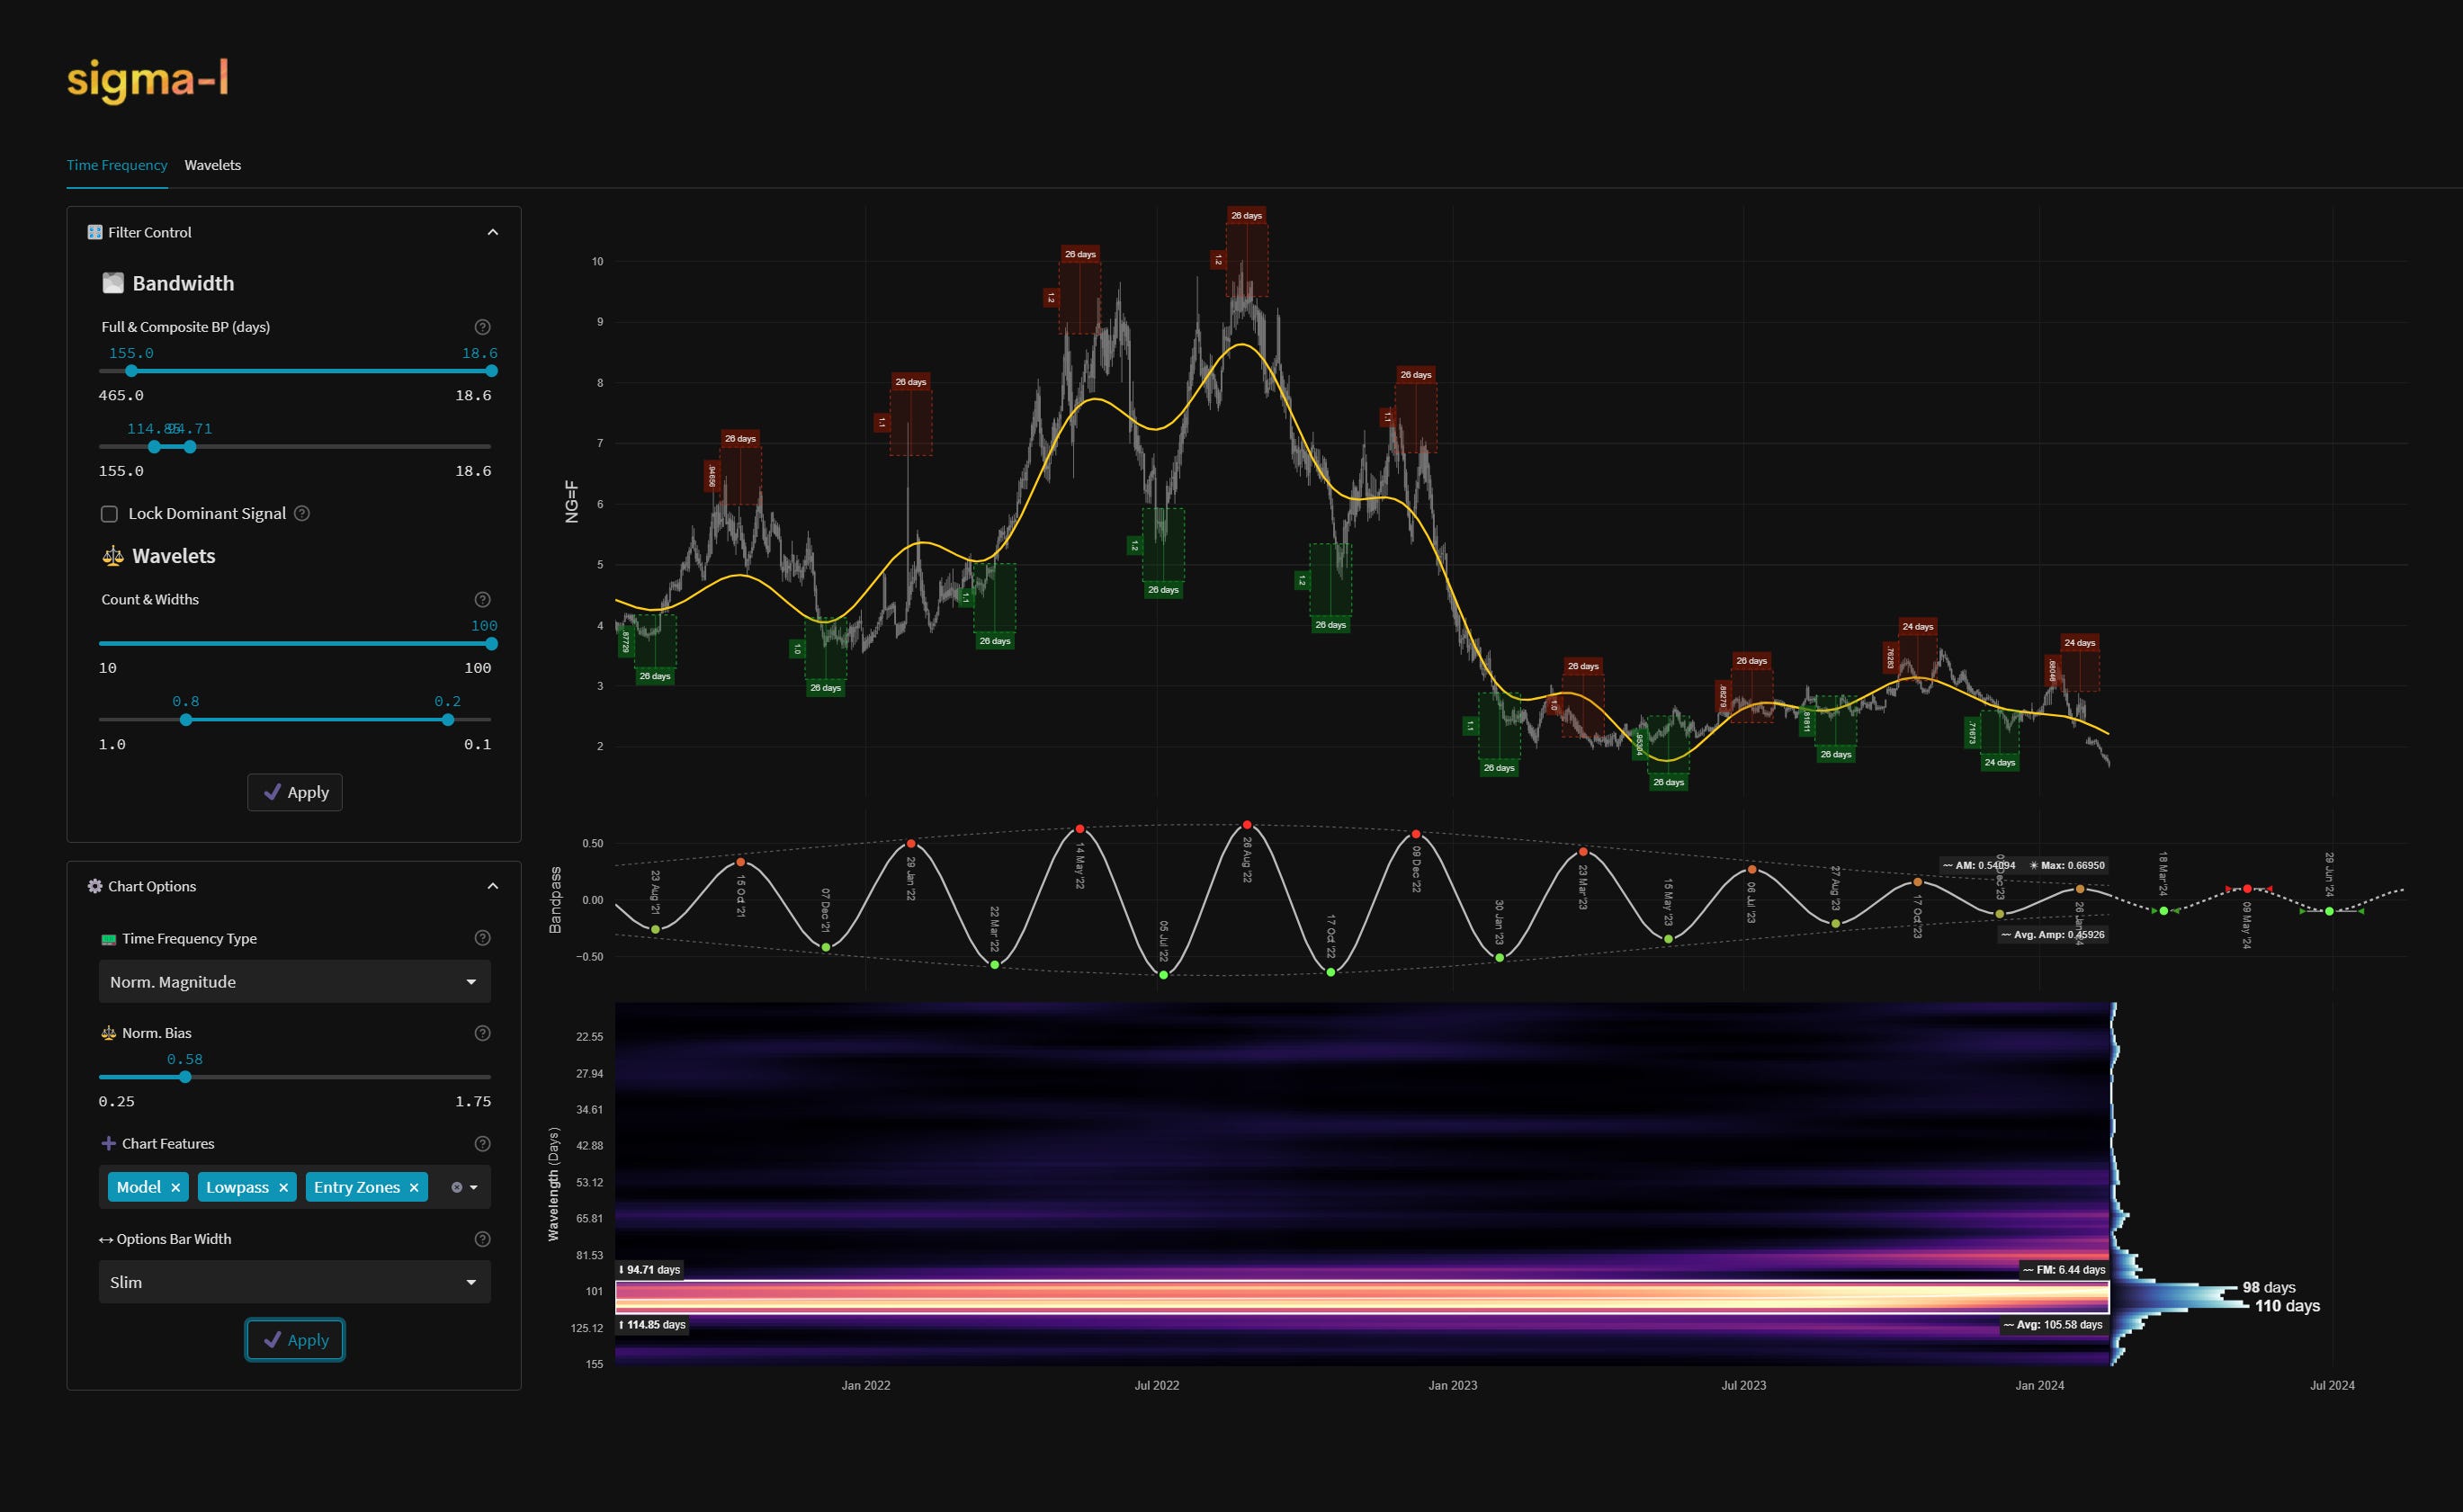
Time Frequency Analysis
Time frequency charts (learn more) below will typically show the cycle of interest against price, the bandpass output alone and the bandwidth of the component in the time frequency heatmap, framed in white. If a second chart is displayed it will usually show high-passed price with the extracted signal overlaid for visual clarity.