Natural Gas: Hurst Cycles - 14th October 2022
Price reaches target of 9 from 80 day nominal low 7th September. A subsequent, unexpected collapse forces a re-think on the phasing of longer components. We look at the options amid this uncertainty
Tools required: Nominal Model | FLD | FLD Trading Strategy | FLD Trading Strategy (Advanced) | Principle of Nominality | Underlying Trend
Analysis Summary
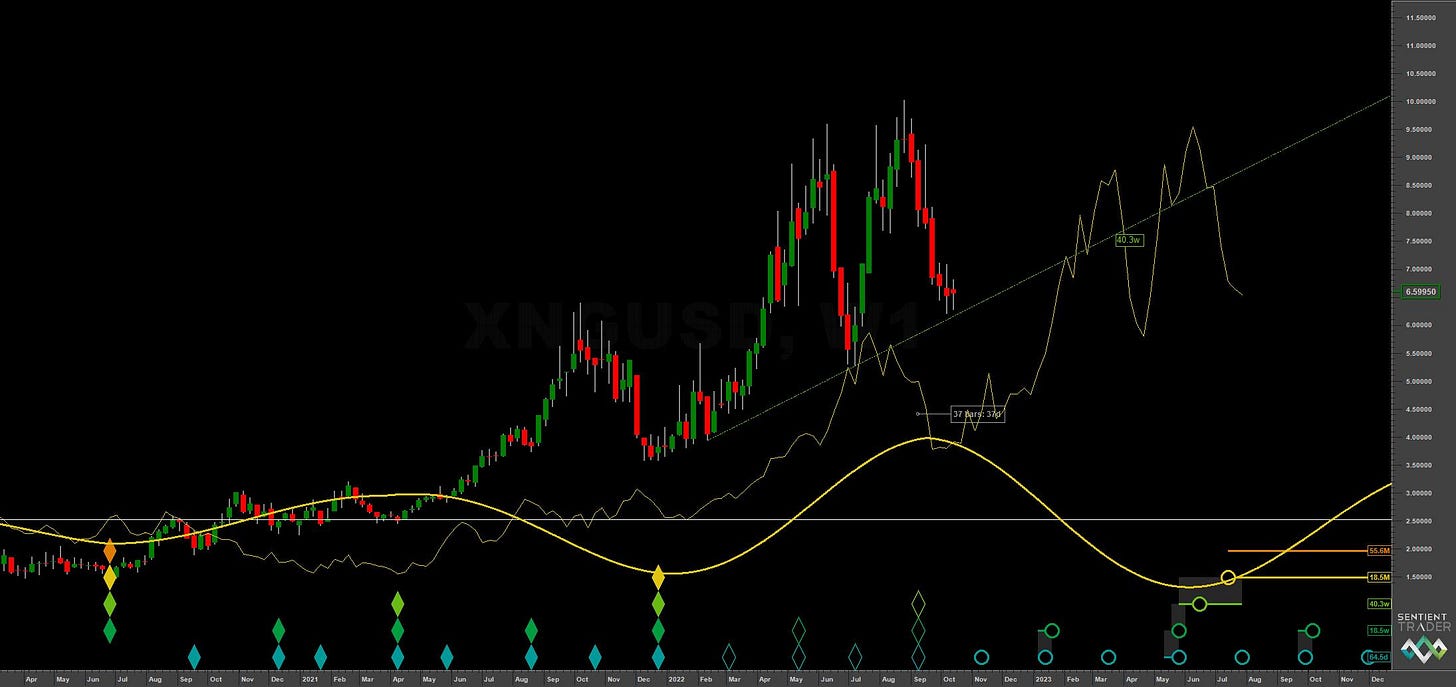
US Natural Gas has been significantly more bearish than anticipated for a low of 40 week magnitude, alluded to in the last report. Although price hit our target of 9-9.5 from the low on the 7th September, the subsequent collapse is certainly not befitting a larger component low.
At these points of uncertainty the skilled Hurstonian/cyclical trader considers which components they do have confidence in and, in this case, that component is likely the 40 day nominal wave. This is shown on the short term chart below running at an average wavelength of around 32 days and having recently troughed at the start of October.
The placement of the longer components, namely the 40 week wave, is now under scrutiny. The most likely candidate for the low is in July this year, although it would be a significant frequency modulation of the component. To clarify this placement we need to see the next 80 day component trough and confirmation, currently due mid November.
Assuming the previous 80 day component occurred on the 7th of September, 37 days have elapsed, more than half the average wavelength at 64.5 days of the 80 day wave. Clearly the first 40 day component of that cycle has been bearish, coming down to the 40 week VTL as shown on the long term chart. If the phasing is now accurate we should expect a further bearish 40 day component, perhaps to move down to the 18 month FLD support around 5-6 in the coming weeks.
The outlier possibility is that this 40 day nominal low that has occurred recently, around the 3rd October, is also the 80 day component. Initial price action is relatively sideways suggesting not but it is worth keeping that phasing in mind. Over the coming week price action will show the way and therefore a possible short is on offer for risk on traders, detailed below.
Phasing Analysis
Long Term
Components greater than and including the 18 month nominal cycle
Medium Term
Components less than and including the 18 month nominal cycle
Short Term
Components around the 80 day nominal cycle
Time Frequency
Wavelet convolution output targeting 40 day and 20 day nominal components
Trading Strategy
Interaction Status
Interactions and price in the FLD Trading Strategy (Advanced). This looks at an idealised 40 week cycle and an array of 3 FLD signal cycles. We apply the instrument’s phasing to the model and arrive at an overall summary for the interactions with the 20 day FLD, current and forthcoming.
Sigma-L recommendation: Sell
Entry: 5 Day FLD / Level: 6.27
Stop: Above forming 20 day nominal peak
Target: 5.73 (20 week FLD cross projection), 18 month FLD support
Reference 20 Day FLD Interaction: n/a
Underlying 40 Day FLD Status: n/a
Underlying 80 Day FLD Status: n/a
Since our confidence in the phasing is currently only at the 40 day component level interactions are not available for this trade. Given the average wavelength of the 40 day component is around 31 days, we are more than halfway along the current 80 day component at 37 days. The first half of the 80 day component, assuming the last trough occurred 7th September, was very bearish. Therefore, this next component should also be bearish to some degree.
The 20 week FLD cross target is down at 5.73, around the area of the 18 month FLD, shown on the long term chart.
Entry can either be below the level of the recent horizontal support circa 6.27 or a risk on entry short via the 5 day FLD, white on the short term chart.
FLD Settings
If you do not have the use of Sentient Trader use these settings to plot FLDs in your trading software (daily scale) to more easily follow trading signals and strategy from Sigma-L.
Make sure to account for non-trading days if your broker omits them in the data feed (weekends, for example). The below offsets are given with no added calculation for non-trading days.
80 day nominal: 64.5 days | 32 day FLD offset
40 day nominal: 31.7 days | 16 day FLD offset
20 day nominal: 16.4 days | 8 day FLD offset
10 day nominal: 8 days | 4 day FLD offset
Correlated Exposure Options
A non exhaustive list of correlated instruments for consideration
United States Natural Gas Fund LP UNG 0.00%↑
ProShares Ultra Bloomberg Natural Gas BOIL 0.00%↑
United States 12 Month Natural Gas Fund LP UNL 0.00%↑
iPath Series B Bloomberg Natural Gas Subindex Total Return ETN GAZ 0.00%↑
ProShares UltraShort Bloomberg Natural Gas KOLD 0.00%↑


