


ΣL October 2023 Results & November Preview
The Sigma-L portfolio saw a nominal gain of 127.59% (normalised 23.42%) in October 2023 via 44 trades. In this report we analyse the results and also look forward to November's schedule

ΣL September 2023 Performance
Covering trade reports posted in October 2023 on Sigma-L.
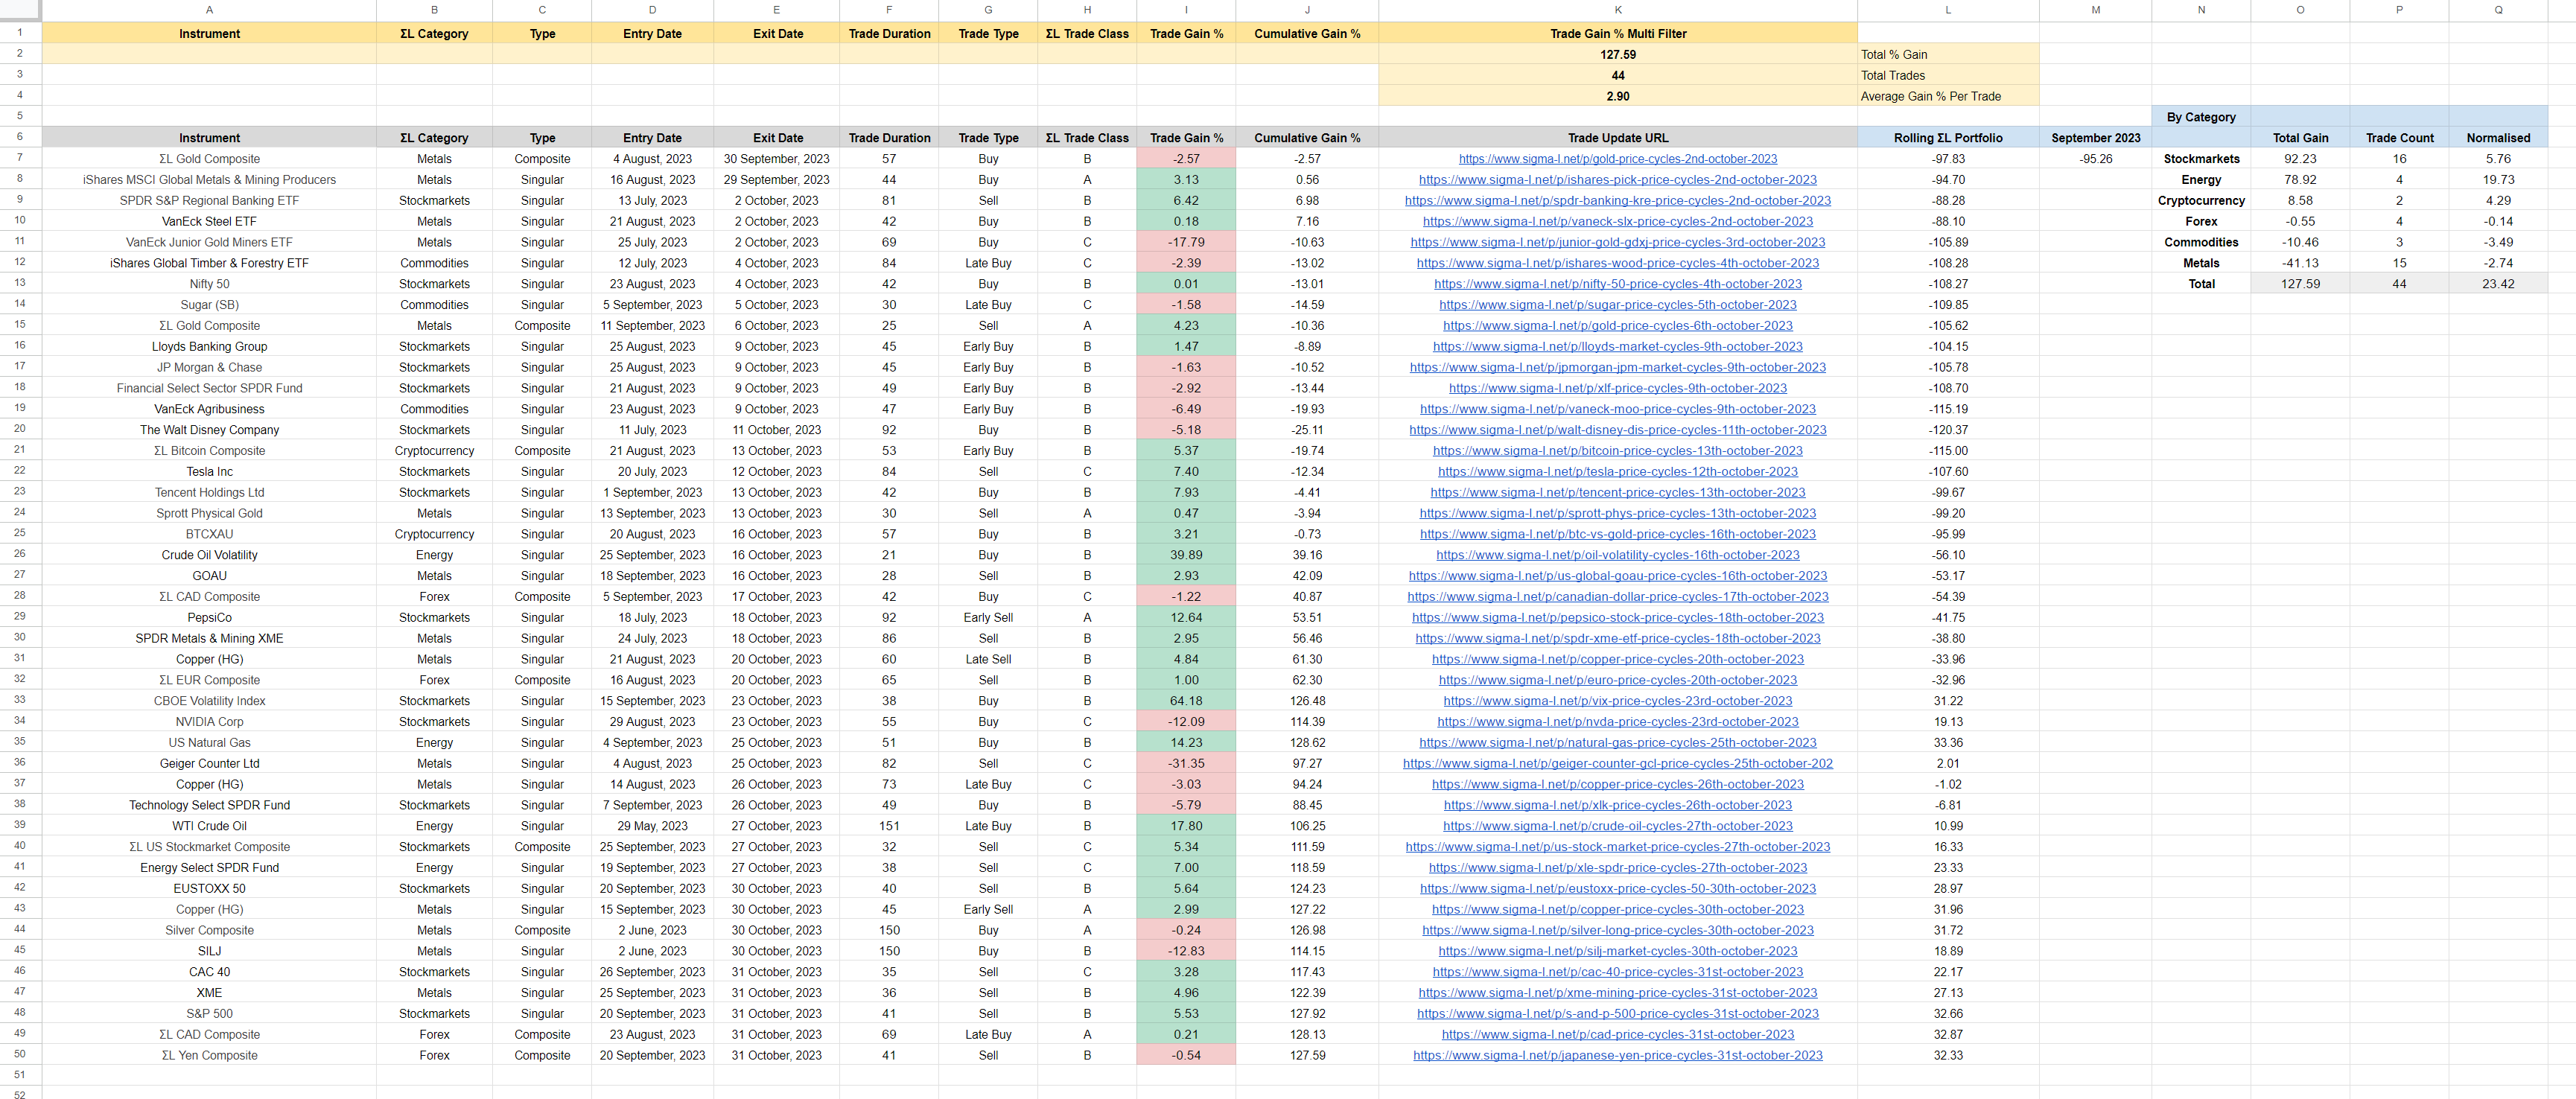
View the full trade list and details in Google Sheets
Headline Numbers
Sigma-L Nominal vs Benchmarks - October 2023
S&P 500 (-2.47%): 130.06%
Gold (8.55%): 119.04%
WTI Crude Oil (-7.52%): 135.11%
Bitcoin (27.79%): 99.8%
Monthly Breakdown
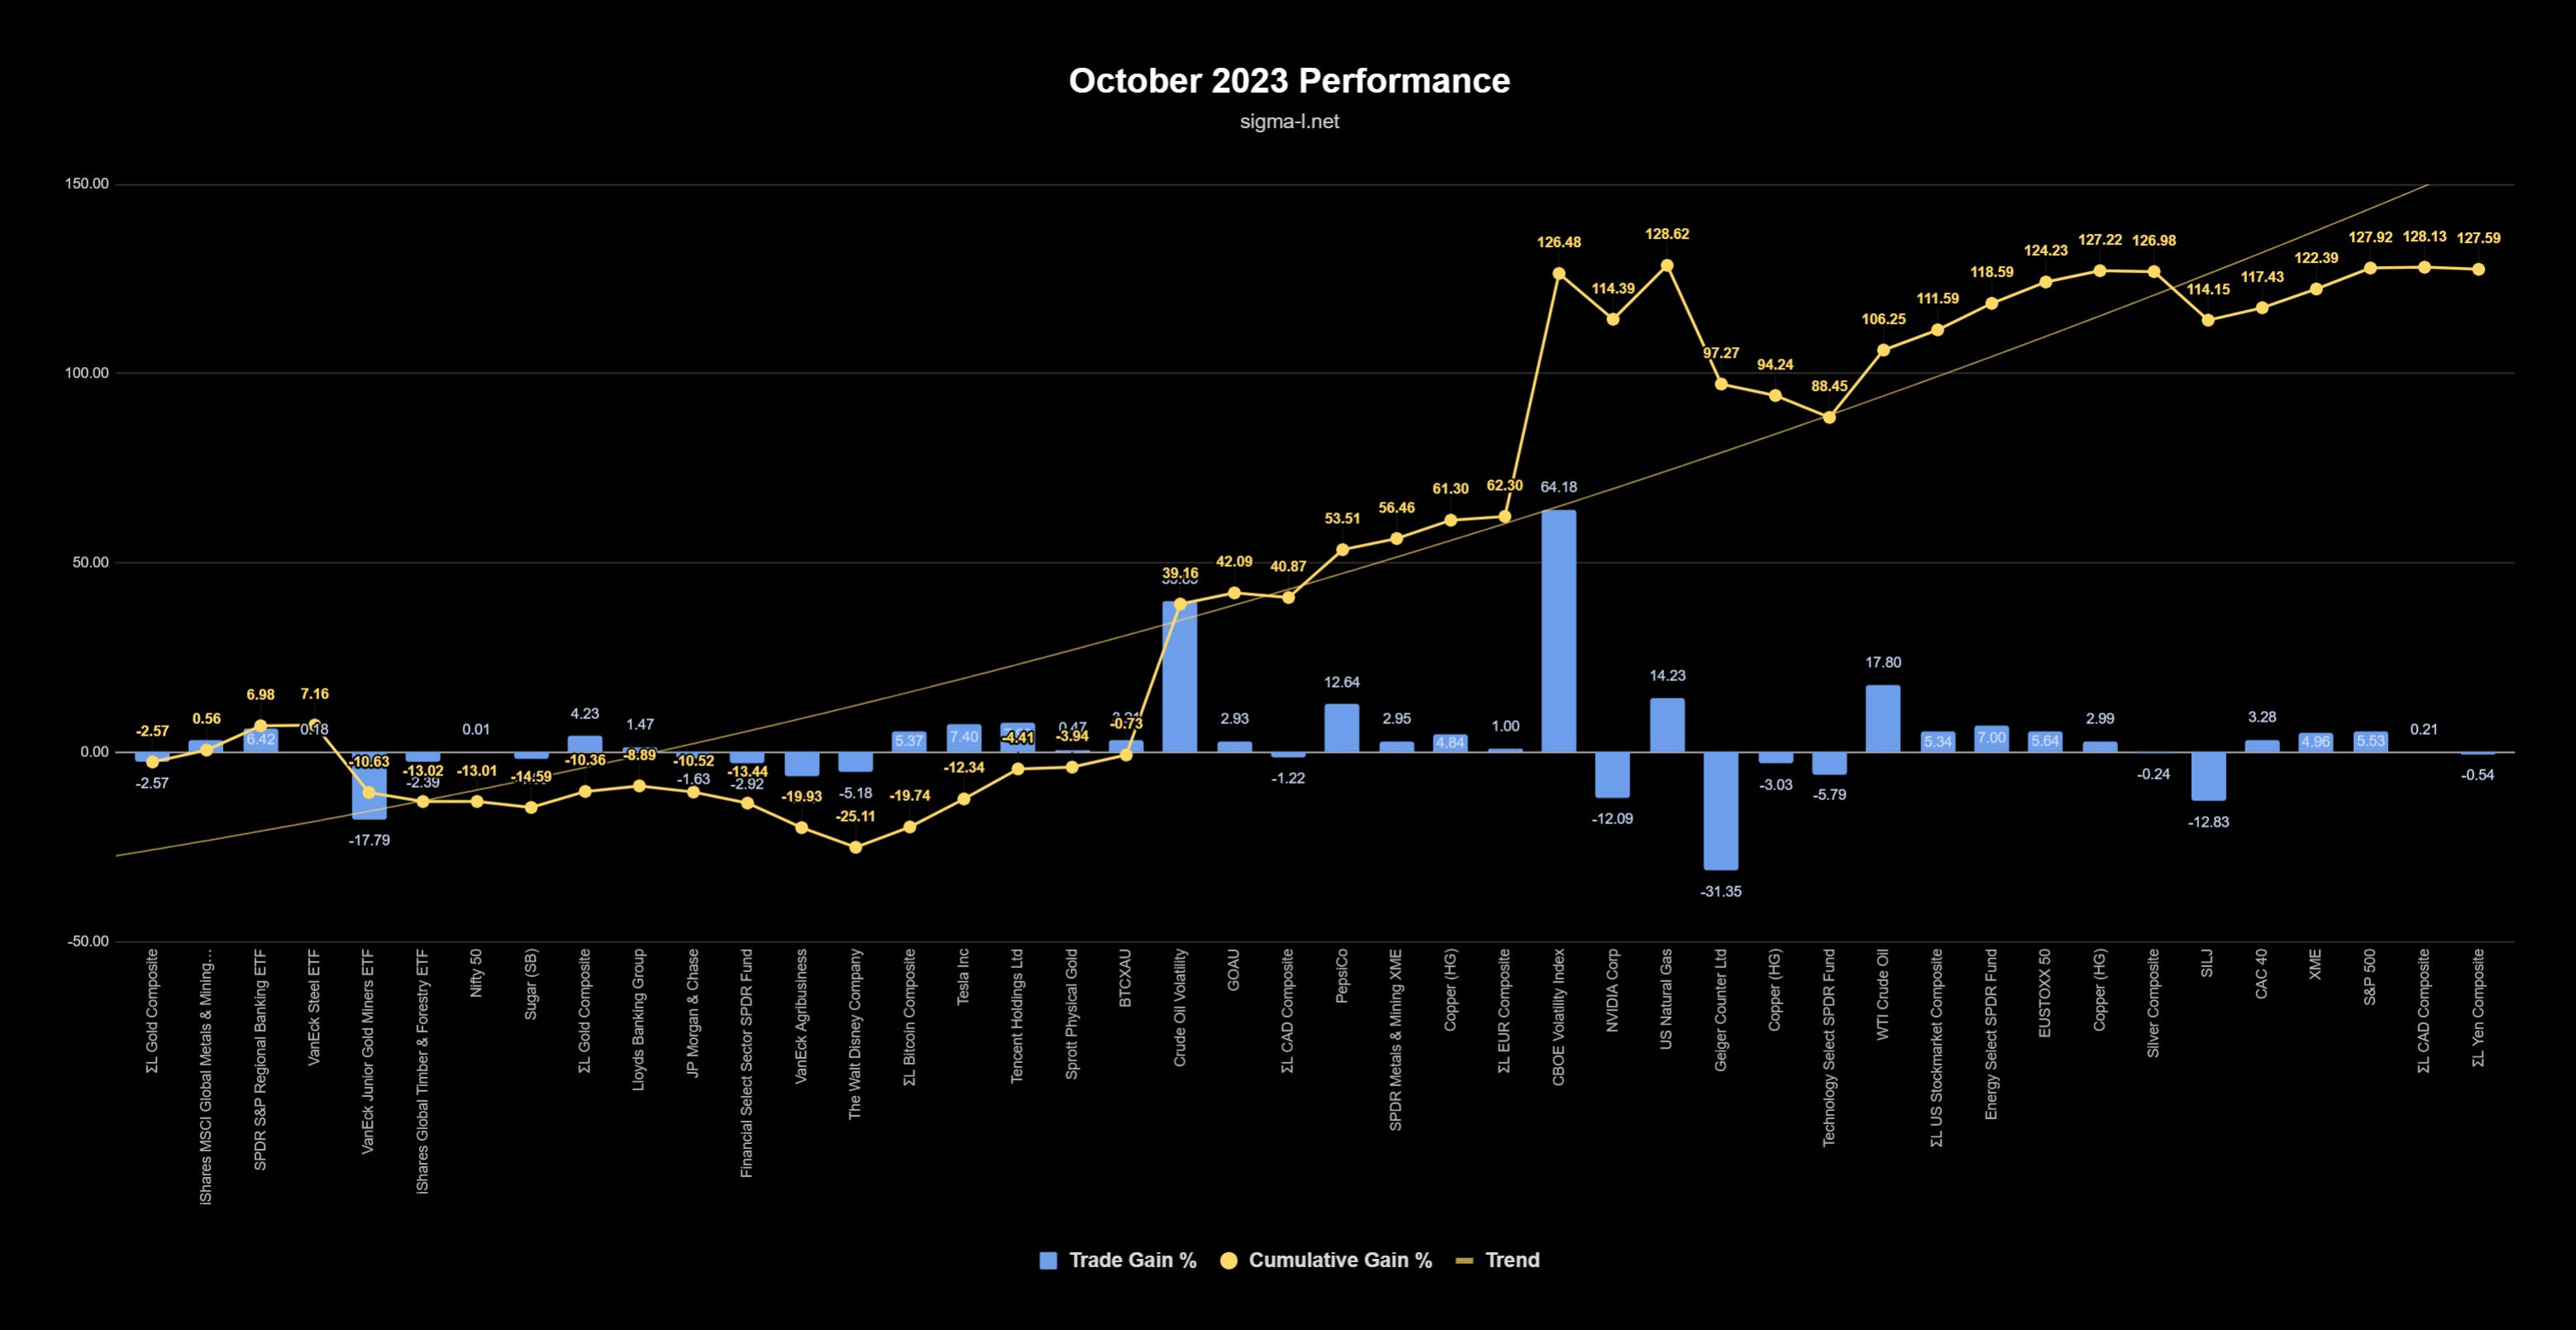
Total Nominal Gain: 127.59%
Total Normalised Gain: 23.42%
Total Trades: 44
Win:Loss Ratio: 1.75:1 (28:16)
Average Gain Per Trade: 2.90%
Win Percentage: 64%
Average Win: 8.40% / Average Loss: -6.73%
Average Duration: 59 Days
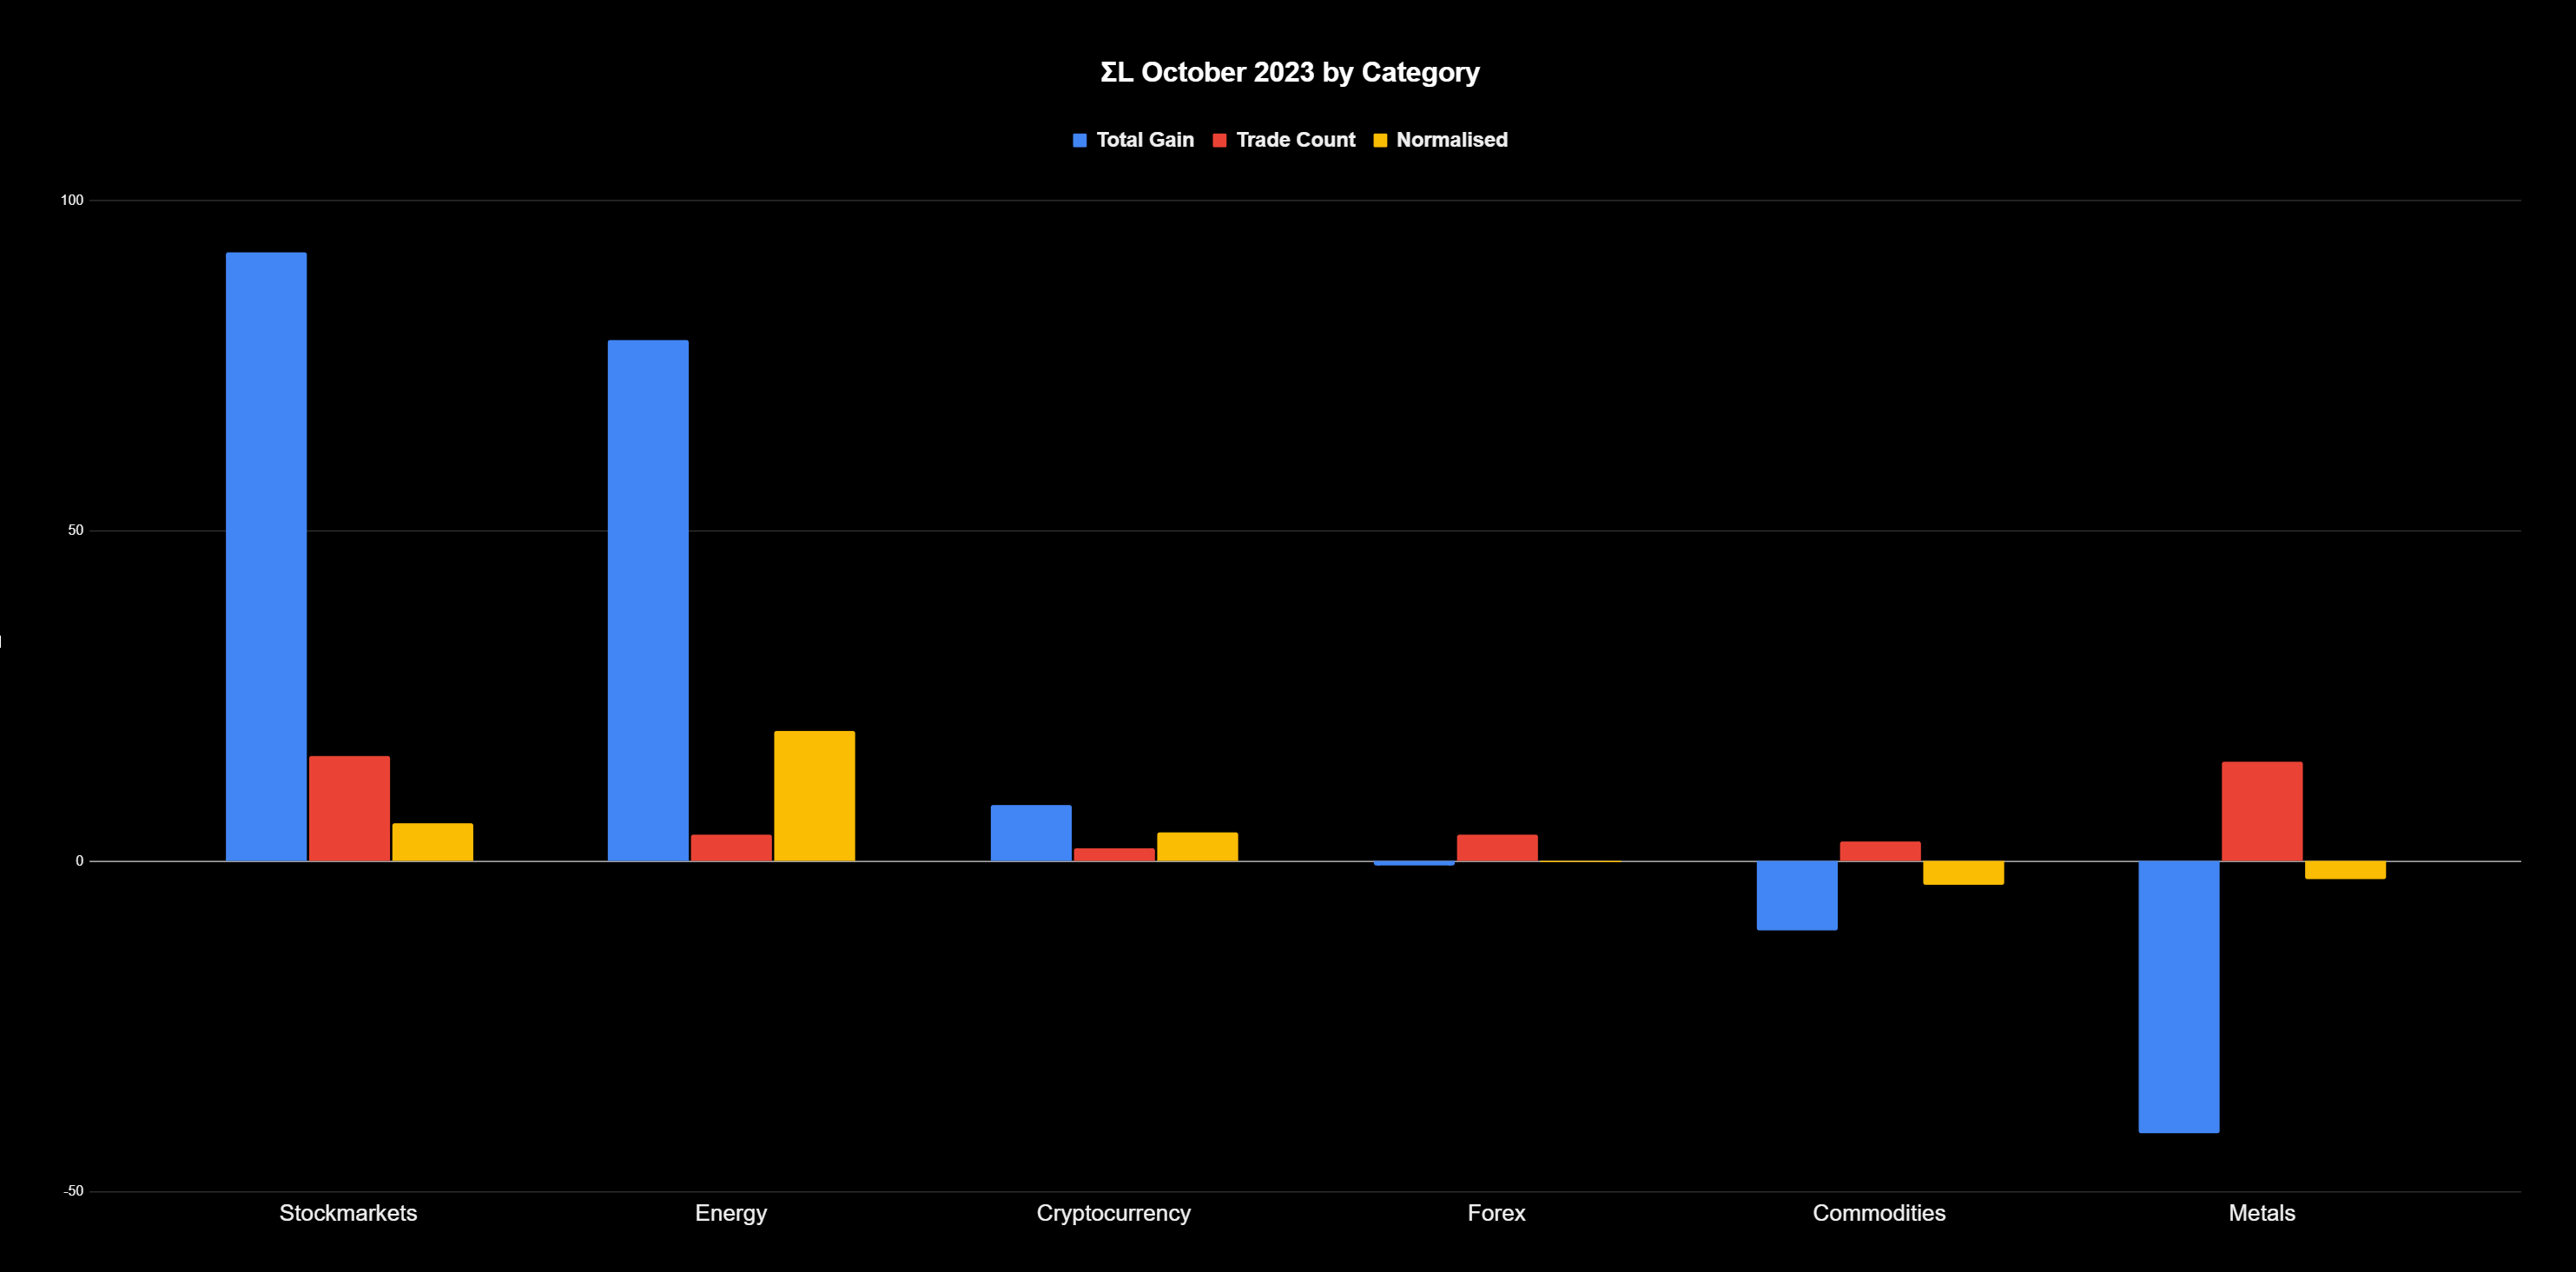
Breakdown by Direction & ΣL Category
Sell Side (Nominal)
Total Gain: 45.73% / Trade Count: 18 / Win:Loss Ratio: 8:1 (16:2)
Average Gain Per Trade: 2.54%
Win Percentage: 89%
Average Win: 4.85% / Average Loss: -15.95%
Average Duration: 52 Days
Biggest Win: 12.64% → Early Sell - PepsiCo 18th July 2023
Biggest Loss: -31.35% → Sell - Geiger Counter Ltd 4th August 2023
Buy Side (Nominal)
Total Gain: 81.86% / Trade Count: 26 / Win:Loss Ratio: 0.86:1 (12:14)
Average Gain Per Trade: 3.15%
Win Percentage: 86%
Average Win: 13.13% / Average Loss: -5.41%
Average Duration: 63 Days
Biggest Win: 64.18% → Buy - CBOE Volatility Index 15th September 2023
Biggest Loss: -17.79% → Buy - VanEck Junior Gold Miners ETF 25th July 2023Nominal / Normalised Gain By ΣL Category (Trade Count)
Stock Markets: 92.23% / 5.76% (16)
Energy: 78.92% / 19.73% (4)
Cryptocurrency: 8.58% / 4.29% (2)
Forex: -0.55% / -0.14% (4)
Commodities: -10.46% / -3.49% (3)
Metals: -41.13% / -2.74% (15)
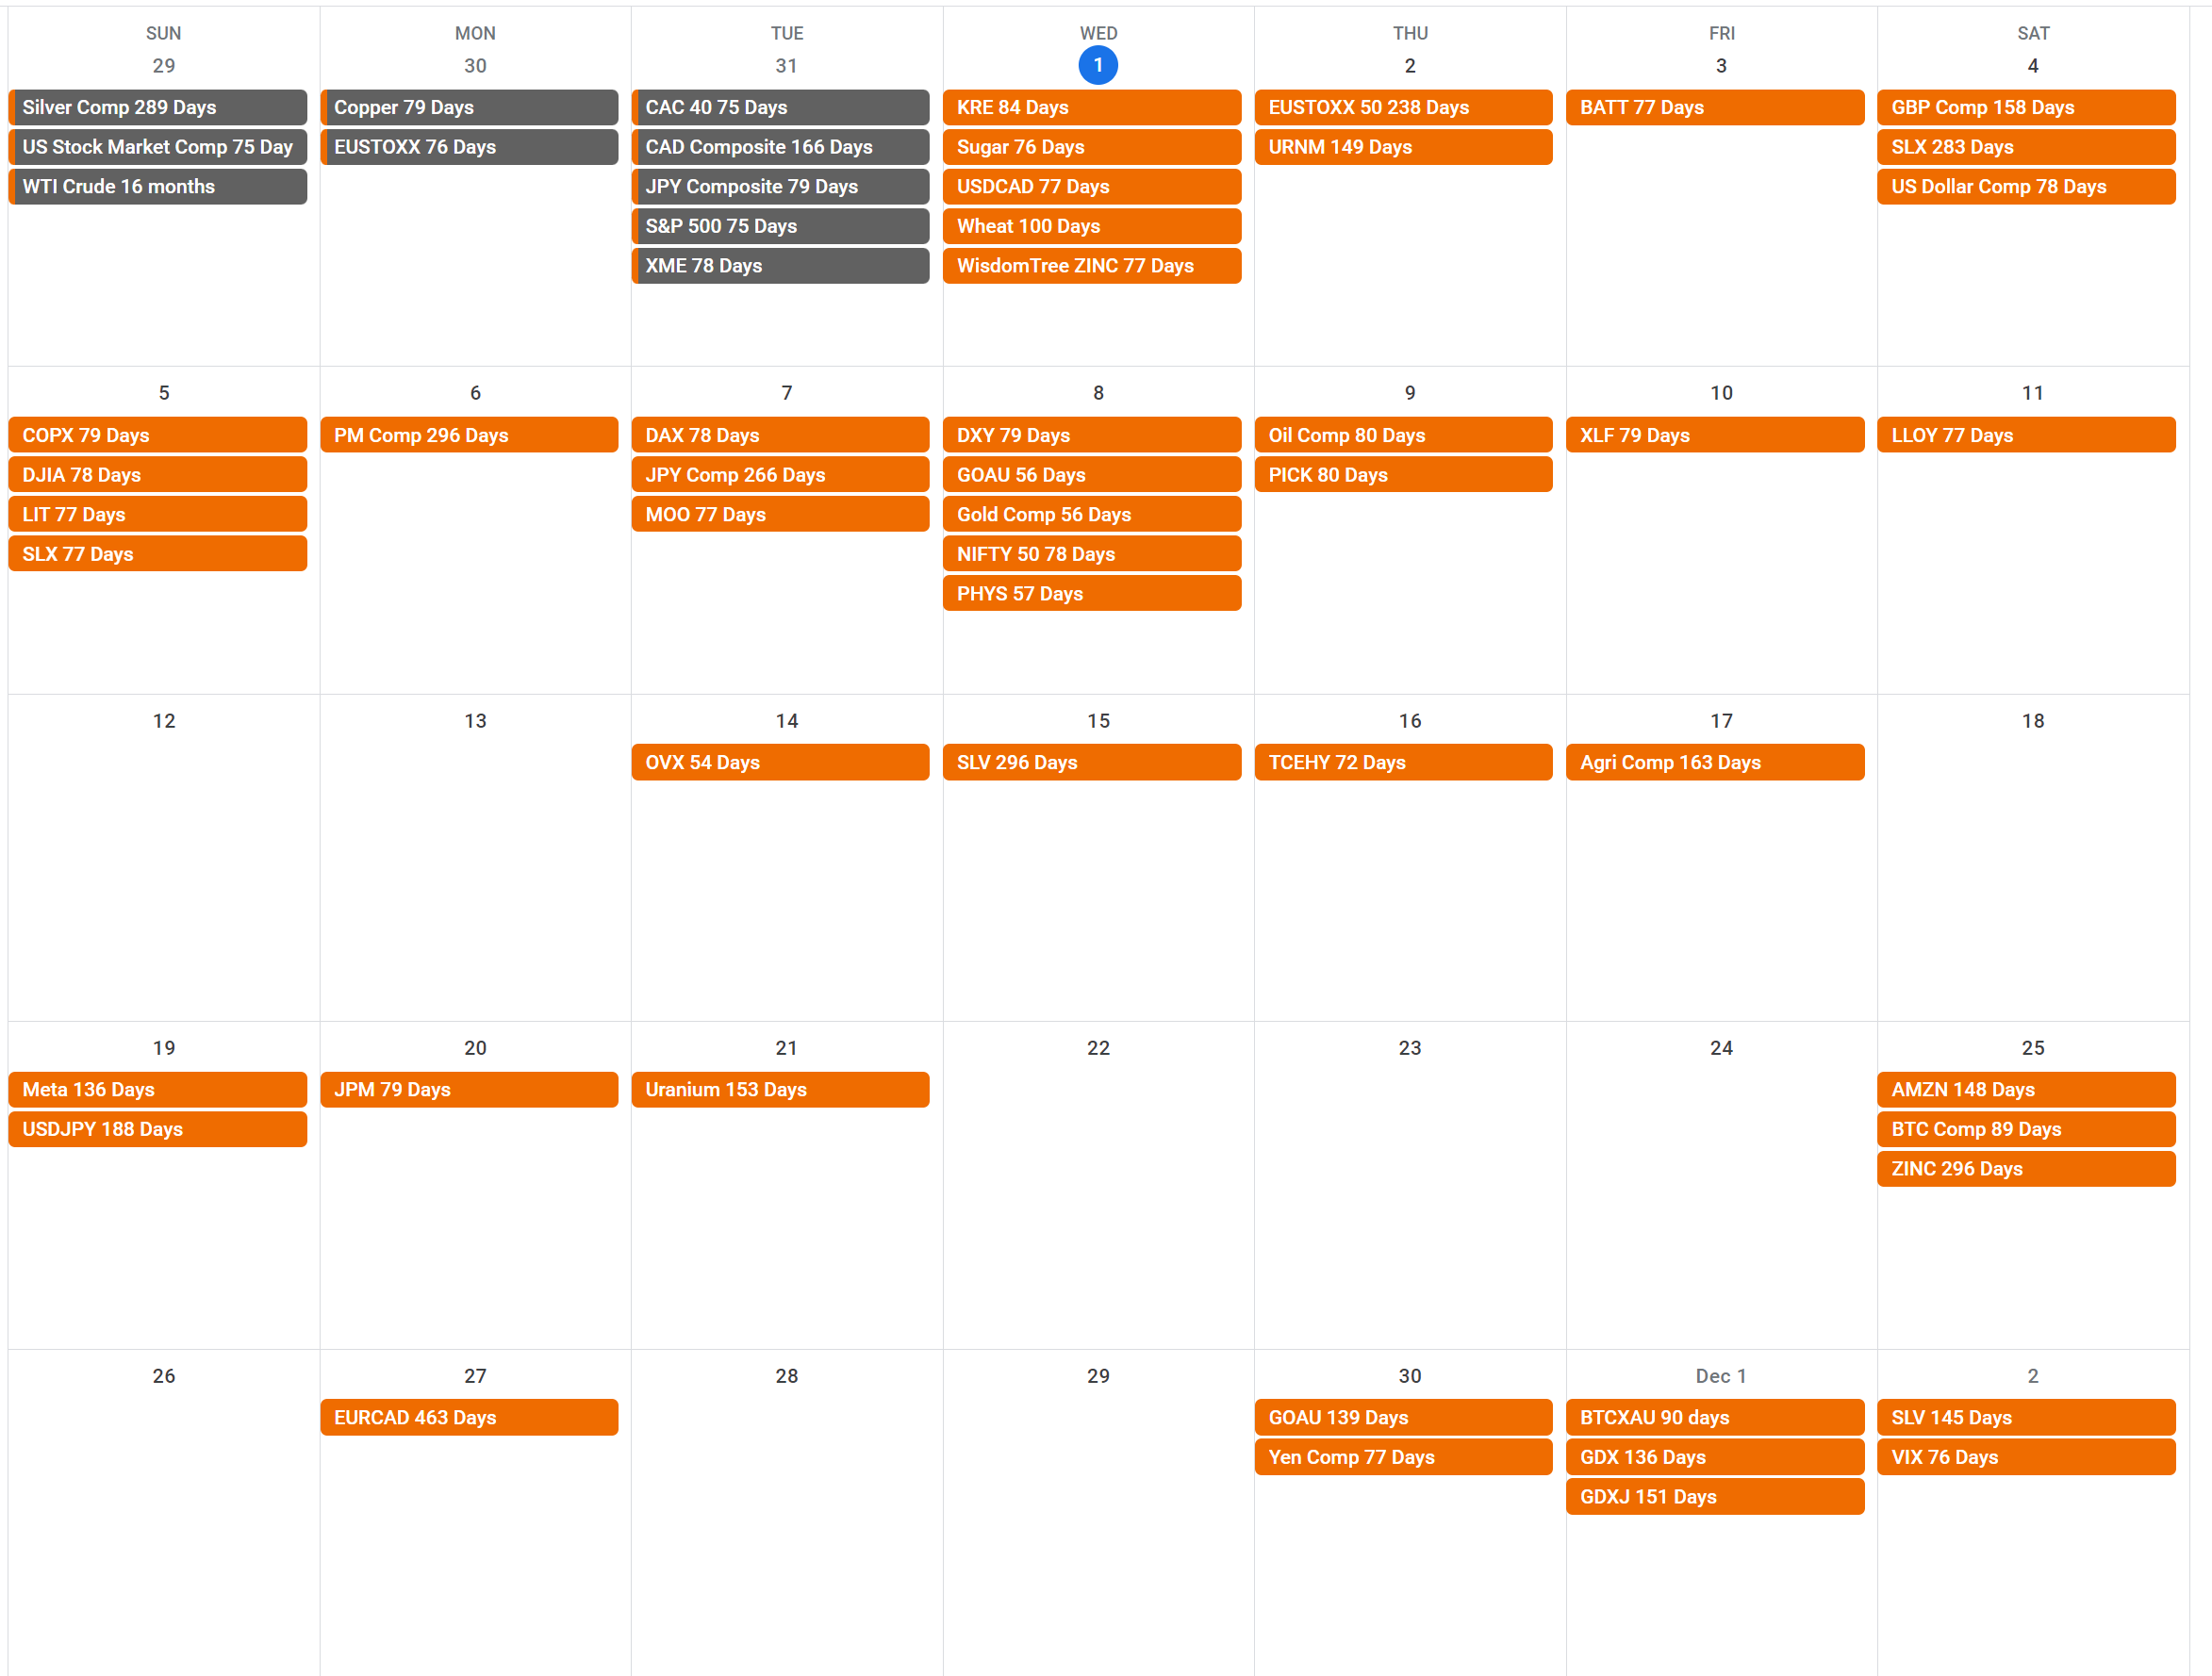
Dates for your Diary - November 2023
October 2023 Recap
Stock markets, energy and their derivatives dominated in October, being the main gainers in an overall steady month which yielded a 127.59% nominal gain. The ‘80 day nominal’ component has been highly profitable, not least in it’s inverted form via the CBOE volatility index, which is a superb signal. Metals dragged down the return, mostly due the hangover from Uranium via Geiger Counter Ltd, although this was offset with the beacon in Gold (and related) at around 55 days. No doubt once we lock back into the quite decent periodic wave in Uranium we will see excellent positive yields. I invite you to, once again, have a look at the ‘trade by trade’ Google sheets document linked in this article to explore the figures at your convenience.
Don’t Miss..
Wednesday 1st November - USDCAD 77 Days
Due for an update today, this is one of the best periodic signals in any market and a member of the wow! signals top 10. Superbly stationary and due a peak imminently.
Wednesday 1st November - Wisdom Tree ZINC 77 Days
Zinc has shown excellent periodicity via the proxy of this ETF. Due a bottom soon and due an update today, this is one to watch for metal investors.
Sunday 5th November - VanEck Steel ETF 77 Days
Rounding off the triad of 77 day waves listed here (!) is the excellent component in this steel proxy, SLX. Analysis also suggest a low is due in this wave.
Wednesday 8th November - ΣL Gold Composite 55 Days
The rocket ship move up from the low in early October was highly predictable with knowledge of this excellent wave around 55 days. All good things must come to an end though and this wave will look to peak in the next week or two. If amplitude is also maintained to the downside it could be a lucrative short. A flatter down-leg will suggest the larger waves are really starting to push up.
Thursday 9th November - ΣL Oil Composite 80 Days
Another excellent component which caught the majority of fintwit macro enthusiasts off guard in late September, with an easily discerned peak in price. Due to make it’s next low quite soon, it will be interesting to see how much power remains to the upside in the oil market whilst the larger wave (@ ~ 16.4 months) is peaking.


