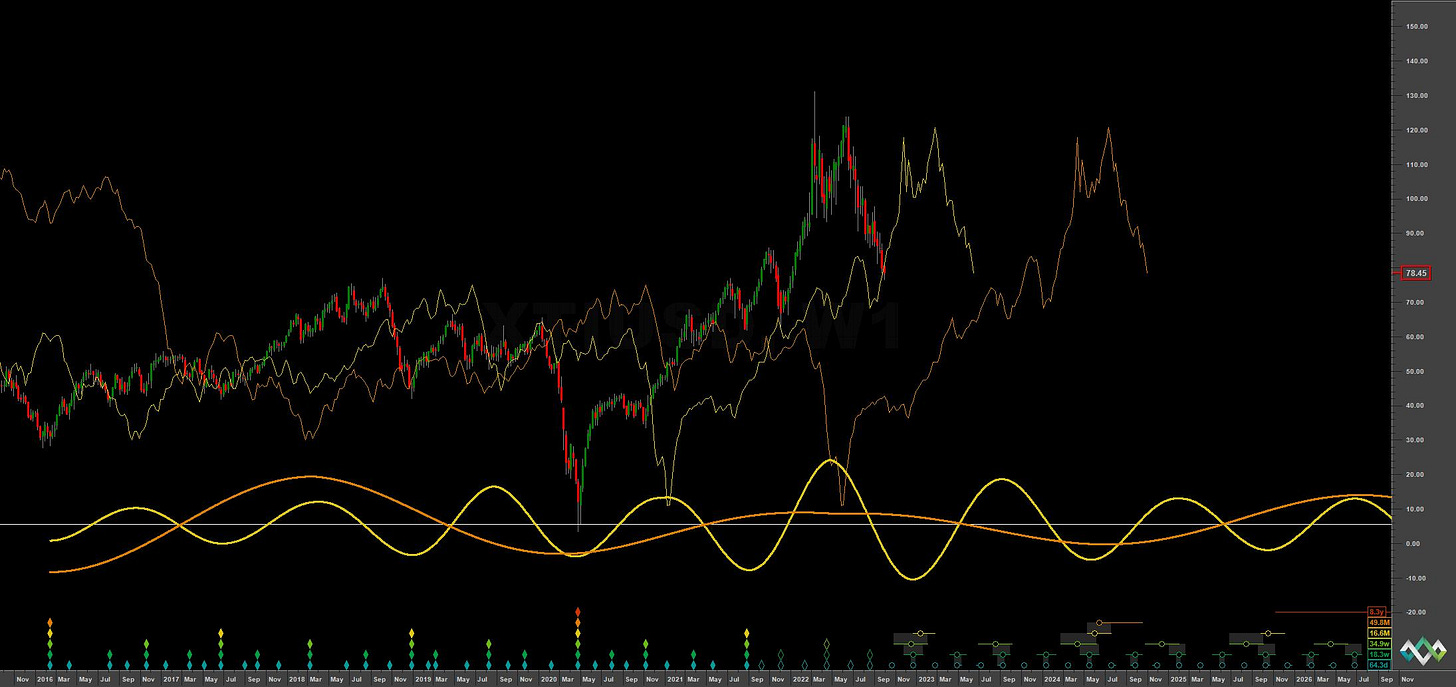
Oil: Hurst Cycles - 27th September 2022
A weak bounce from the 20 week nominal low, proposed to have occurred mid August, confirms the bearish outlook for Oil as we approach an 18 month nominal low later this year
Tools required: Nominal Model | FLD | FLD Trading Strategy | FLD Trading Strategy (Advanced) | Principle of Nominality | Underlying Trend
Analysis Summary
In our last report on WTI Crude we anticipated the trough of the 20 week nominal component (@ ~18.3 weeks). The bounce failed to interact with the 20 week FLD at the initial stages, emphasising the bearish underlying trend at work in the oil market, despite geopolitical ‘macro’ news. This has been established by the phase of the 4.5 year component, which likely peaked in early 2022 and is pushing down. The long term chart below shows the trough of this longer component is due early 2024.
The 20 week component has been fairly evident amongst the attenuating effects of a strong 18 month component, which last troughed in late 2021 and shown on the time frequency chart below. That is until the most recent trough, mid August, which has failed to provide much of a bounce, prior to collapsing past the low within the first 40 day component. This is typical of an accelerating underlying bearish (or bullish) trend midcycle where smaller components are ‘squashed’ (attenuated) by the power of the larger components.
Since financial market spectra generally follows a 1/F power rule (power decreases as frequency increases), when the larger periodic components are really motoring, not much can stop them!
Price is now likely at the trough of a 40 day nominal component and must really make some kind of interaction with the 20 week FLD prior to any more sharp falls. It is interesting to note that price is also sitting on the level of the 18 month FLD (yellow on long term chart). The target for the 18 month component trough would be significantly lower if price were to make the weekly cross here so a bounce may well be forthcoming.
The 18 month component is due to trough November-December 2022 and we will be able to pinpoint that low with more precision as we draw nearer. It would not be a surprise to see the low come in at the 54 month FLD support (orange on long term chart).
Note that if the peak of the 54 month nominal component in terms of price was indeed in early 2022, as mentioned above, it is almost exactly in line with the trough of the 54 month nominal FLD. This suggests a neutral sigma-l and a substantial retrace of the entire move from the 2020 low by 2024.
Phasing Analysis
Long Term
Components greater than and including the 18 month nominal cycle

Medium Term
Components less than and including the 18 month nominal cycle
Short Term
Components around the 80 day nominal cycle
Time Frequency
Wavelet convolution output targeting the 20 week nominal component
Trading Strategy
Interaction Status
Interactions and price in the FLD Trading Strategy (Advanced). This looks at an idealised 40 week cycle and an array of 3 FLD signal cycles. We apply the instrument’s phasing to the model and arrive at an overall summary for the interactions with the 20 day FLD, current and forthcoming.
Sigma-L recommendation: Risk Buy / Neutral
Entry: 10 Day FLD (risk on) / 20 Day FLD
Stop: Below proposed 40 day nominal low
Target: 85-90 (20 week FLD resistance)
Reference 20 Day FLD Interaction: E3
Underlying 40 Day FLD Status: B2-C2
Underlying 80 Day FLD Status: E
The underlying trend is bearish, as described above so interactions with smaller degree FLDs are skewed to the downside. That said, an interaction with the 20 week FLD (darker green on medium term charts) should be expected in the form of resistance in the area of 85-90. The low being approached here should be of at least 40 day magnitude. Traders may wish to await the short trade after the peak of this 40 day component, due early-mid October.
FLD Settings
If you do not have the use of Sentient Trader use these settings to plot FLDs in your trading software (daily scale) to more easily follow trading signals and strategy from Sigma-L.
Make sure to account for non-trading days if your broker omits them in the data feed (weekends, for example). The below offsets are given with no added calculation for non-trading days.
80 day nominal: 64.3 days | 32 day FLD offset
40 day nominal: 31.3 days | 16 day FLD offset
20 day nominal: 16.3 days | 8 day FLD offset
10 day nominal: 8.2 days | 4 day FLD offset
Correlated Exposure Options
A non exhaustive list of correlated instruments for consideration
United States Oil Fund LP USO 0.00%↑
Energy Select Sector SPDR Fund XLE 0.00%↑
ProShares Ultra Bloomberg Crude Oil UCO 0.00%↑
Invesco DB Oil Fund DBO 0.00%↑
United States 12 Month Oil Fund LP USL 0.00%↑
ProShares K-1 Free Crude Oil Strategy ETF OILK 0.00%↑
MicroSectors Oil & Gas Exp. & Prod. 3x Leveraged ETN OILU 0.00%↑
MicroSectors Oil & Gas Exp. & Prod. -3x Inverse Leveraged ETN OILD 0.00%↑
United States Brent Oil Fund BNO 0.00%↑
iPath Pure Beta Crude Oil ETN OIL 0.00%↑


