Oil: Hurst Cycles - 2nd January 2023
After making the 80 day nominal low around the 9th of December, WTI Crude is approaching the 40 day nominal peak. This is a potential short for the 18 month component low, phased to come mid February
Essentials: Nominal Model | FLD | FLD Trading Strategy | FLD Trading Strategy (Advanced) | Principle of Nominality | Underlying Trend | Time Frequency Analysis
Analysis Summary
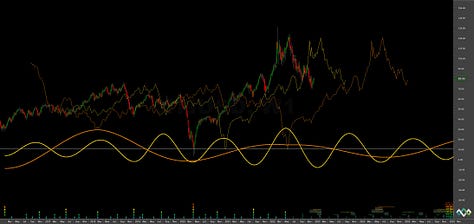
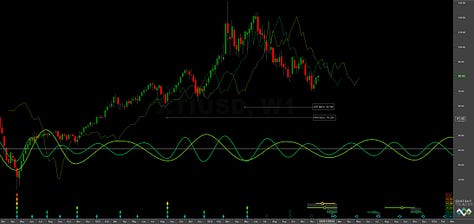
We delayed our report into WTI crude (and related) from mid December to now in order to allow the most recent 80 day component to progress, prior to a useful point for analysis and trading. The longer phasing is anticipating a trough of the 18 month component shortly and the main point of the analysis in this report is to examine the path toward it - or indeed if it has already occurred 9th December (outlier).
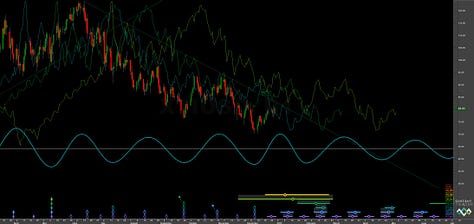
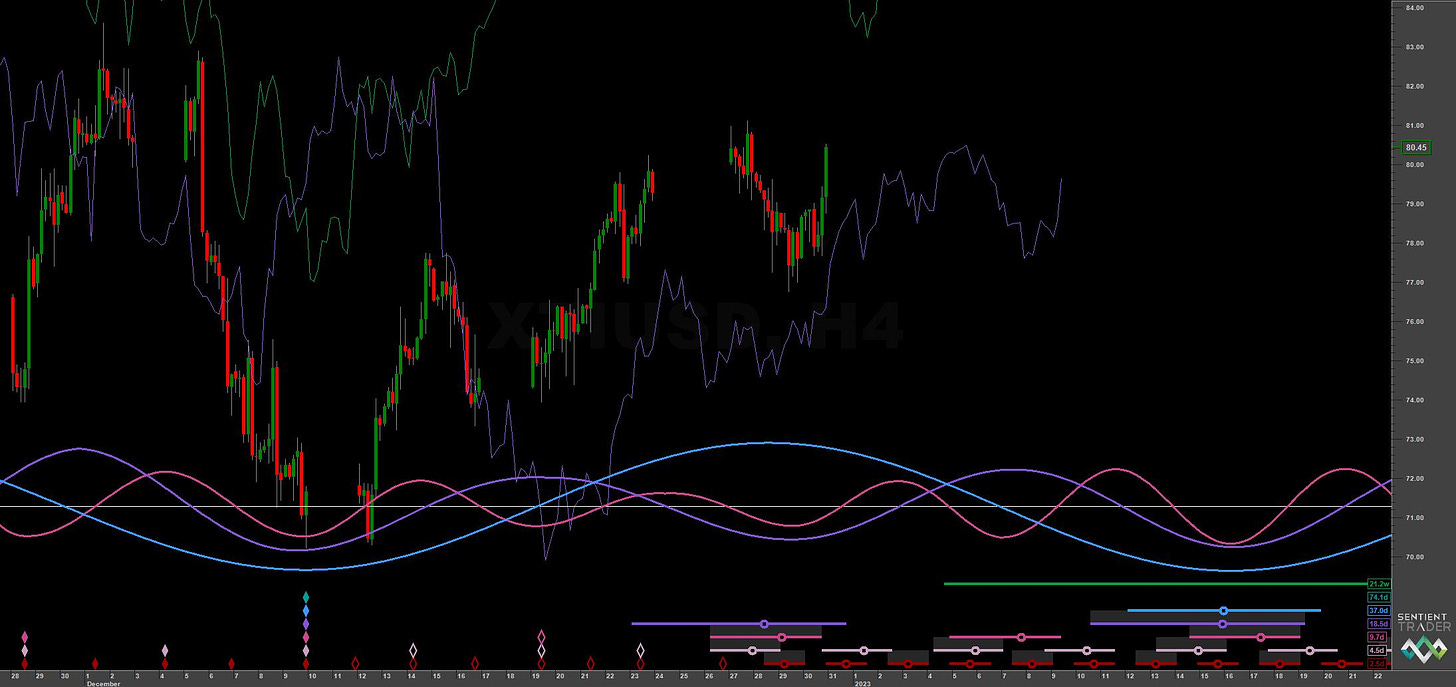
Price is currently at the 80 day FLD resistance and, if the longer phasing is accurate, should find some difficulty here. Should the 18 month component have occurred, price should continue to be bullish and breach the 80 day FLD convincingly, progressing up to the 20 week FLD resistance. This is shown on the Sentient Trader charts below. Our main scenario is the former and more details on entry can be found in the trading strategy section.
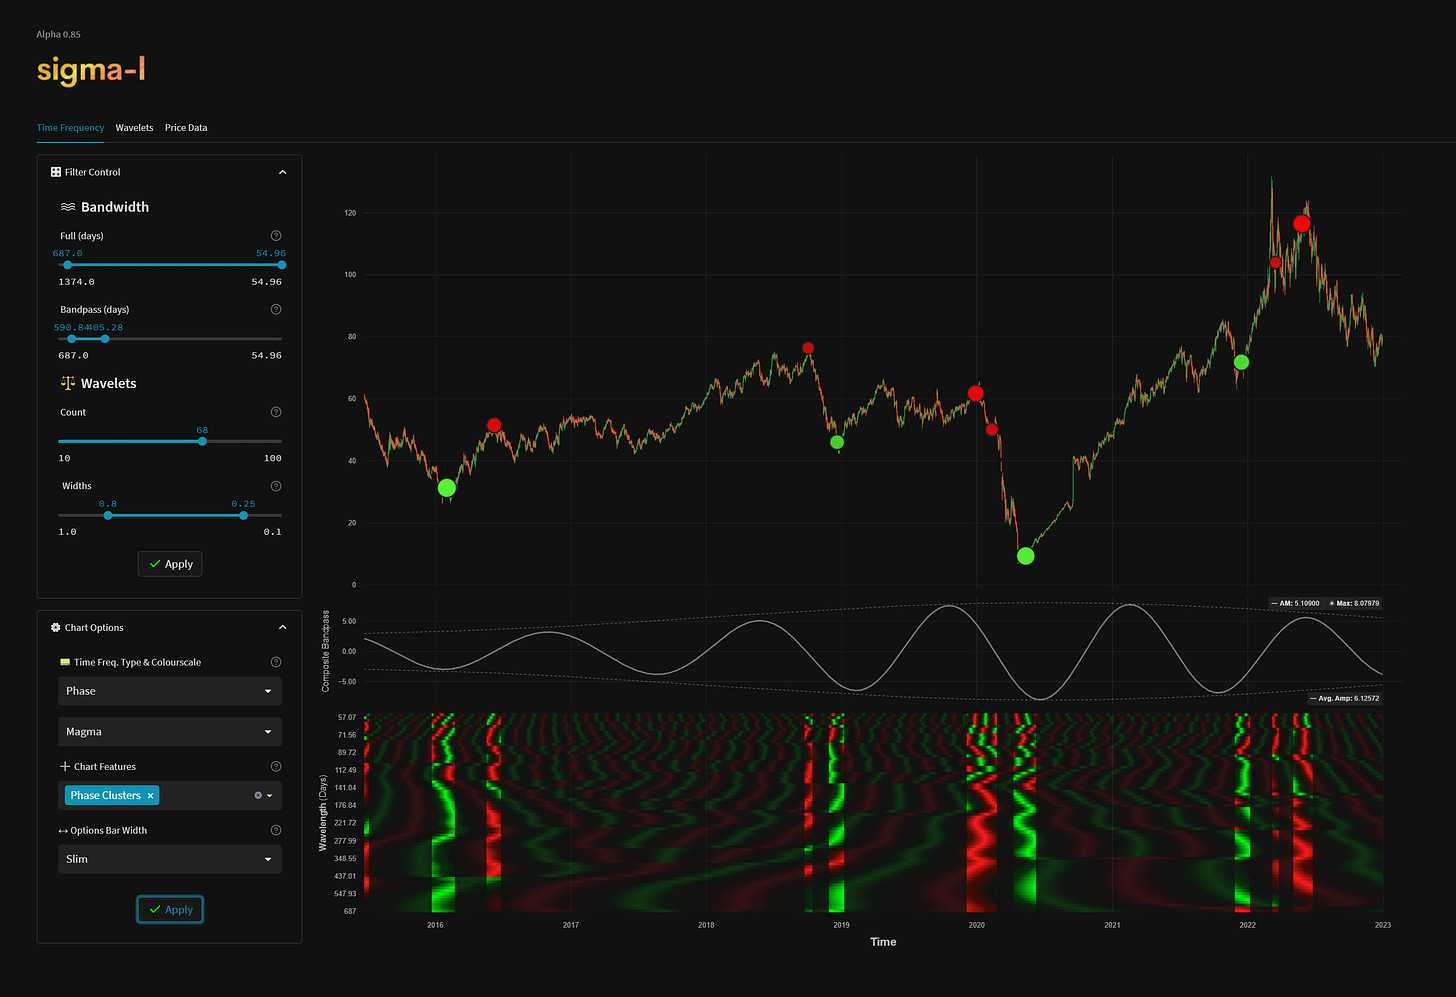
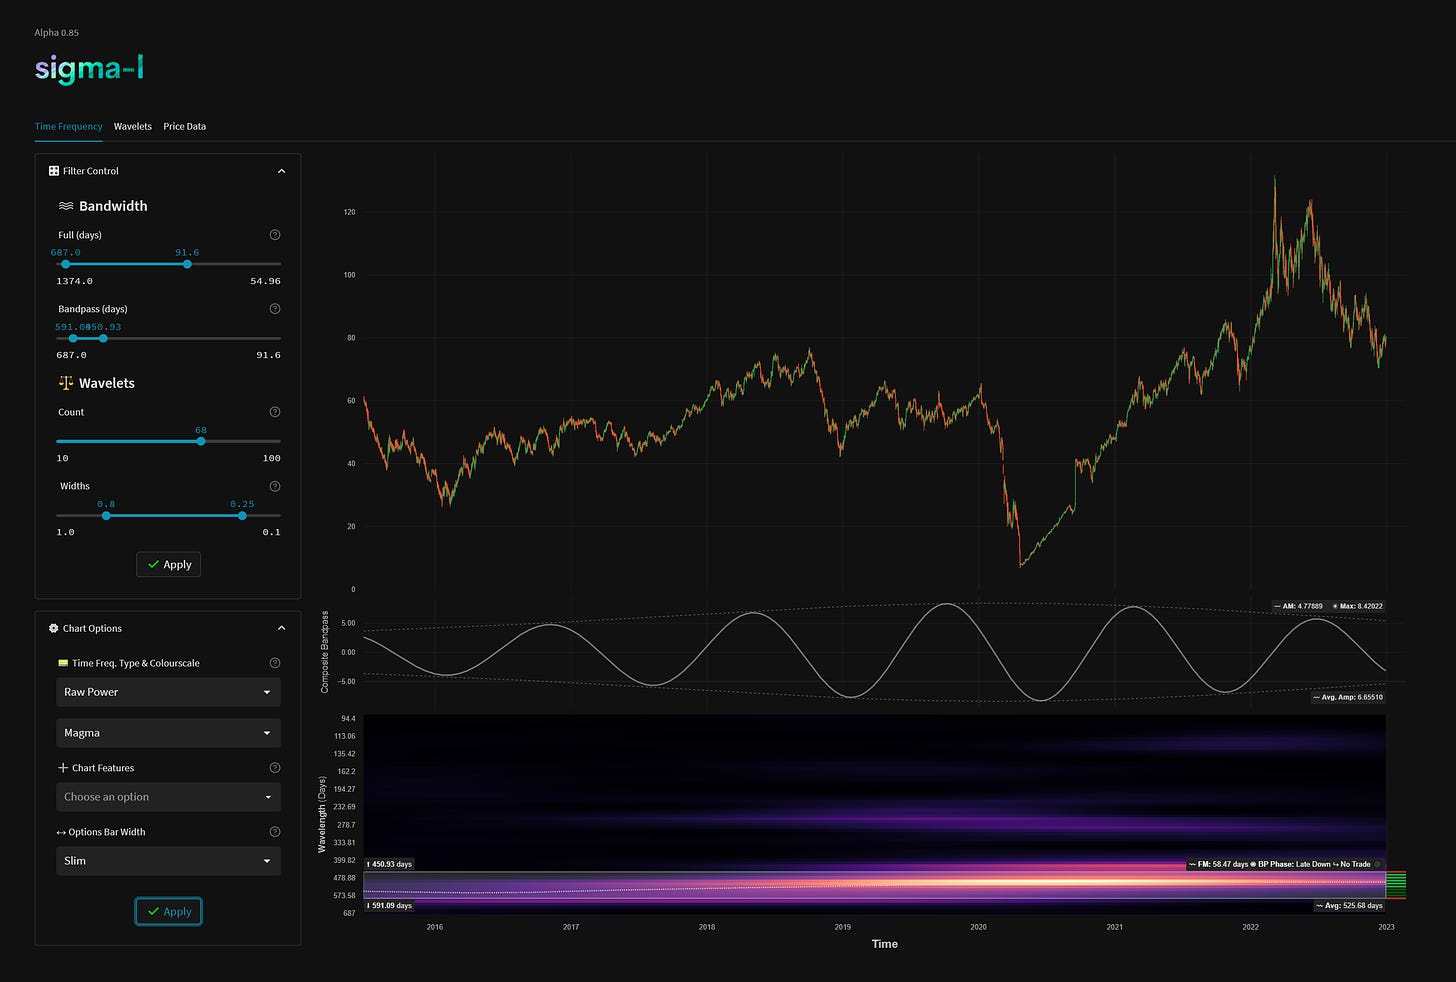
The 18 month component is, according to Sentient Trader at least, running at an average of 16.6 months over 4 iterations from the sample and is currently at a phase of 15.6 months. Time frequency analysis places the component around 17.3 months with an average frequency modulation of around 58 days. We would expect to see some phase clusters forming around the 18 month component low and we don’t see that as yet. Phase clustering indicates several components (assumed to be periodic) across the frequency range making their lows synchronously. This typically happens at larger degree lows, as shown below with a sweep from 687 days to 55 days where all but 1 of the 18 month component lows flag a phase cluster detection in the region of the component low timeframe.
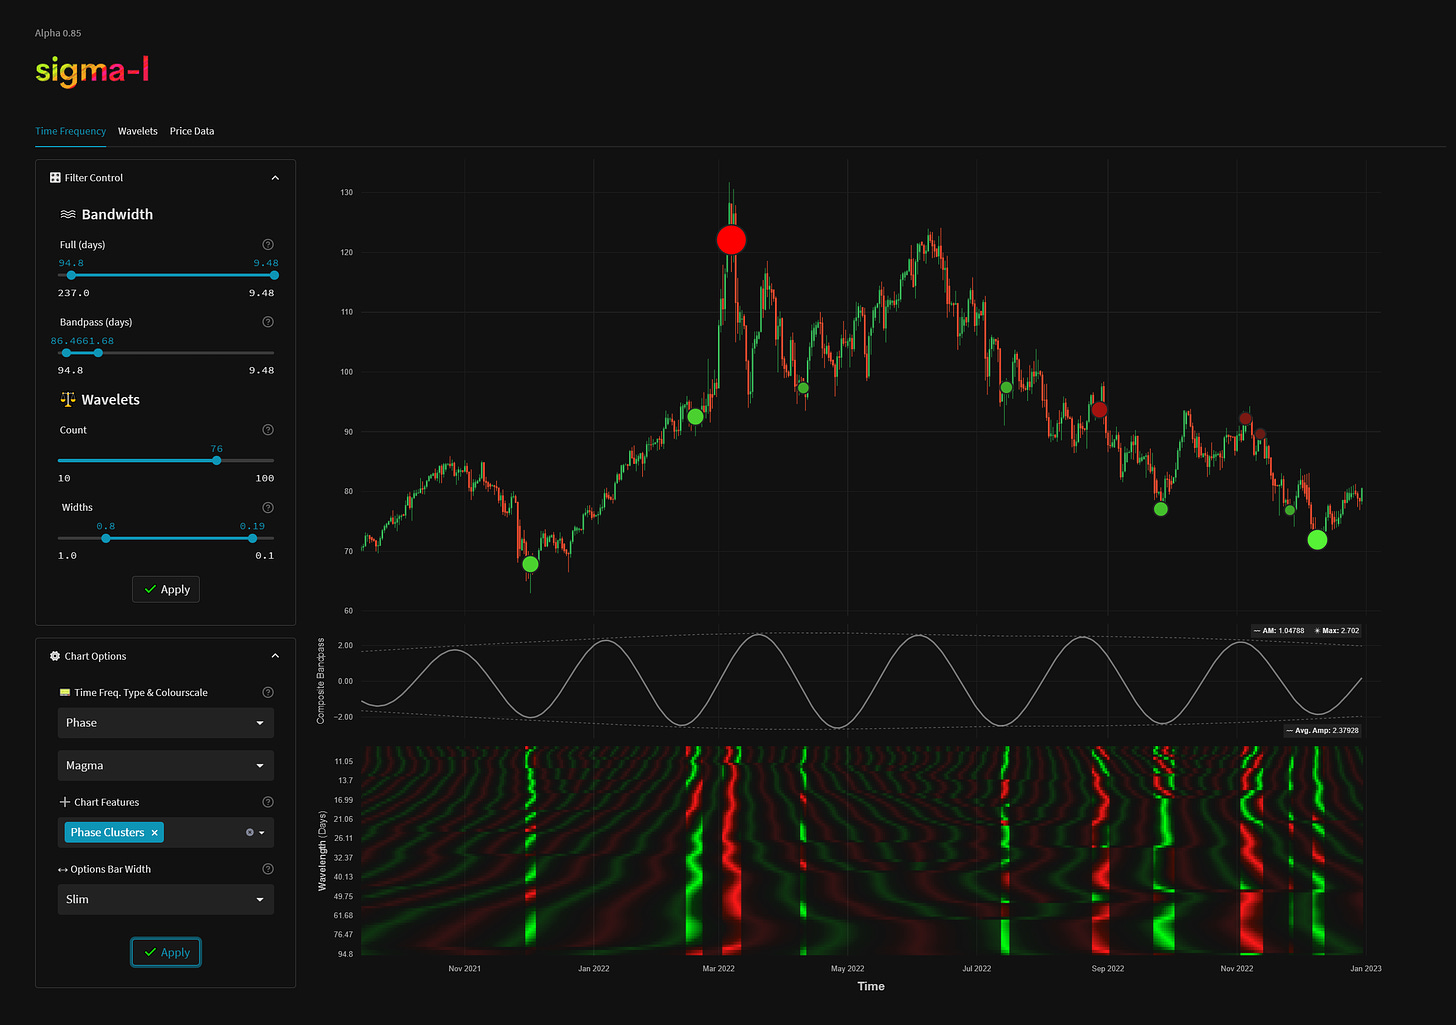
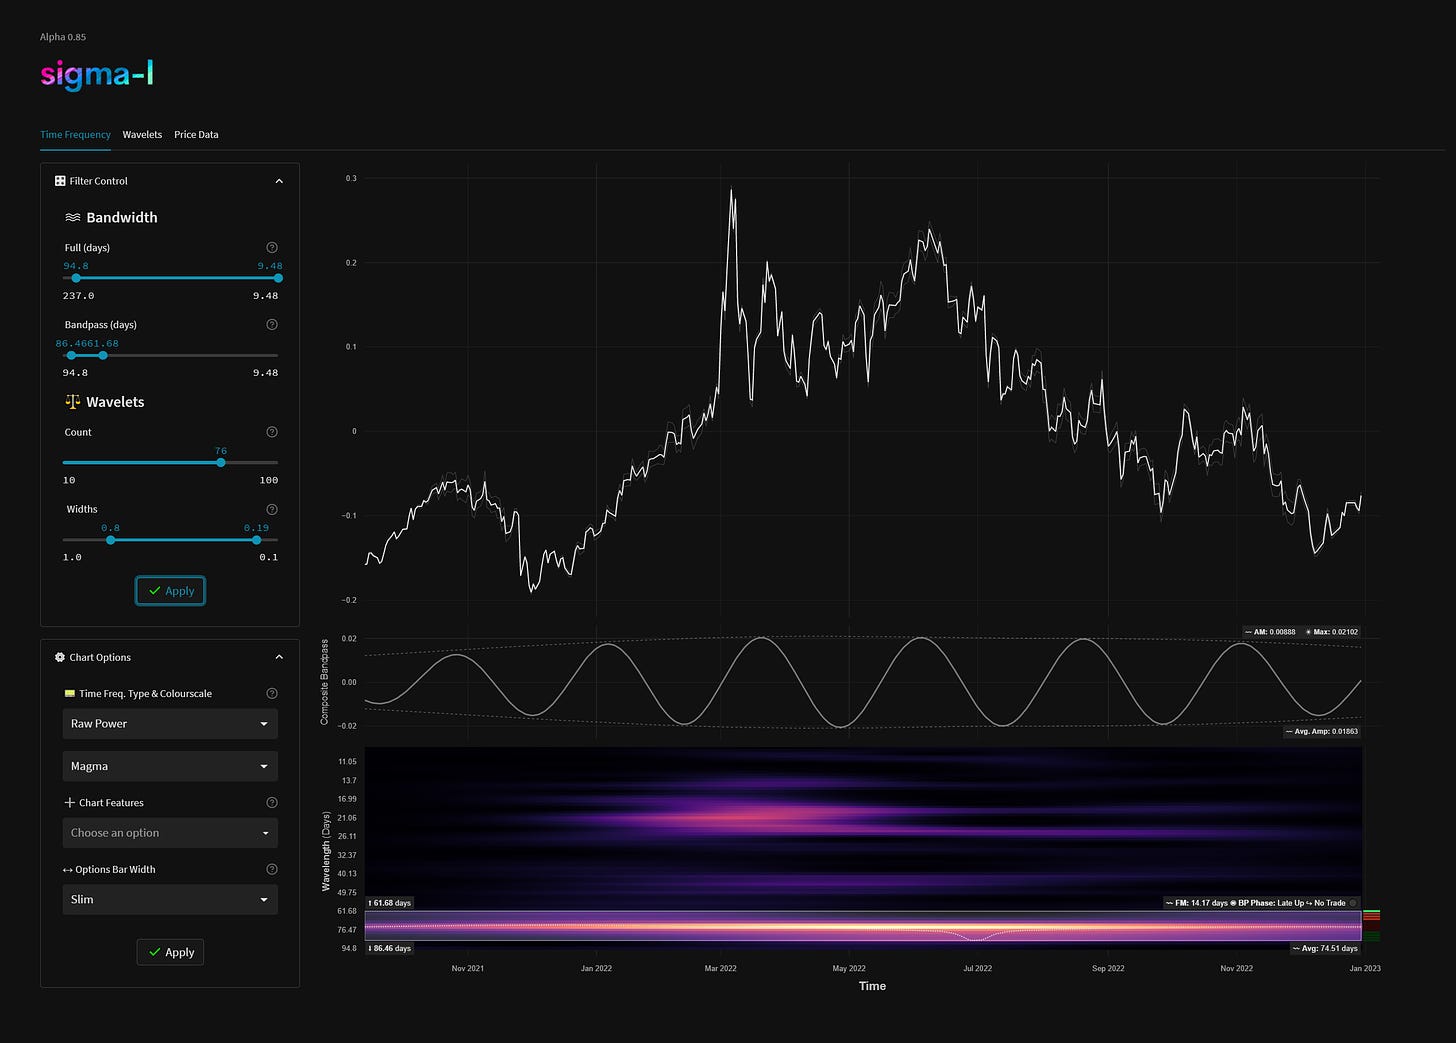
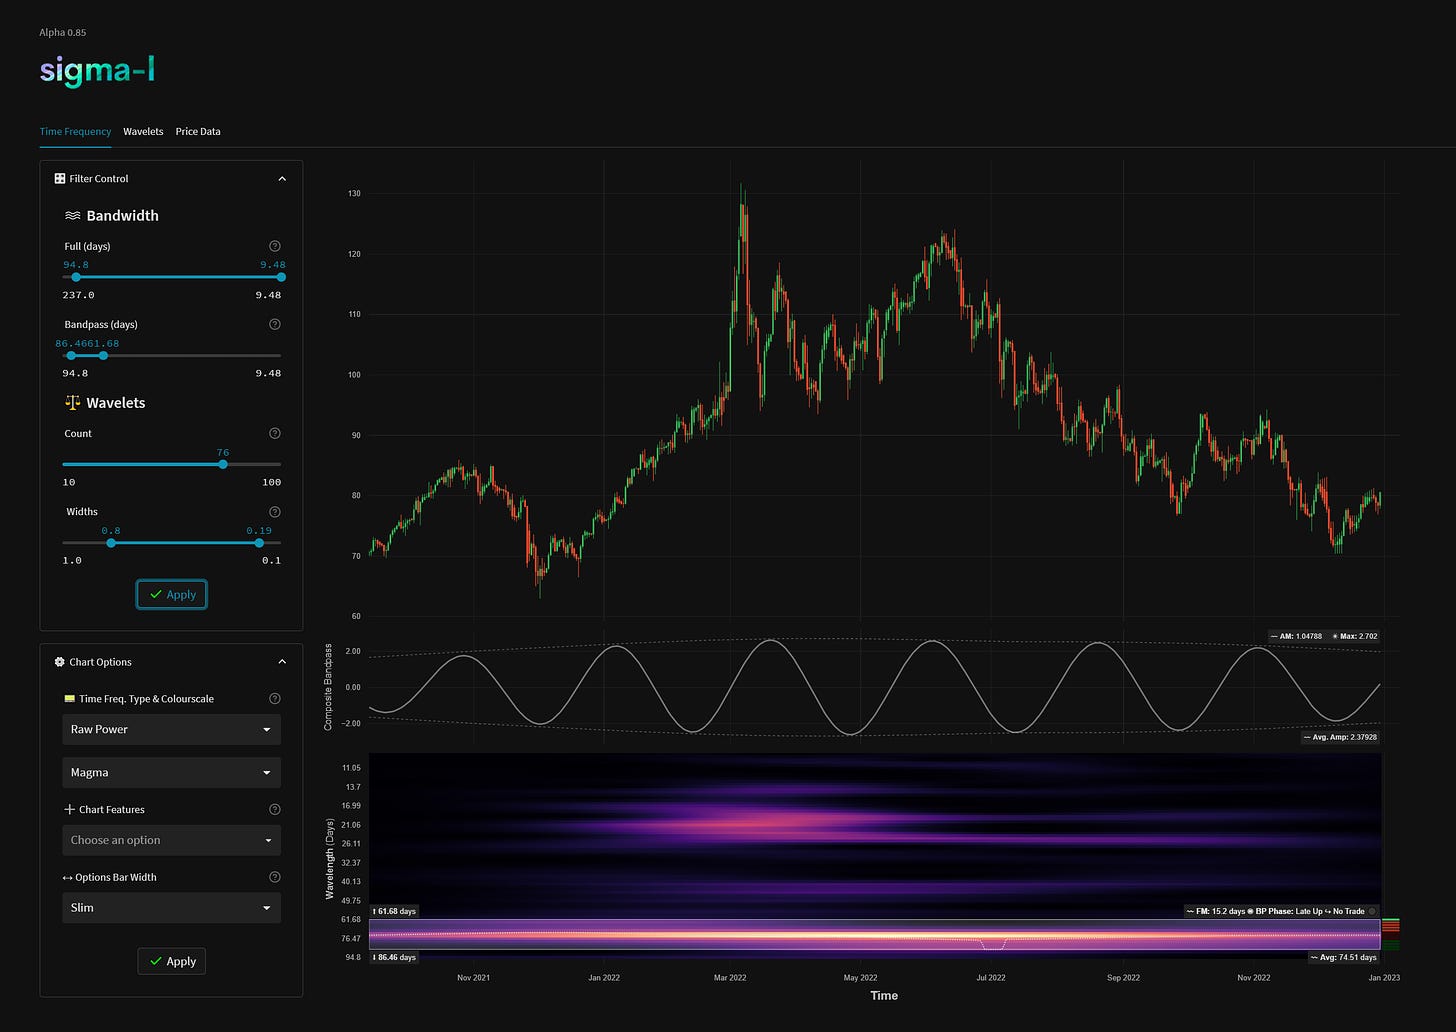
At the shorter time frame the 80 day nominal is fairly clear. The wavelength is steady around 70-76 days via both Sentient Trader and a time frequency analysis. Phase clusters are coherent for this component and we should expect an early peak (very soon), should the longer phasing be correct. This would be similar to the previous 80 day component which peaked early on 10th October prior to selling off.
Phasing Analysis
Sentient Trader
Utilising a pattern recognition algorithm and Hurst’s diamond notation
Time Frequency Analysis
Wavelet convolution targeting the 18 month and 80 day nominal components
Trading Strategy
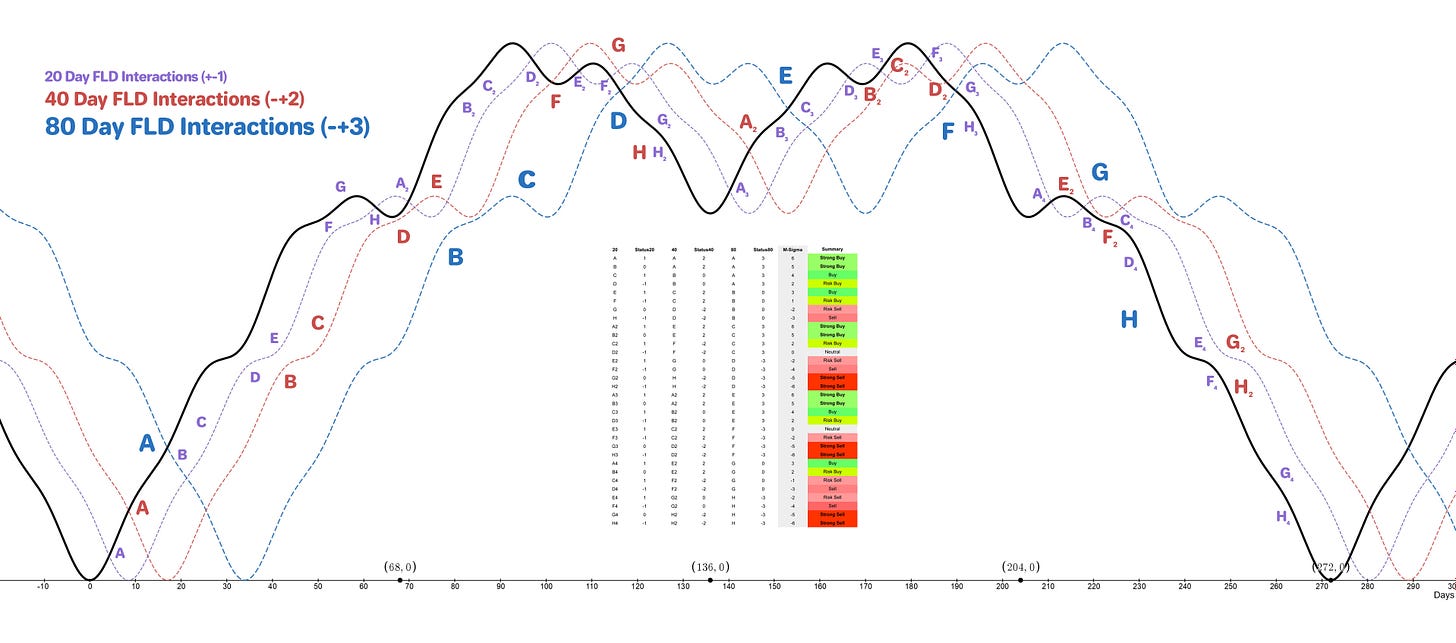
Interaction Status
Interactions and price in the FLD Trading Strategy (Advanced). This looks at an idealised 40 week cycle and an array of 3 FLD signal cycles. We apply the instrument’s phasing to the model and arrive at an overall summary for the interactions with the 20 day FLD, current and forthcoming.
Sigma-L recommendation: Sell
Entry: 20 Day VTL / FLD
Stop: Above formed 40 day component peak
Target: 55-60 (54 month FLD support), see last report
Reference 20 Day FLD Interaction: D4
Underlying 40 Day FLD Status: F2
Underlying 80 Day FLD Status: G-H
Above references are given assuming that the 18 month component low is still to come early February. The 18 month FLD target is way down at 34 and unlikely to be achieved as alluded to in previous reports. A more likely target is the 54 month FLD support around 60.
Price has recently most likely made the 20 day nominal low, which is the first iteration of it since the 80 day component trough, formed early December. A 20 day VTL can be drawn across the lows for an entry short in addition to the standard 20 day FLD entry, shown below at the 4 hour scale.
Should the 18 month nominal low have also formed at the recent 80 day component low, price action will likely form a more bullish shape and a higher low in early February. This is the outlier scenario at the moment but entirely possible.
In both scenarios the low in early February will be a strong buy according to the current phasing. Watch price action closely into the 40 day nominal low coming up mid January.
FLD Settings
If you do not have the use of Sentient Trader use these settings to plot common FLDs in your trading software (daily scale) to more easily follow trading signals and strategy from Sigma-L.
Make sure to account for non-trading days if your broker omits them in the data feed (weekends, for example). The below offsets are given with no added calculation for non-trading days.
80 day nominal: 71.8 days | 36 day FLD offset
40 day nominal: 35.3 days | 18 day FLD offset
20 day nominal: 17.5 days | 9 day FLD offset
10 day nominal: 8.8 days | 4 day FLD offset
Correlated Exposure
A non exhaustive list of correlated instruments for consideration
United States Oil Fund LP $USO Energy Select Sector SPDR Fund XLE 0.00%↑
ProShares Ultra Bloomberg Crude Oil UCO 0.00%↑
Invesco DB Oil Fund DBO 0.00%↑
United States 12 Month Oil Fund LP USL 0.00%↑
ProShares K-1 Free Crude Oil Strategy ETF OILK 0.00%↑
MicroSectors Oil & Gas Exp. & Prod. 3x Leveraged ETN OILU 0.00%↑
MicroSectors Oil & Gas Exp. & Prod. -3x Inverse Leveraged ETN OILD 0.00%↑
United States Brent Oil Fund BNO 0.00%↑
iPath Pure Beta Crude Oil ETN OIL 0.00%↑


No matter how hard I try to adjust my phasing, my cycle counts and bandpass filtering shows the 18M trough forming at the following 20W trough (14th July 23) not the next 20W trough as you've shown above. I'm assuming you've based this decision on your TFA, and see that it's showing a clear 18M trough forming around the 22nd Feb. Is the later alignment a possibility you've considered David?
Great write up, new member here and learning Hurst. This lined up perfectly with my traditional technical analysis. Got fills yesterday and playing out beautifully so far. Will there be an update on any of the indexes soon? Thanks