Oil: Hurst Cycles - 4th November 2022
Price rises with support from the 18 month FLD to approach our target of around 95. A crucial peak is near with a lucrative short on offer over the next few months.
Tools required: Nominal Model | FLD | FLD Trading Strategy | FLD Trading Strategy (Advanced) | Principle of Nominality | Underlying Trend
Analysis Summary
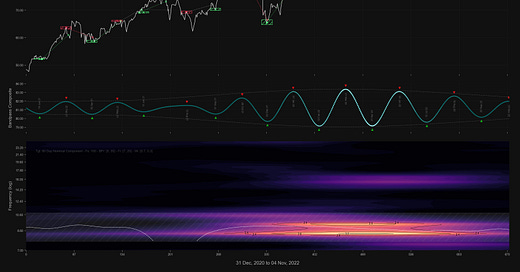
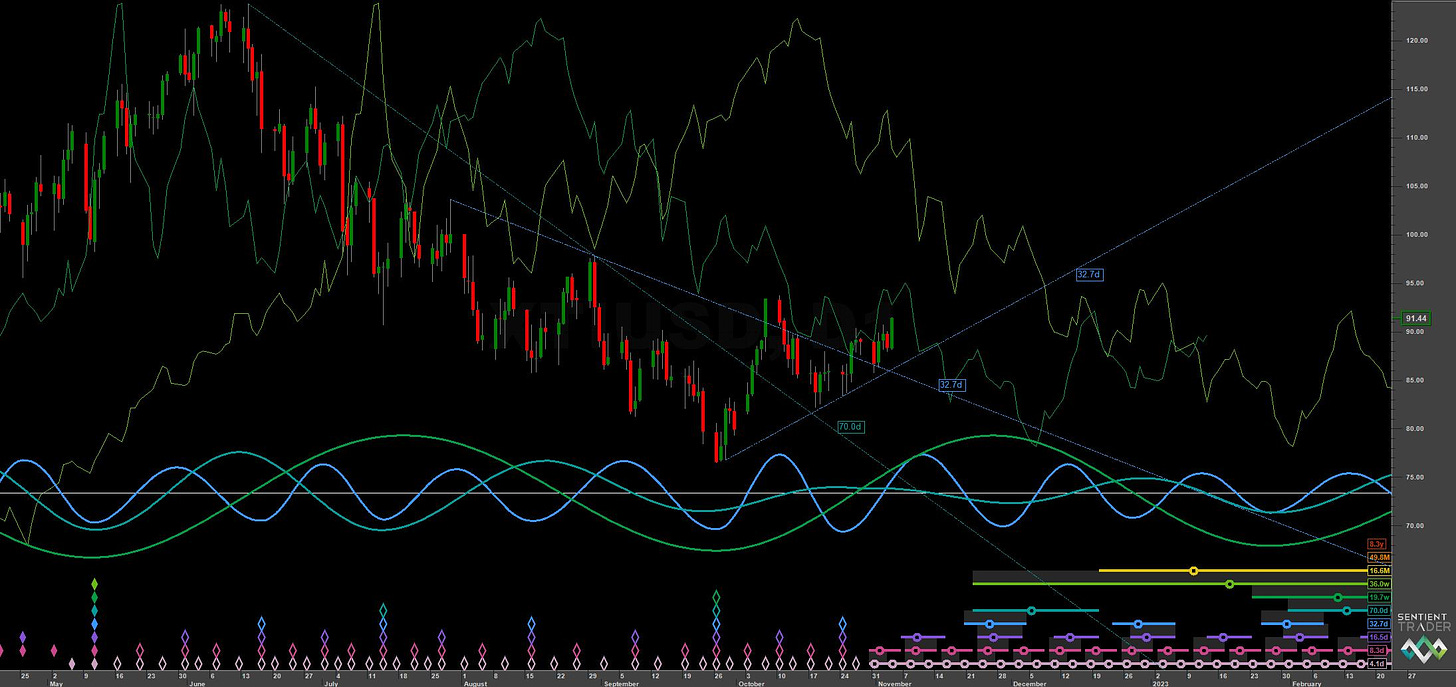
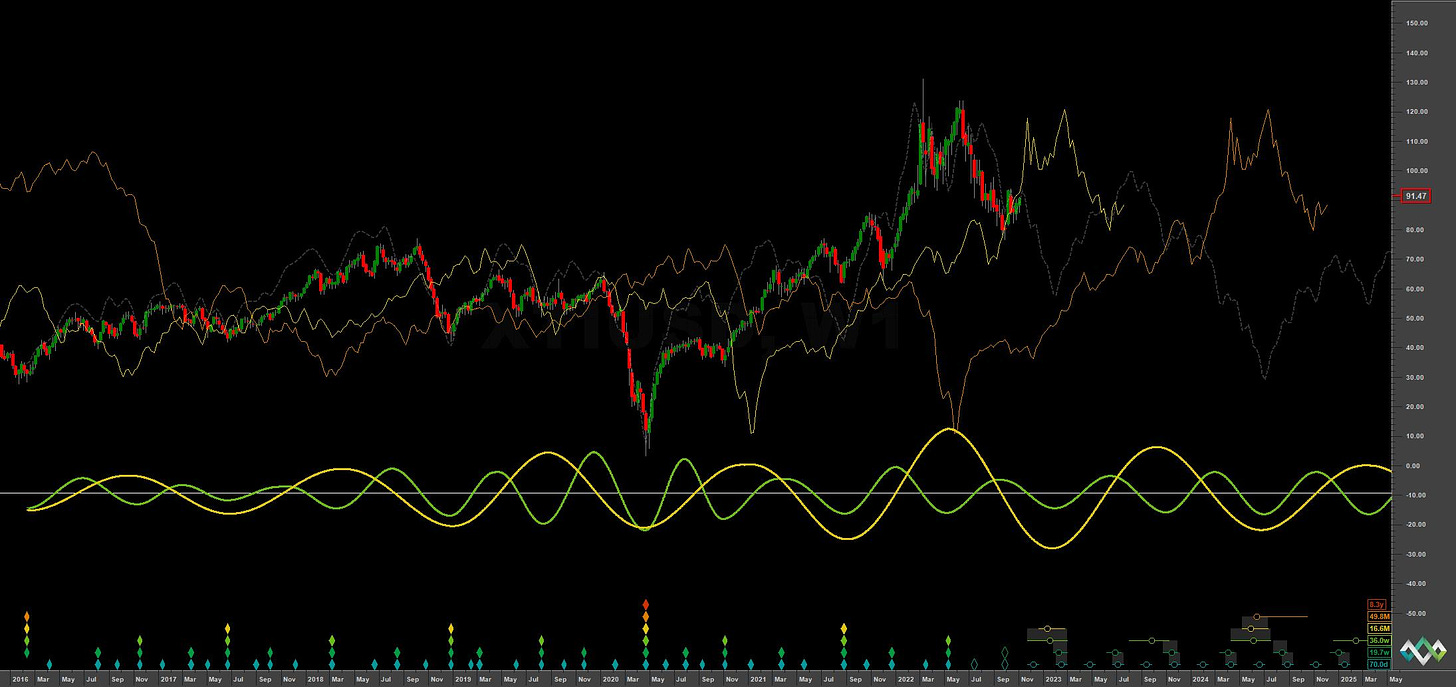
WTI Crude is likely forming it’s latest 80 day component peak shortly and with it, possibly the 20 week nominal component peak. In our last report we anticipated a 40 day nominal low and proposed a target of around 95, reaching resistance at the 20 week FLD. We can expect price to reach a little further than the current position at the time of writing but it is in the zone for a what could be a crucial bearish reversal over the next couple of weeks. The 20 week FLD (green, medium and short term chart) is likely to be tracked all the way down to the end of November, should the phasing be accurate.
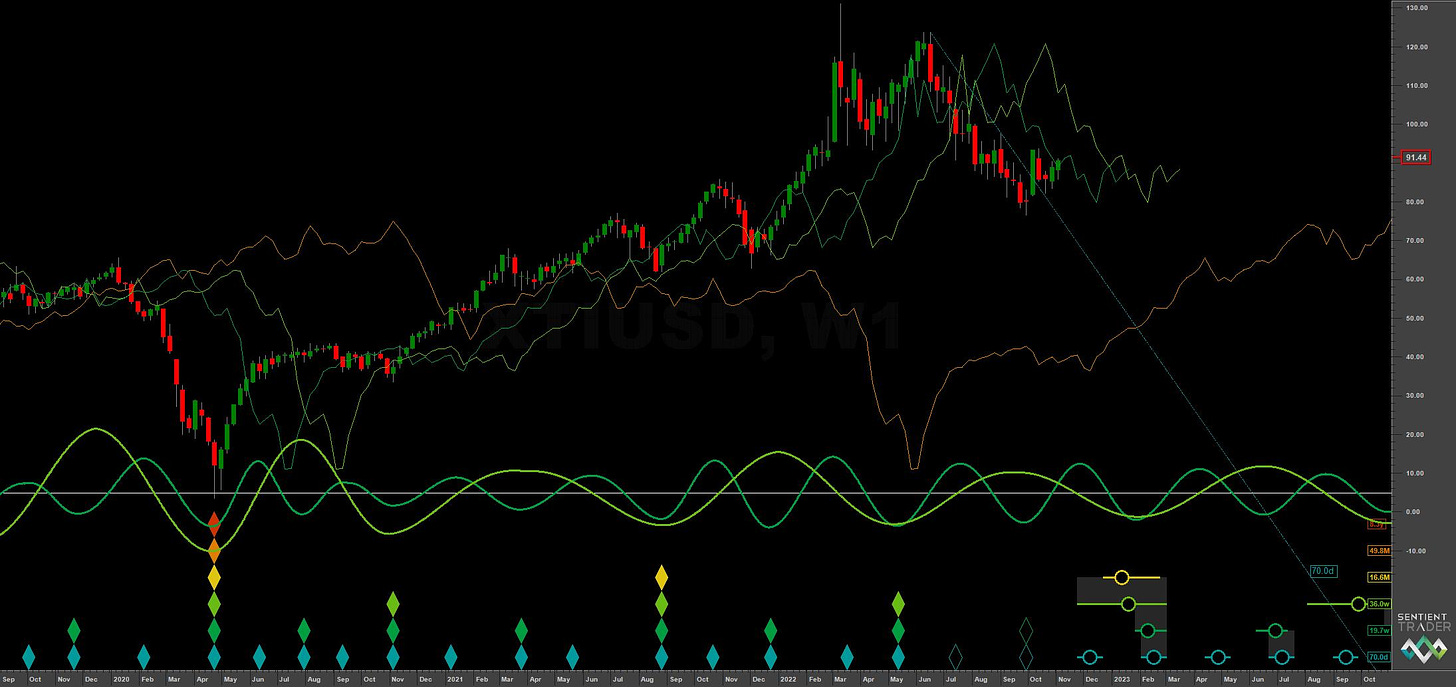
We have mentioned previously that compelling support at FLDs is a sign of a accurate phasing and in WTI Crude we have price straddling the 18 month FLD over the last few weeks (yellow on long term chart). This is a typical sight for Hurstonians and is indicative of a pause zone prior to continuation of a trend.
The price target for the downside is not yet established but it will likely correlate with support at the 54 month FLD down at 50-60. The 18 month component low is likely to occur toward the end of January 2023, given current wavelengths. We have included the composite model line on the long term chart to reflect what we see as a fairly accurate extrapolation of the price action. The average wavelength of the 18 month component, according to Sentient Trader at least, is 16.6 months. Assuming the previous trough of this component occurred in August 2021, we are 14.4 months along in it’s progress. A placement of the 18 month nominal low in December 2021 (outlier possibility) places the progress at only 48 weeks.
Of course within the larger move are the smaller components, the amplitude of which will be reflected in up and down short term movements of price. The 80 day component is due to trough at the end of November which should give a short bounce. Subsequently, toward the end of the year, price should start to make it’s move to the proposed 18 month nominal low.
Phasing Analysis
Long Term
Components greater than and including the 18 month nominal cycle
Medium Term
Components less than and including the 18 month nominal cycle
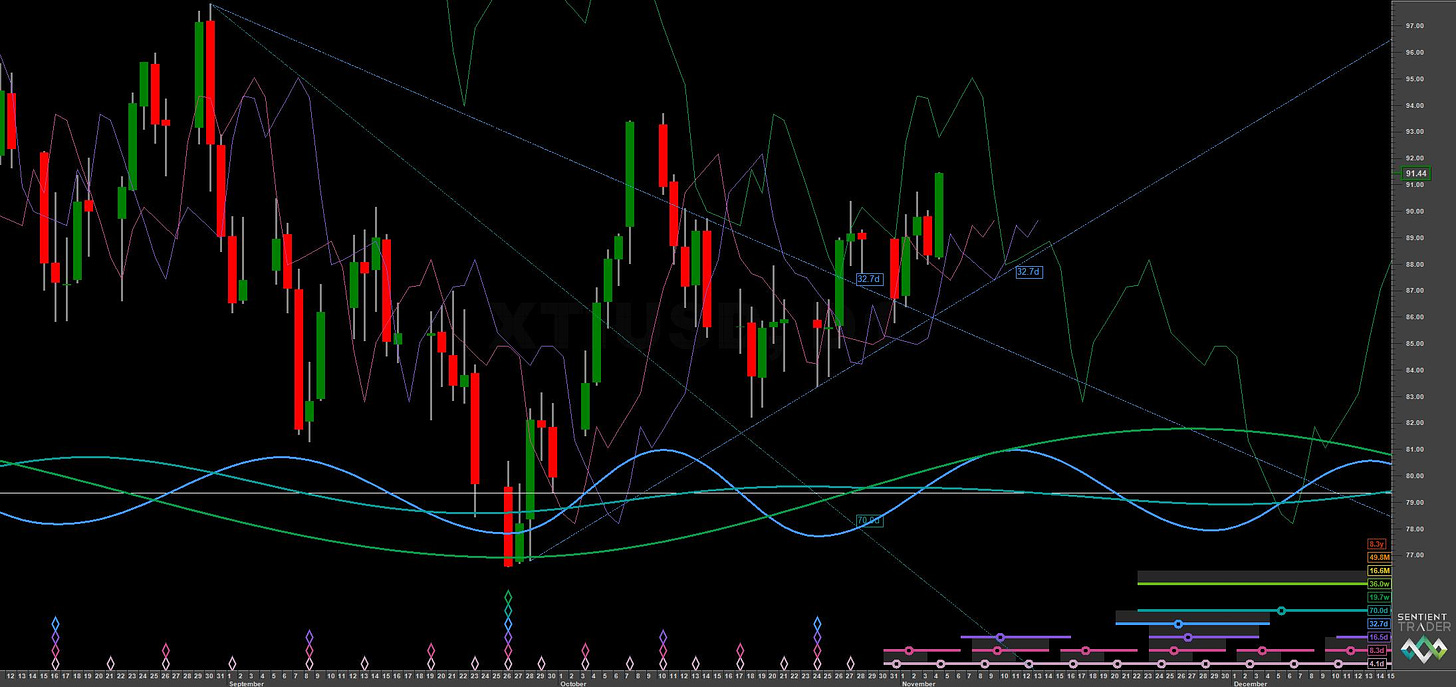
Short Term
Components around the 80 day nominal cycle
Time Frequency
Wavelet convolution output targeting 80 day nominal component
Trading Strategy
Interaction Status
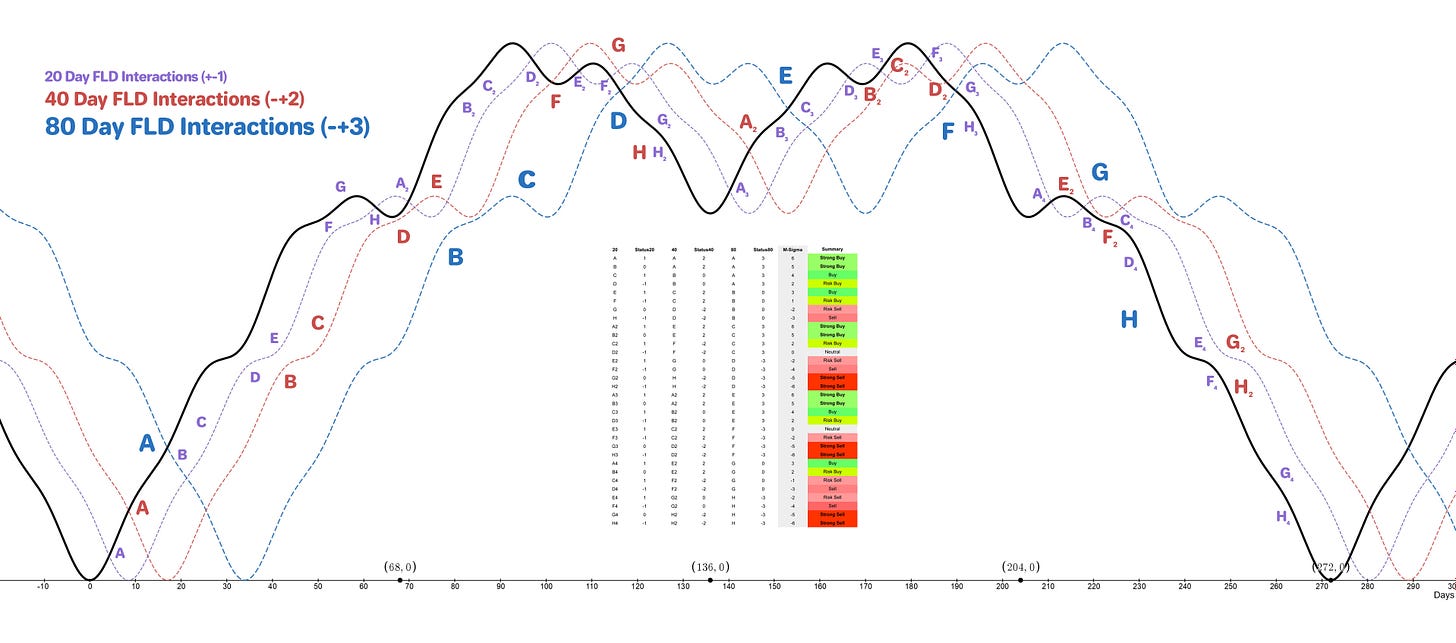
Interactions and price in the FLD Trading Strategy (Advanced). This looks at an idealised 40 week cycle and an array of 3 FLD signal cycles. We apply the instrument’s phasing to the model and arrive at an overall summary for the interactions with the 20 day FLD, current and forthcoming.
Sigma-L recommendation: Sell
Entry: 10 Day FLD (risk on) / 20 Day FLD / 40 day VTL
Stop: Above formed 80 day nominal peak
Target: Initially 78, then 50-60, 54 month FLD support
Reference 20 Day FLD Interaction: F3
Underlying 40 Day FLD Status: D2
Underlying 80 Day FLD Status: F
Price is, at the time of writing, approaching the 20 week FLD resistance and our target of around 95 from the last report. Should the phasing be accurate at the long term scale, the next peak is crucial and a potentially excellent entry point for the final descent into the 18 month nominal low, due late January.
Initial entry points are the standard 10 and 20 day FLDs. There is also the 40 day VTL (shown on short term chart) which, in itself, confirms a peak of 80 day magnitude has occurred in the recent past.
Initial targets are down at around 78, the 20 week nominal low and subsequently in the more medium term down at around 50-60 and the 54 month FLD support, shown on the long term chart in orange. Watch for price tracking the 20 week FLD in this current 80 day iteration, due to trough late November / early December.
FLD Settings
If you do not have the use of Sentient Trader use these settings to plot FLDs in your trading software (daily scale) to more easily follow trading signals and strategy from Sigma-L.
Make sure to account for non-trading days if your broker omits them in the data feed (weekends, for example). The below offsets are given with no added calculation for non-trading days.
80 day nominal: 70 days | 35 day FLD offset
40 day nominal: 32.7 days | 16 day FLD offset
20 day nominal: 16.5 days | 8 day FLD offset
10 day nominal: 8.3 days | 4 day FLD offset
Correlated Exposure Options
A non exhaustive list of correlated instruments for consideration
United States Oil Fund LP $USO Energy Select Sector SPDR Fund XLE 0.00%↑
ProShares Ultra Bloomberg Crude Oil UCO 0.00%↑
Invesco DB Oil Fund DBO 0.00%↑
United States 12 Month Oil Fund LP USL 0.00%↑
ProShares K-1 Free Crude Oil Strategy ETF OILK 0.00%↑
MicroSectors Oil & Gas Exp. & Prod. 3x Leveraged ETN OILU 0.00%↑
MicroSectors Oil & Gas Exp. & Prod. -3x Inverse Leveraged ETN OILD 0.00%↑
United States Brent Oil Fund BNO 0.00%↑
iPath Pure Beta Crude Oil ETN OIL 0.00%↑


