


ΣL Precious Metals Composite - 20th July 2023 | @ 296 Days
'B' class signal detected in Sigma-L Precious Metals Composite (Gold, Silver, Platinum, Palladium). Average wavelength of 296 days over 11 sample iterations since April 2015. Currently turning up.

Instrument Summary
This time domain average of important precious metals, valued in US Dollars, emphasises the periodic components within each constituent that are phase locked. The signal to noise ratio for any significant periodicity is increased, within the average, by this method. Included in the composite are gold, silver, platinum and palladium.
Current Signal Status
Defining characteristics of the component detected over the sample period.
Detected Signal Class: B - learn more
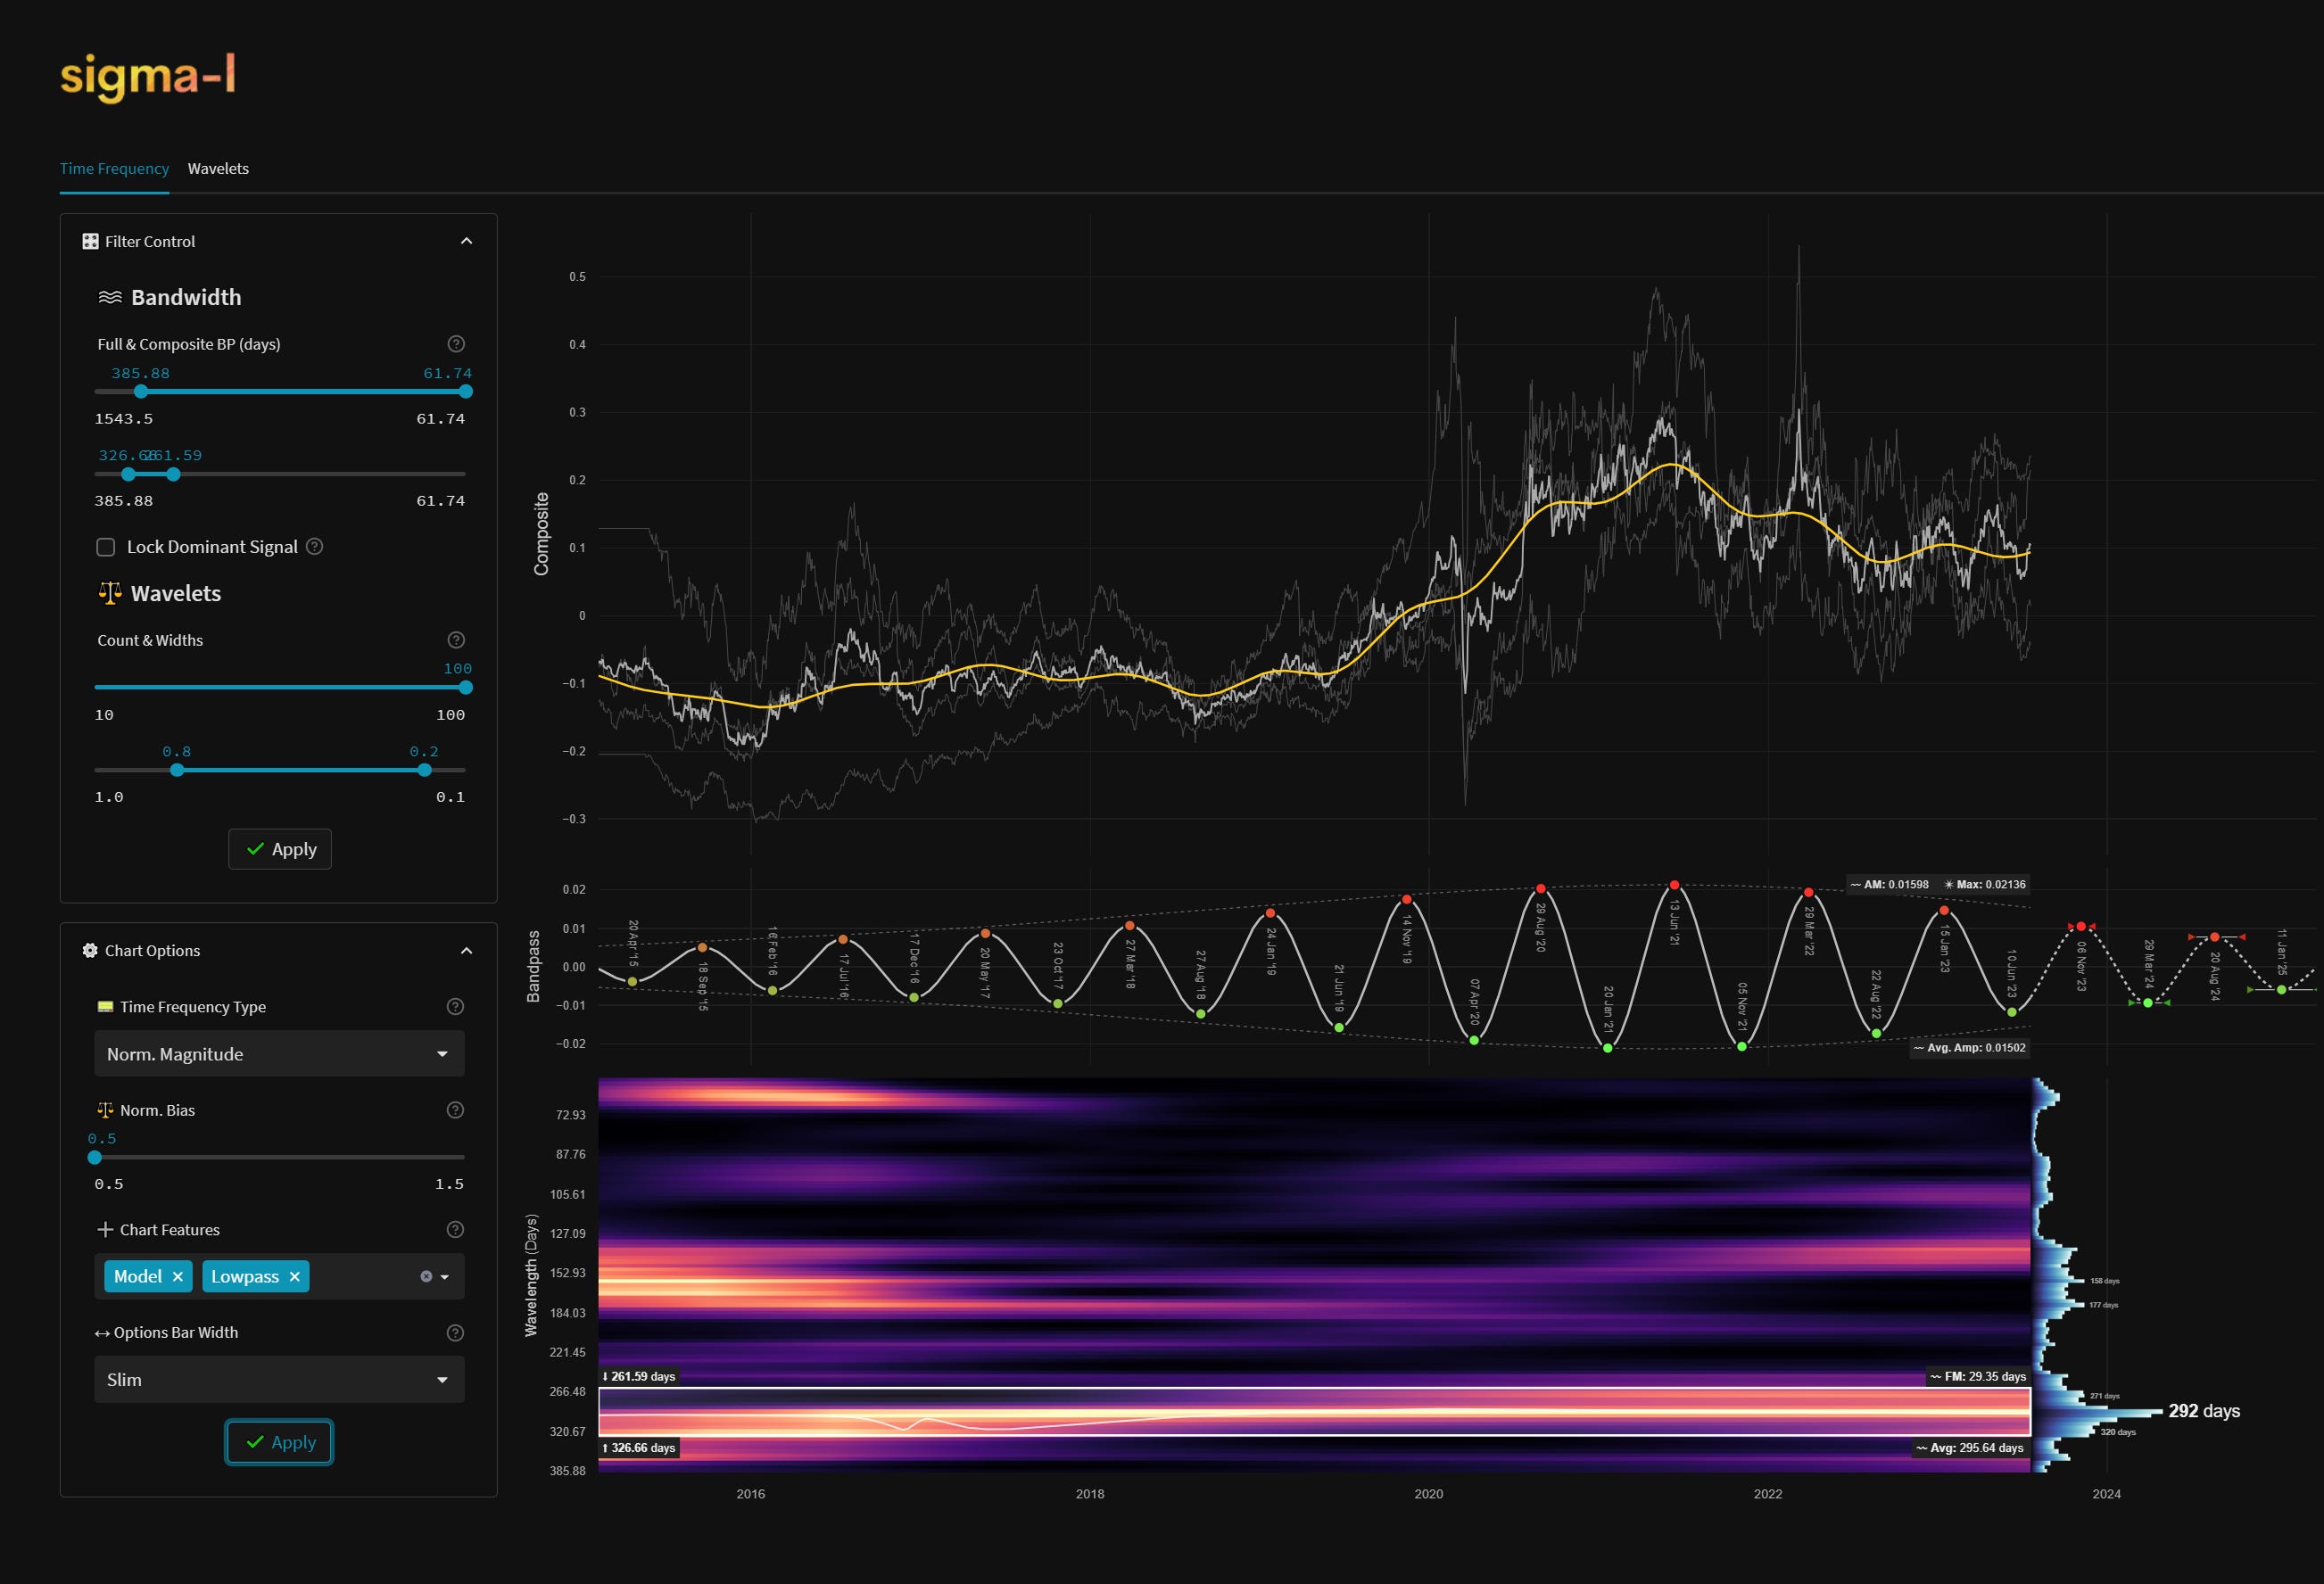
Average Wavelength: 295.64 Days (42.23 Weeks)
Completed Iterations: 11
Time Frequency Analysis
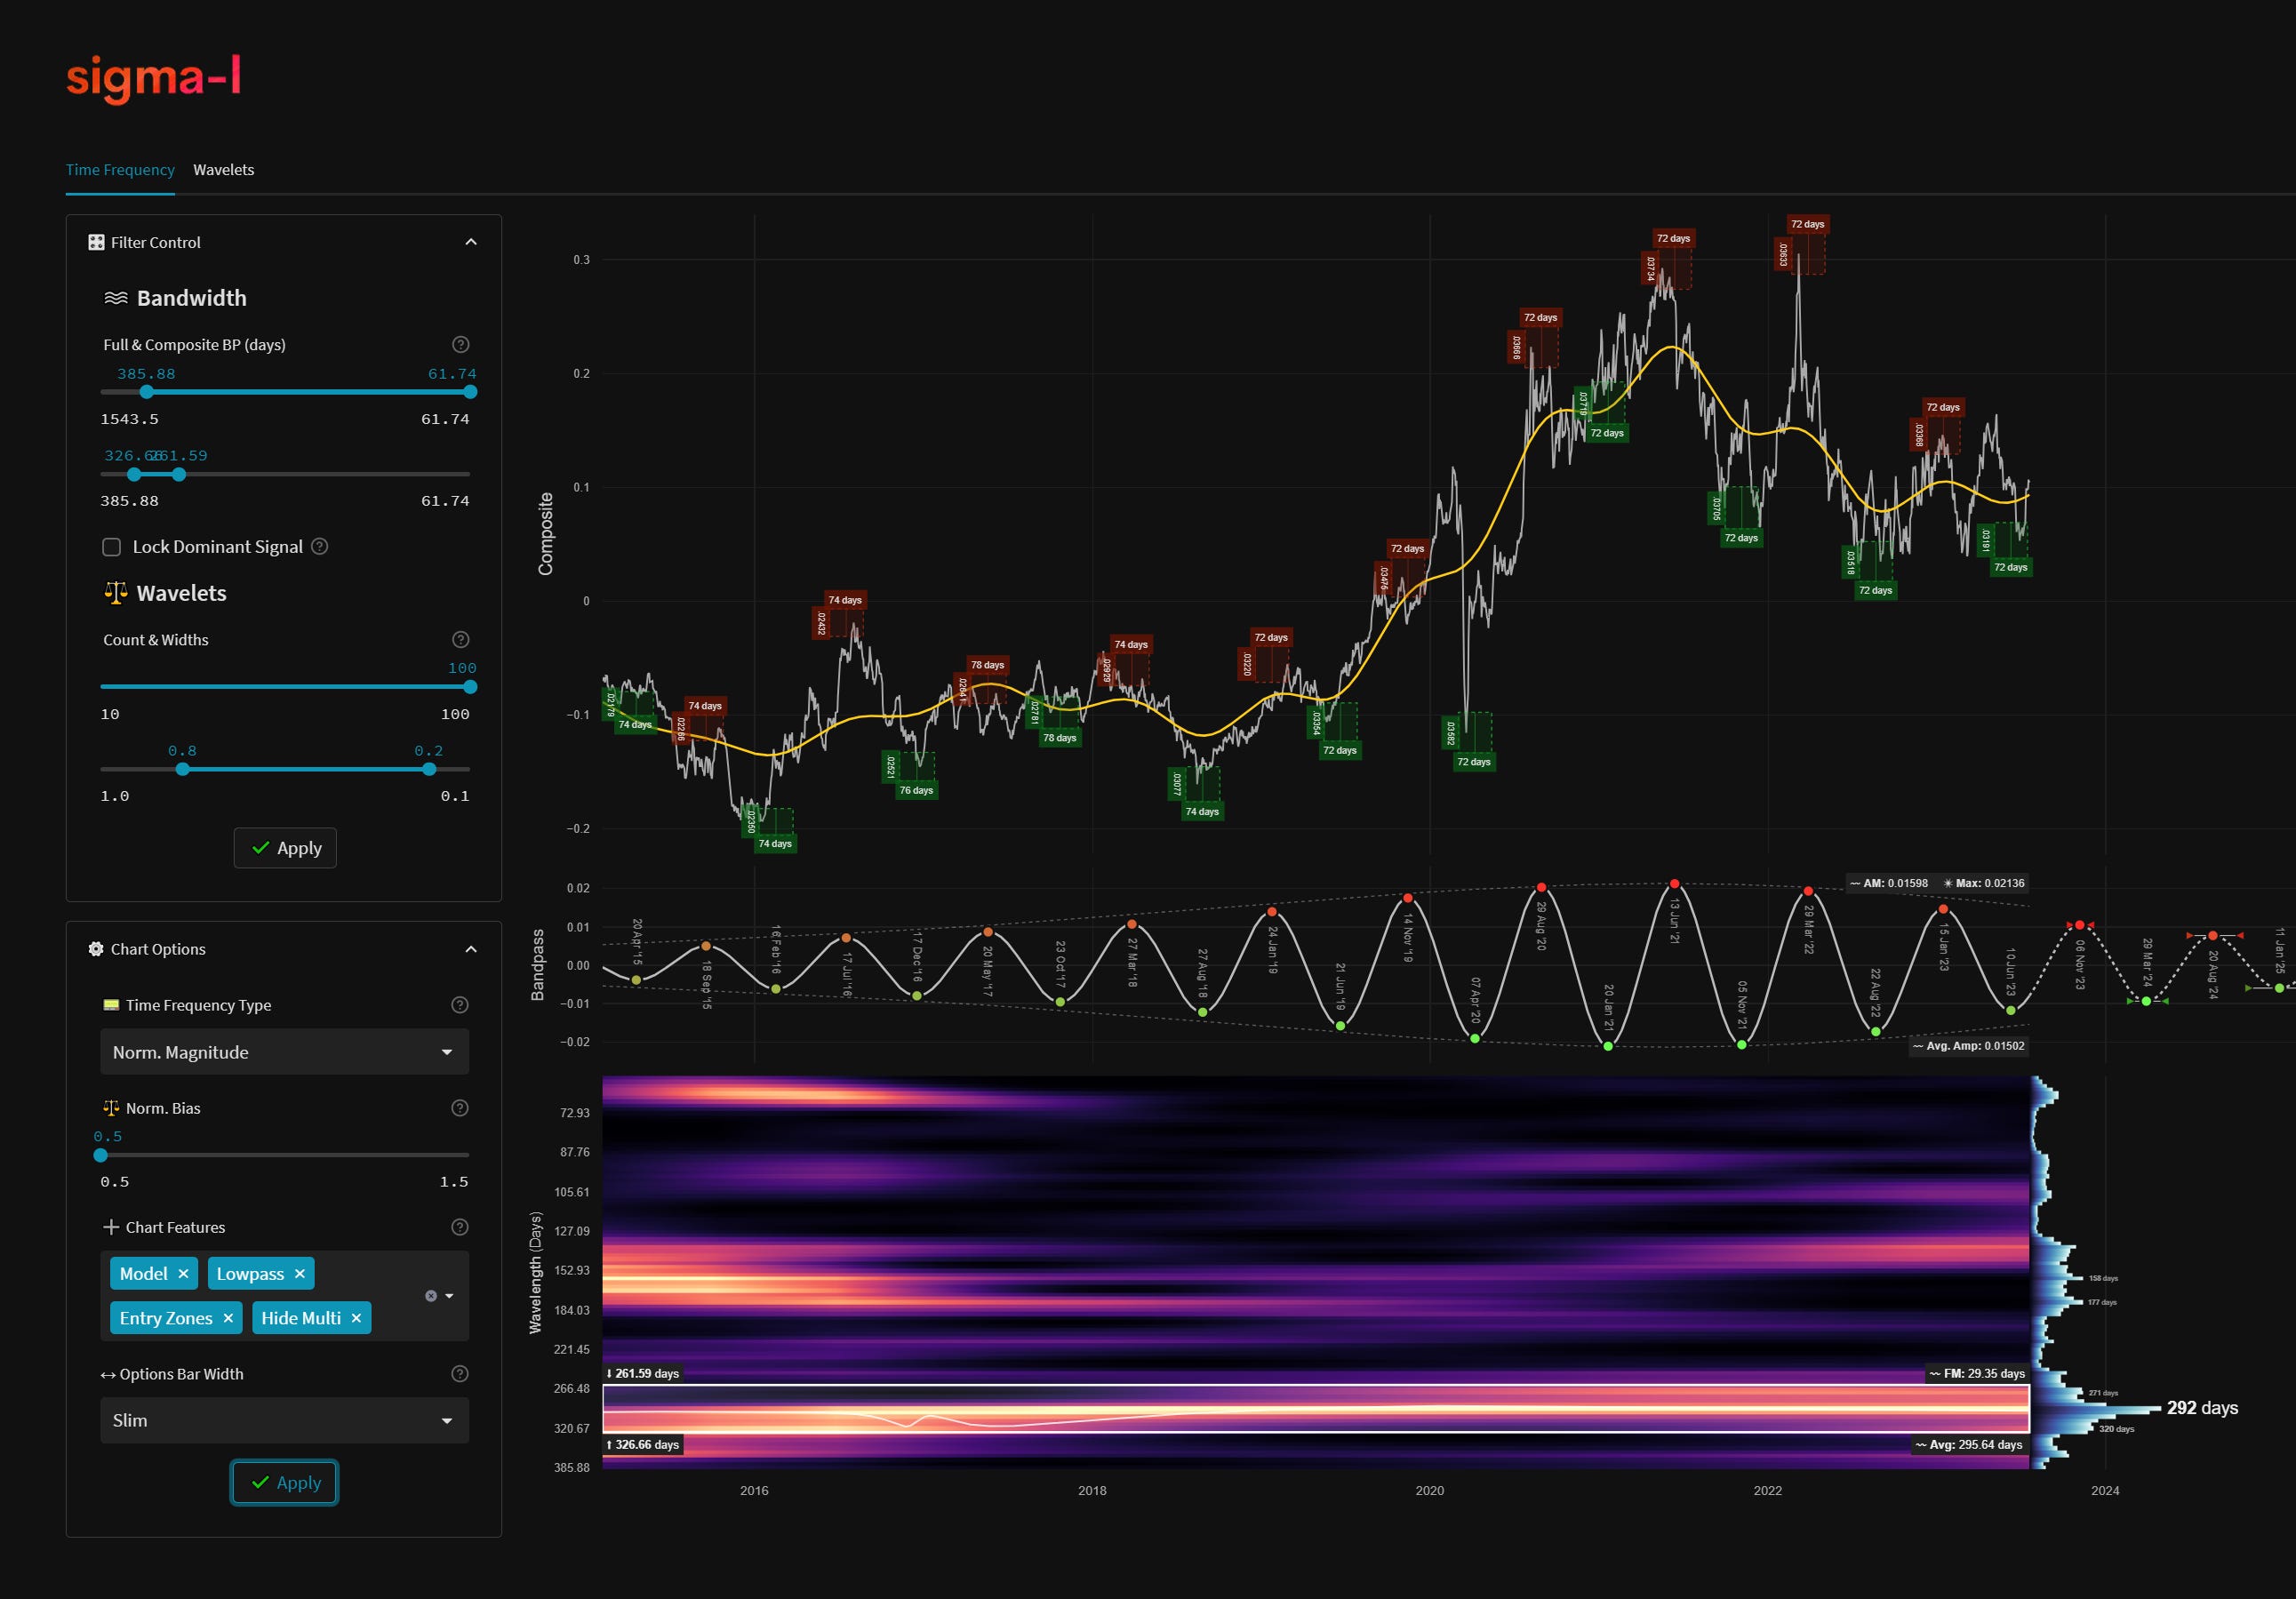
Time frequency charts (learn more) below will typically show the cycle of interest against price, the bandpass output alone and the bandwidth of the component in the time frequency heatmap, framed in white. If a second chart is displayed it will usually show highpassed price with the extracted signal overlaid for visual clarity.
Current Signal Detail & Targets
Here we give more detail on the signal relative to speculative price, given the detected attributes of the component. In most cases the time target to hold a trade for is more important, given we focus on cycles in financial markets. Forthcoming trough and peak ranges are based upon the frequency modulation in the sample (learn more).
Phase: Turning Up
FM: +- 29 Days
AM: N/A (Composite)
Next Trough Range: February 29th - April 27th, 2024
Next Peak Range: October 8th - December 5th, 2023
Sigma-L Recommendation: Late Buy
Time Target: ~ 6th November, 2023
Current Signal Phase
This is ‘how far along’ the cycle is in it’s period at now time and is related to the predicted price action direction.
Current Signal Frequency Modulation (FM)
This is how much, on average, the signal detected varies in frequency (or wavelength) over the whole sample. A lower variance is better and implies better profitability for the component. Frequency usually modulates relatively slowly and over several iterations.
Current Signal Amplitude Modulation (AM)
This is how much the component gains or loses power (price influence) across the sample, on average. Amplitude modulation can happen quite quickly and certainly is more evident than frequency modulation in financial markets. The more stable the modulation the better.