S&P 500 - 4th September 2024 | @ 3.5 Years
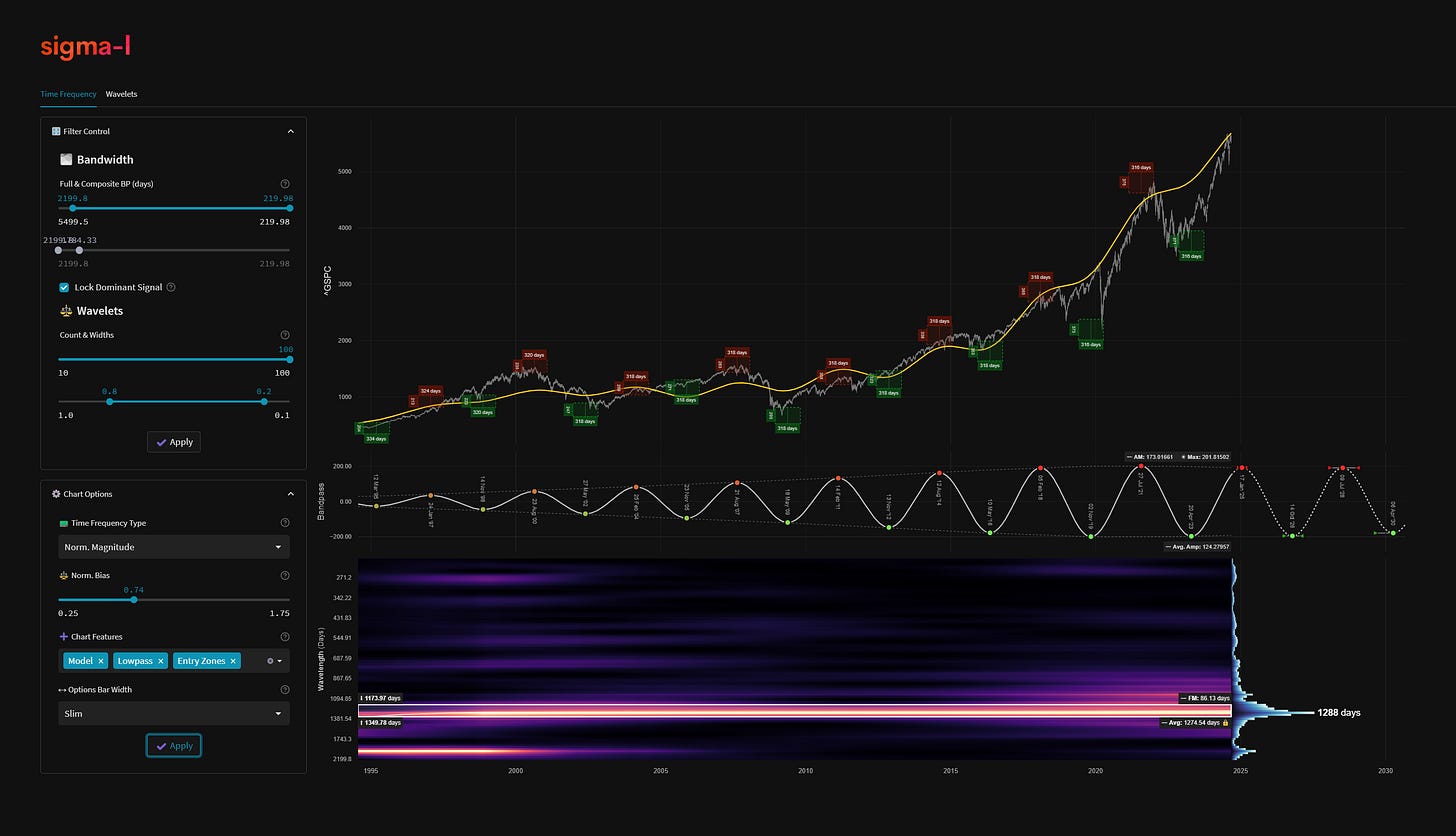
'A' class signal detected in the S&P 500. Running at an average wavelength of 1275 days (~ 3.5 years) over 9 iterations since August 1994. Currently peaking
ΣL Cycle Summary
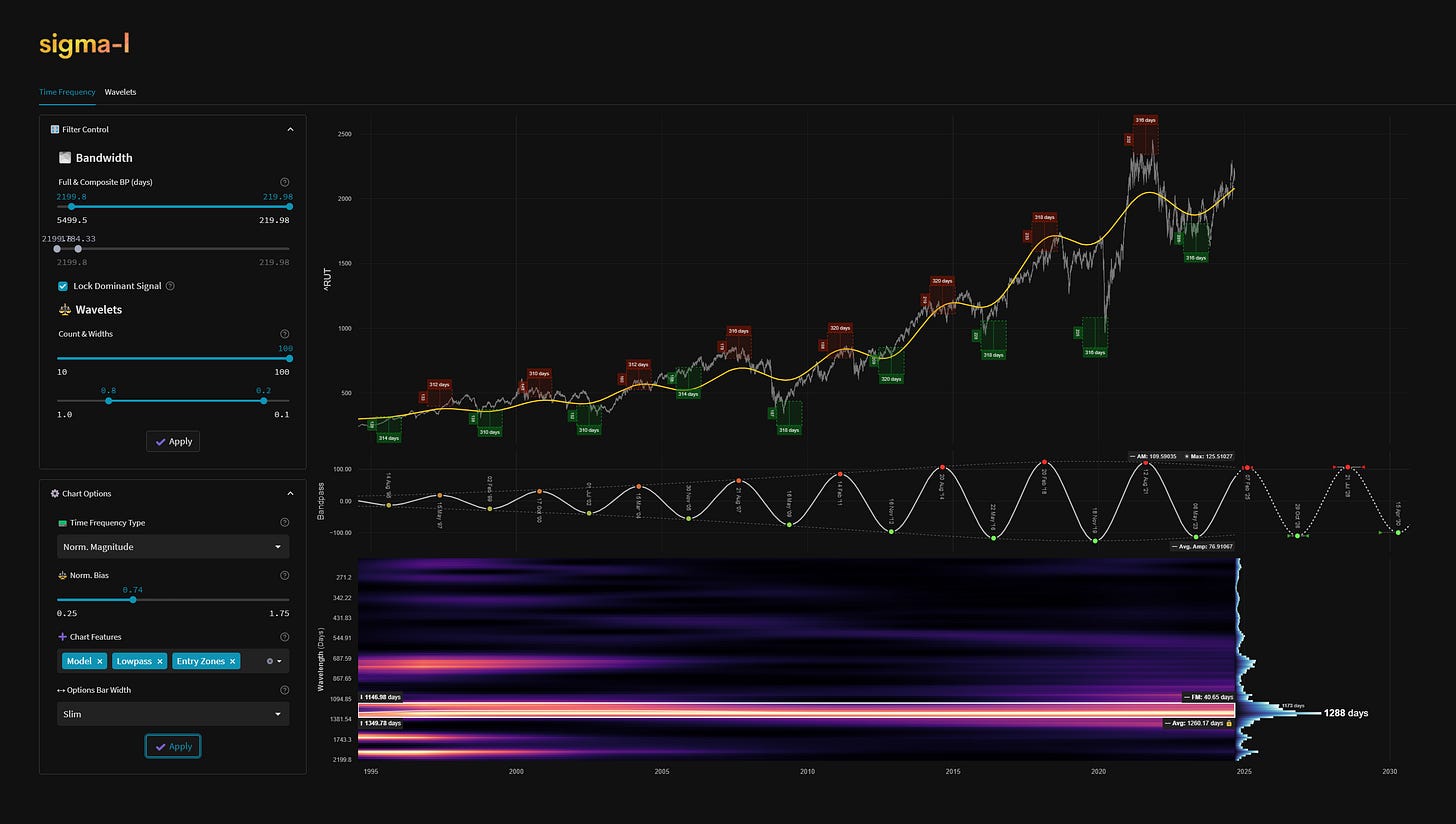
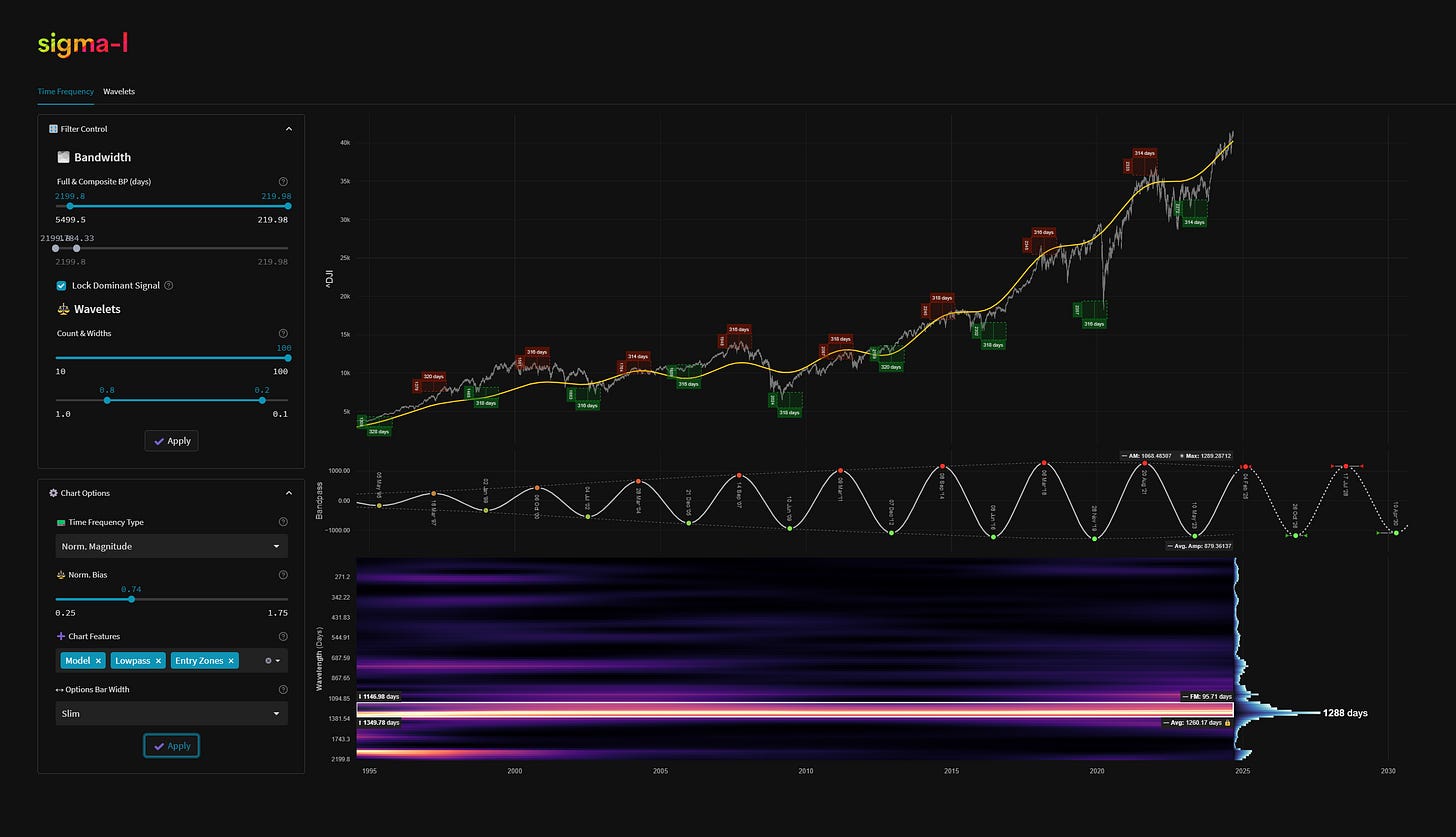
This superbly stable, long term cycle in the S&P 500 (and in others, Russell 2000 and DJIA, shown below) is testament to the non random nature of financial markets to some degree. We are excited to finally report on it as the peak approaches, although this report is somewhat early for the peak, subscribers should take note. It is quite incredible to see such a long term signal stand out in the bandwidth from around 2000 - 200 days wavelength and retain such clarity with relatively low frequency modulation (it’s duration varies very little over time). This is our archetypal ‘A’ category signal, with clear spectral spacing from surrounding frequencies. The implication being that there is no power (to drive price action) comparable to it in any significant statistical sense, anywhere near it.
As far as Hurst Cycles nomenclature is concerned, the common assumption is that there is a long term periodic component running at around 54 months, at least according to the nominal model. It was the discovery of the below wave several years ago, whilst applying an early version of our wavelet convolution, that prompted us to abandon that model in favour of a more evidenced and data driven approach, making conclusions from what we see. The stationarity of the wave, at around 1275 days from this particular sample, or ~ 41 months, is the only periodic feature of note over the last 30 years in this bandwidth range.
Readers should note that this periodic component is present in almost all global stock markets to a greater or lesser degree. US examples shown below.
Time Frequency Analysis
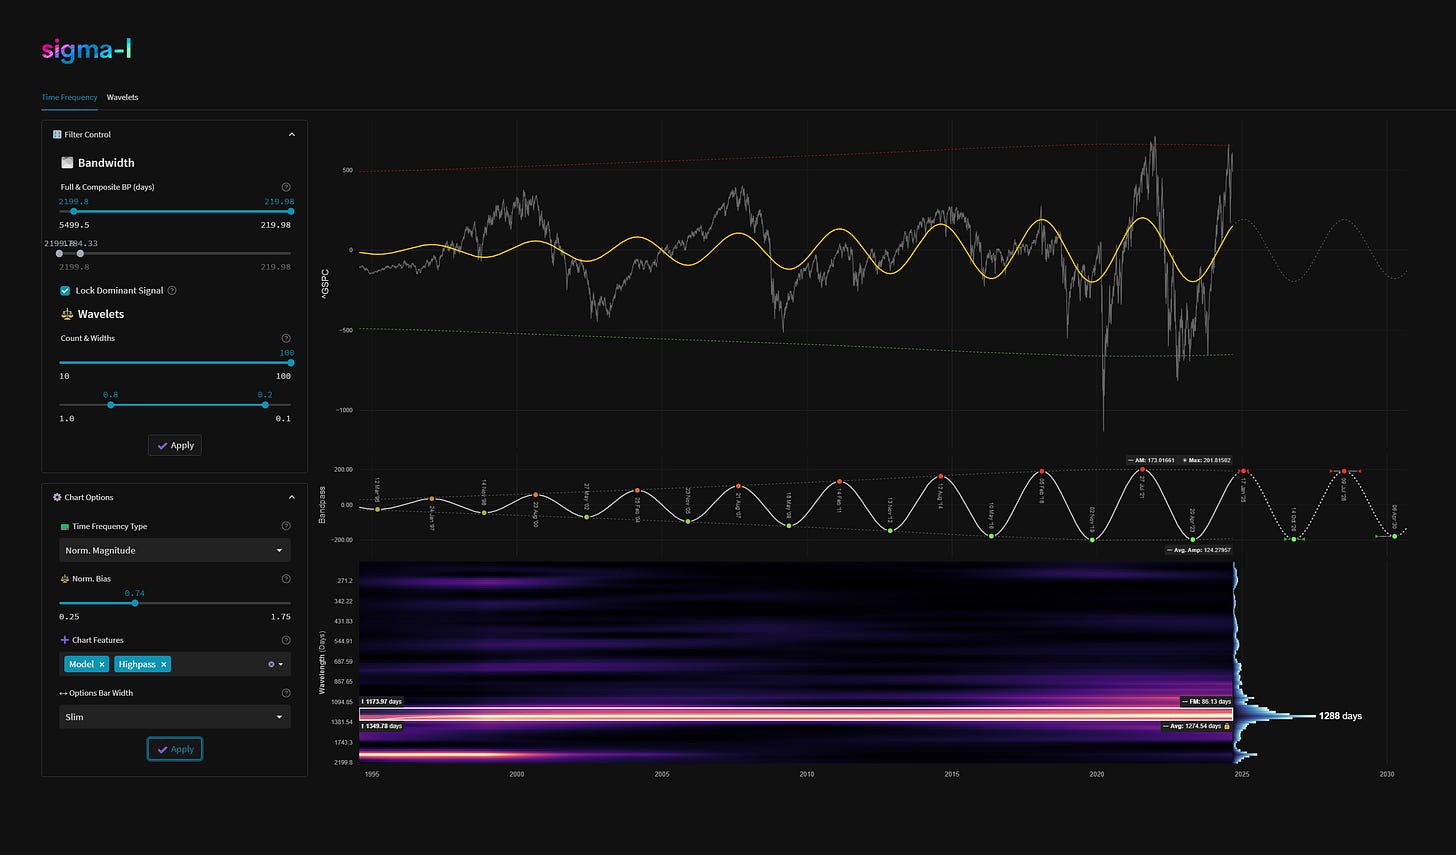
Time frequency charts (learn more) below will typically show the cycle of interest against price, the bandpass output alone and the bandwidth of the component in the time frequency heatmap, framed in white.


High-Pass Filtered Price
Our high-pass filter isolates the component of interest from underlying trend and presents buy and sell threshold envelopes (green and red). The envelopes are based upon the amplitude envelope of the bandpass filter +- 2 standard deviations. Breaches of either by high-passed price is a strong reversal action signal.

Current Signal Detail & Targets
Here we give more detail on the signal relative to speculative price, given the detected attributes of the component. In most cases the time target to hold a trade for is more important, given we focus on cycles in financial markets. Forthcoming trough and peak ranges are based upon the frequency modulation in the sample (learn more).
Detected Signal Class: A - learn more
Average Wavelength: 1274.54 Days (~ 3.49 Years)
Completed Iterations: 9
Component Yield Over Sample: 262.18% - learn morePhase: Peaking
FM: +- 86 Days
AM: 173.01661
Next Trough Range: September 1st, 2026 - November 26th, 2026
Next Peak Range: December 5th, 2024 - February 9th, 2025
Sigma-L Recommendation: Early Sell
Time Target: ~ 14th October, 2026
Current Signal Phase
This is ‘how far along’ the cycle is in it’s period at now time and is related to the predicted price action direction.
Current Signal Frequency Modulation (FM)
This is how much, on average, the signal detected varies in frequency (or wavelength) over the whole sample. A lower variance is better and implies better profitability for the component. Frequency usually modulates relatively slowly and over several iterations.
Current Signal Amplitude Modulation (AM)
This is how much the component gains or loses power (price influence) across the sample, on average. Amplitude modulation can happen quite quickly and certainly is more evident than frequency modulation in financial markets. The more stable the modulation the better.


Hi David, great work as always. I've been a long-time reader, but I was a bit confused about the term "A Class". Just to clarify, this isn't related to the FLD strategy nomenclature (Category A, B, C, etc.), right?
Would have made so much money if I found you earlier