


S&P 500 - Market Cycles - 6th April 2023
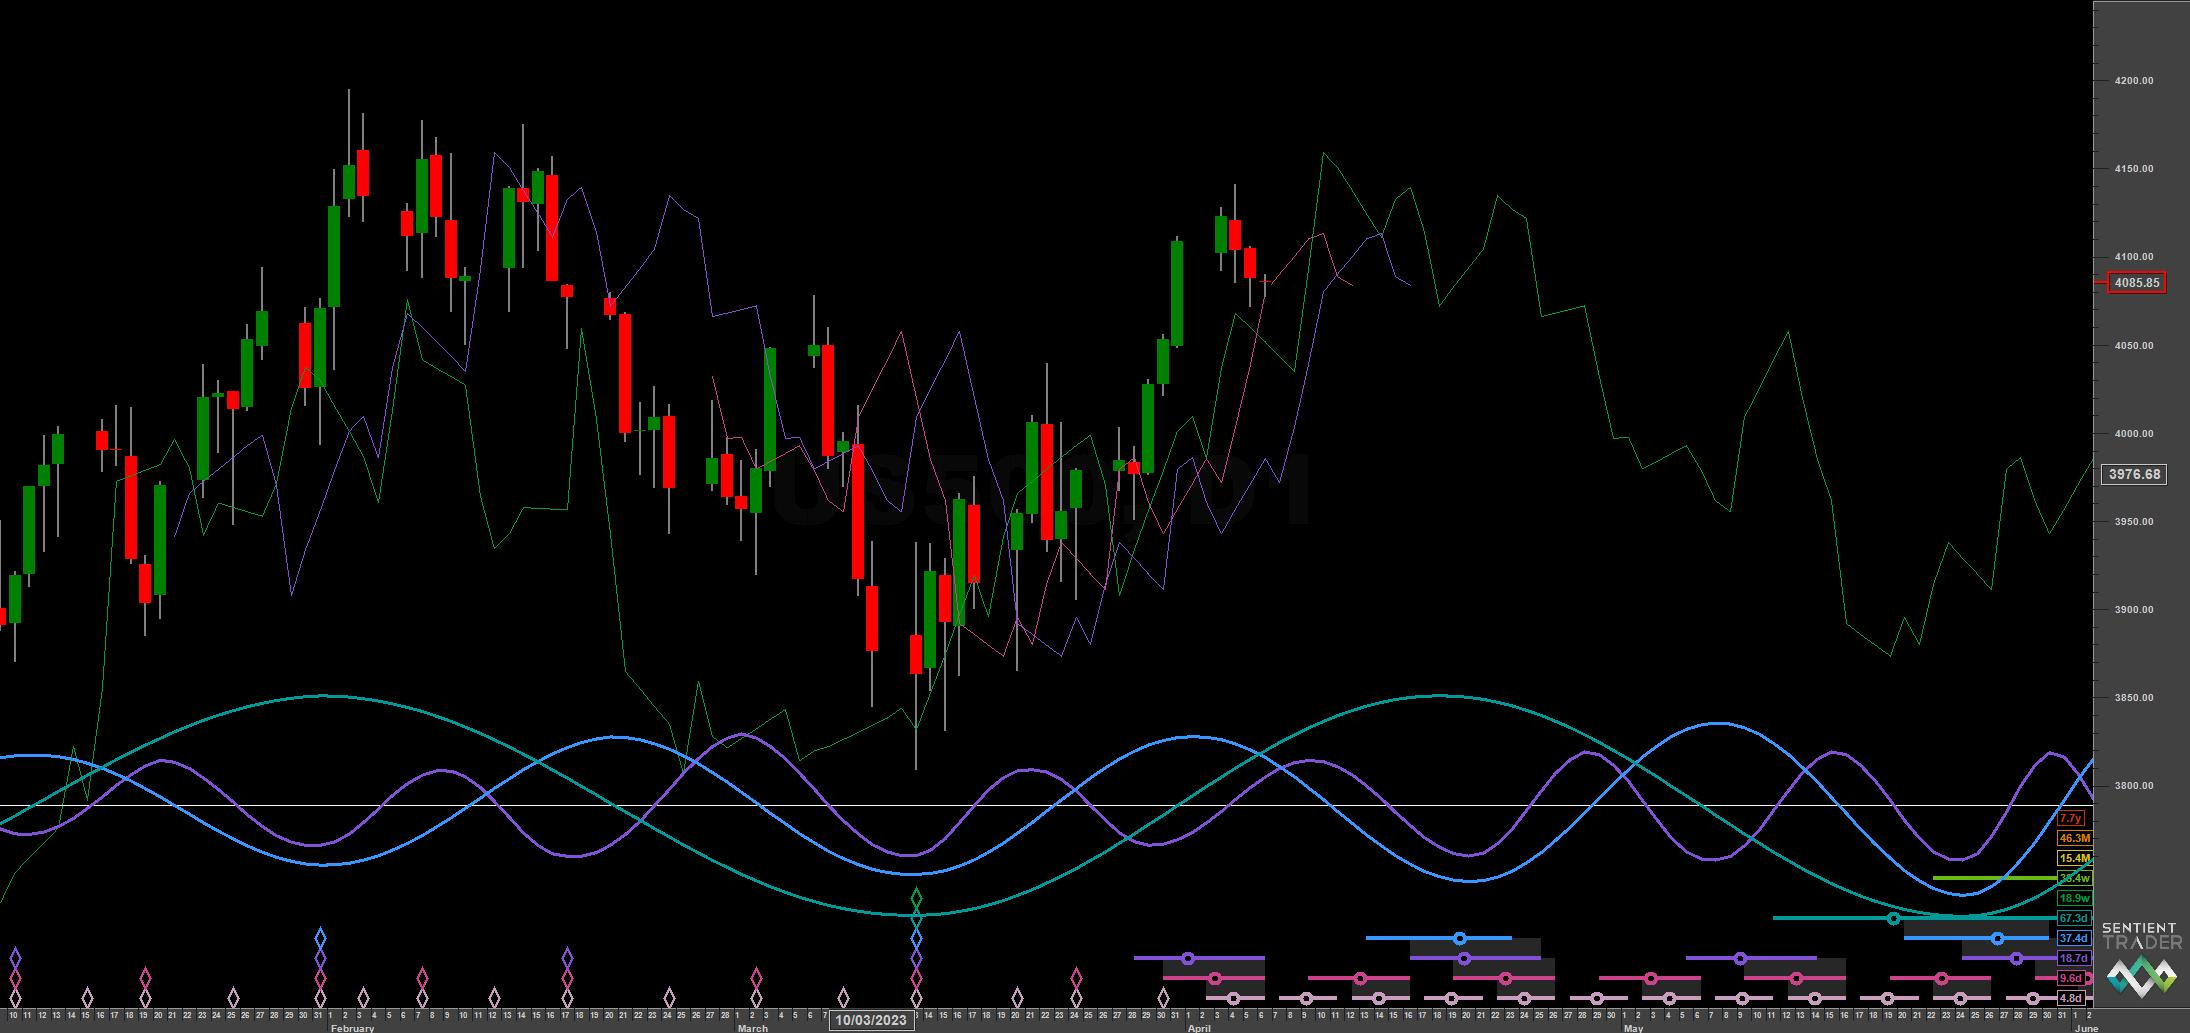
Price moves up from the 20 week and 80 day component lows in early March, reaching near to our target of 4150. Now, a crucial turning point is ahead with a possible peak of the 20 week wave imminent.

Essentials: Nominal Model | FLD | FLD Trading Strategy | FLD Trading Strategy (Advanced) | Underlying Trend | Time Frequency Analysis
Analysis Summary
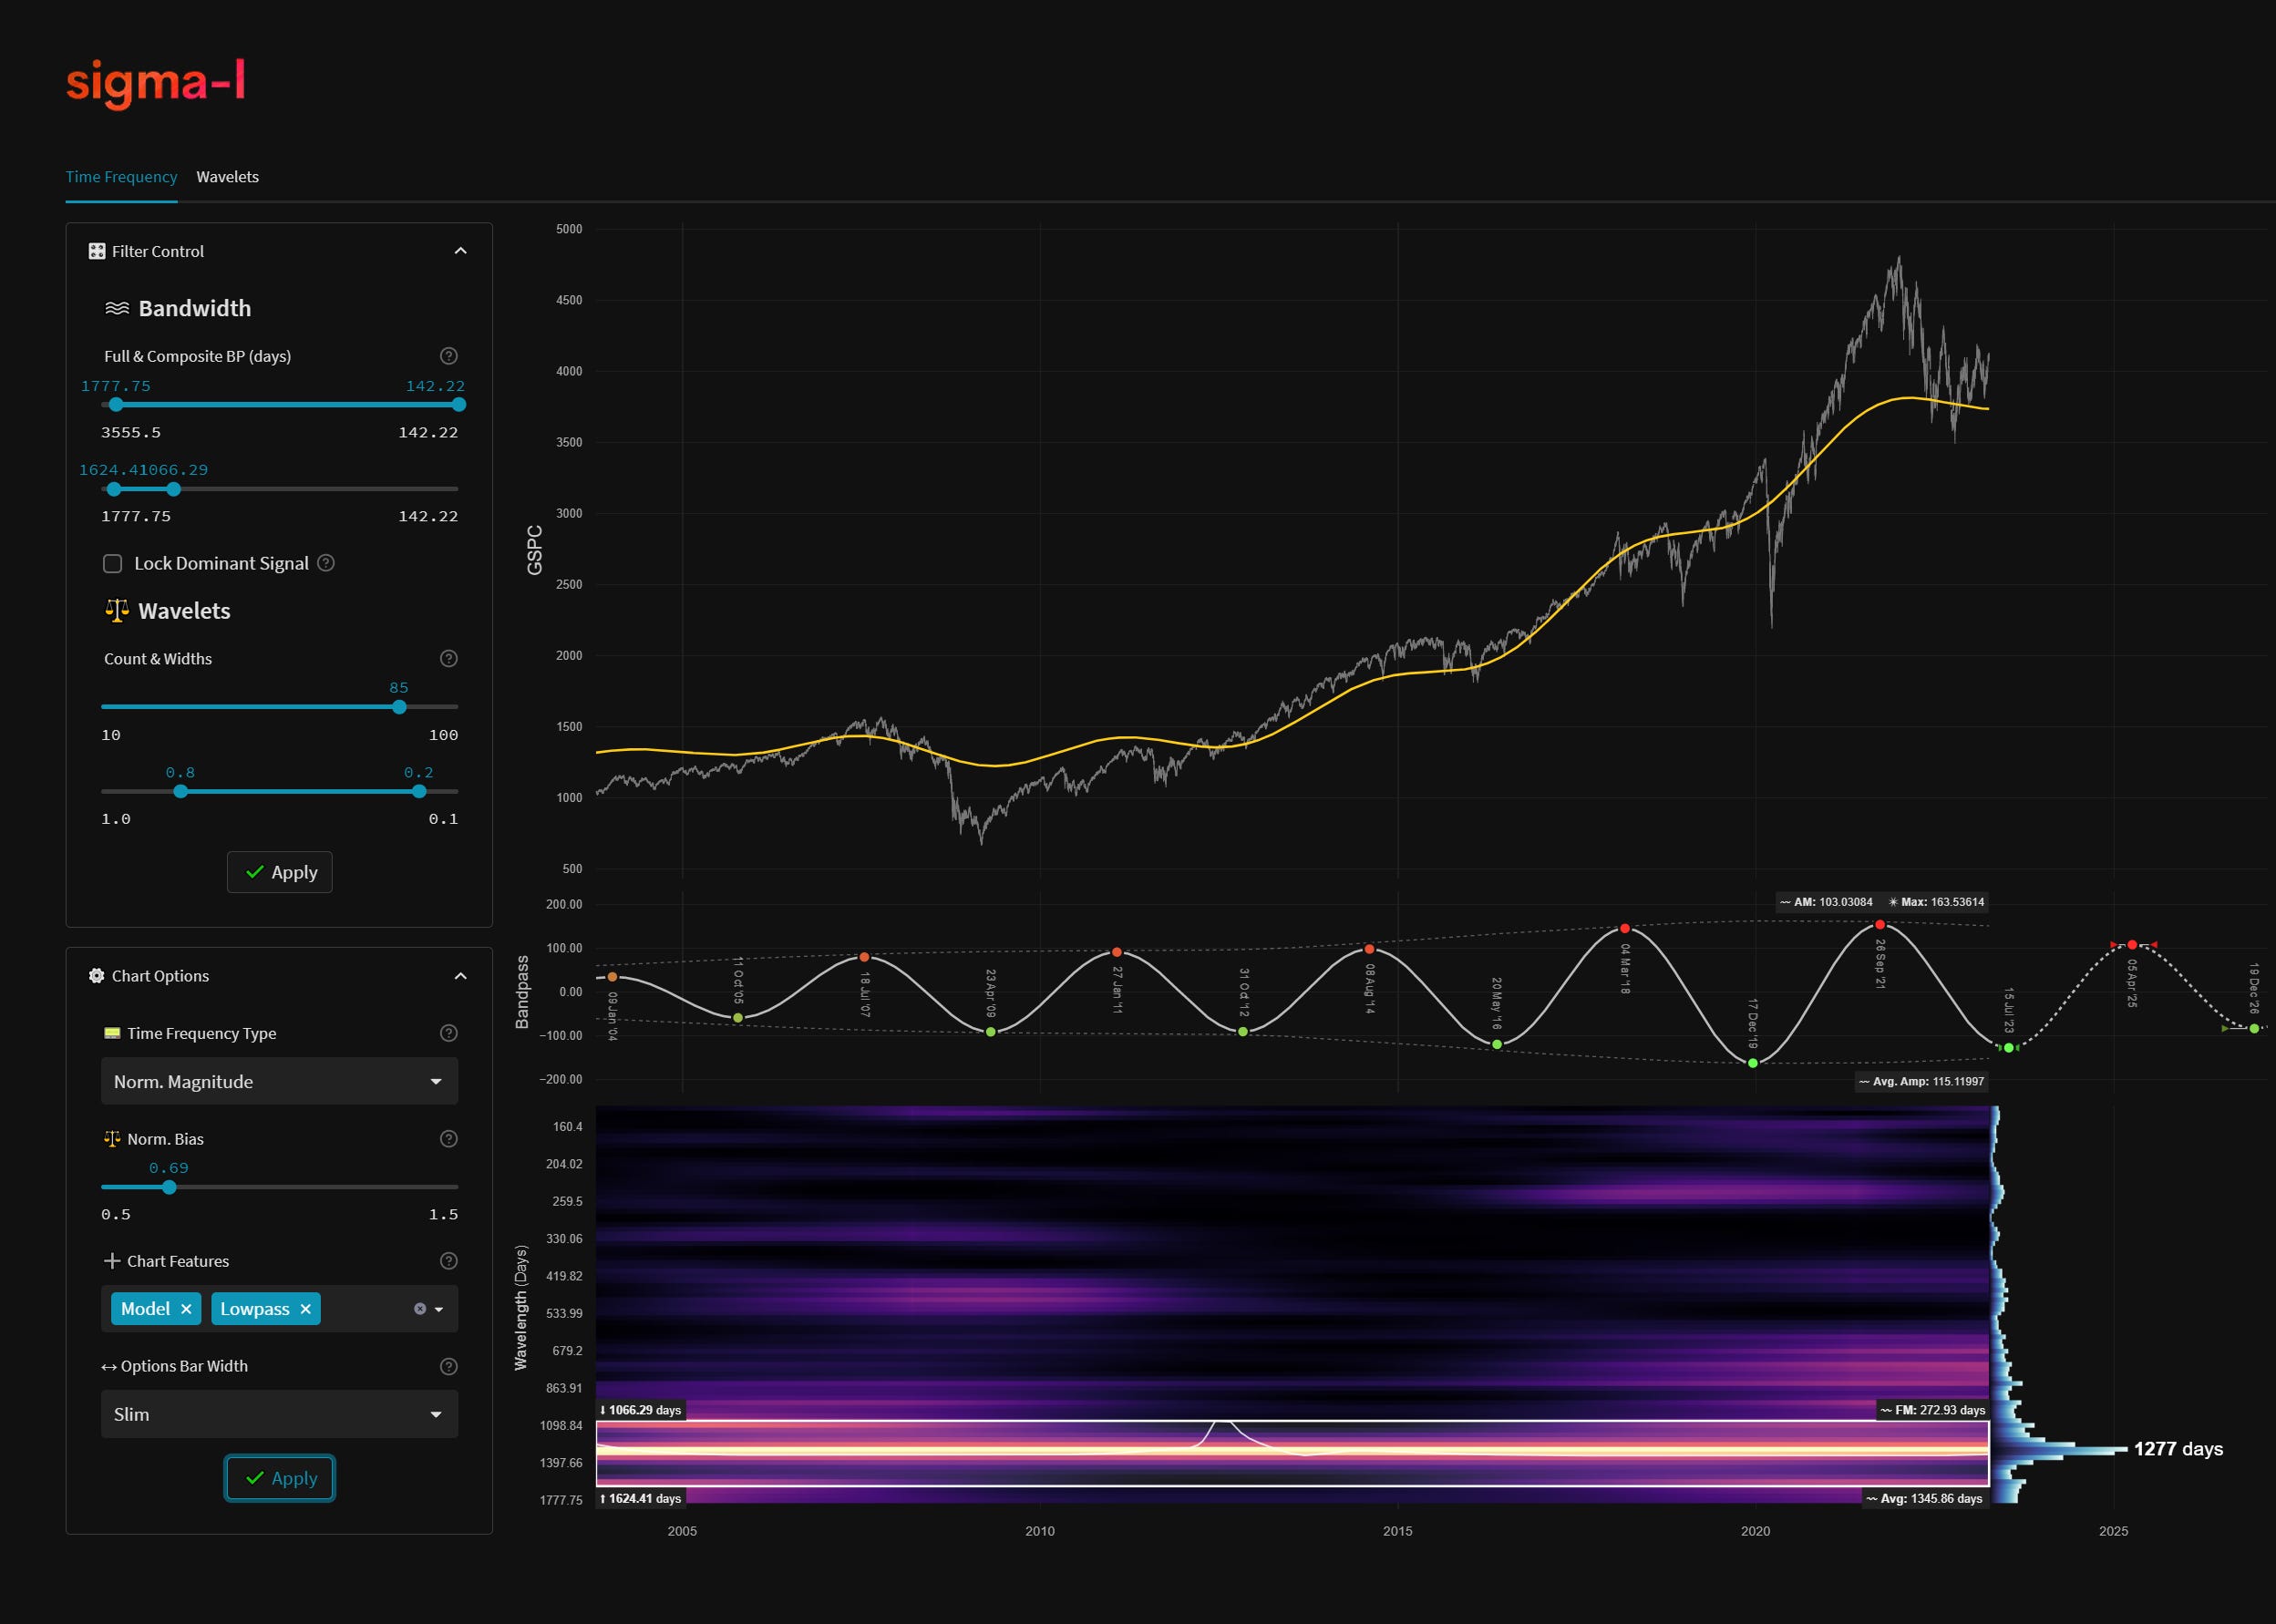
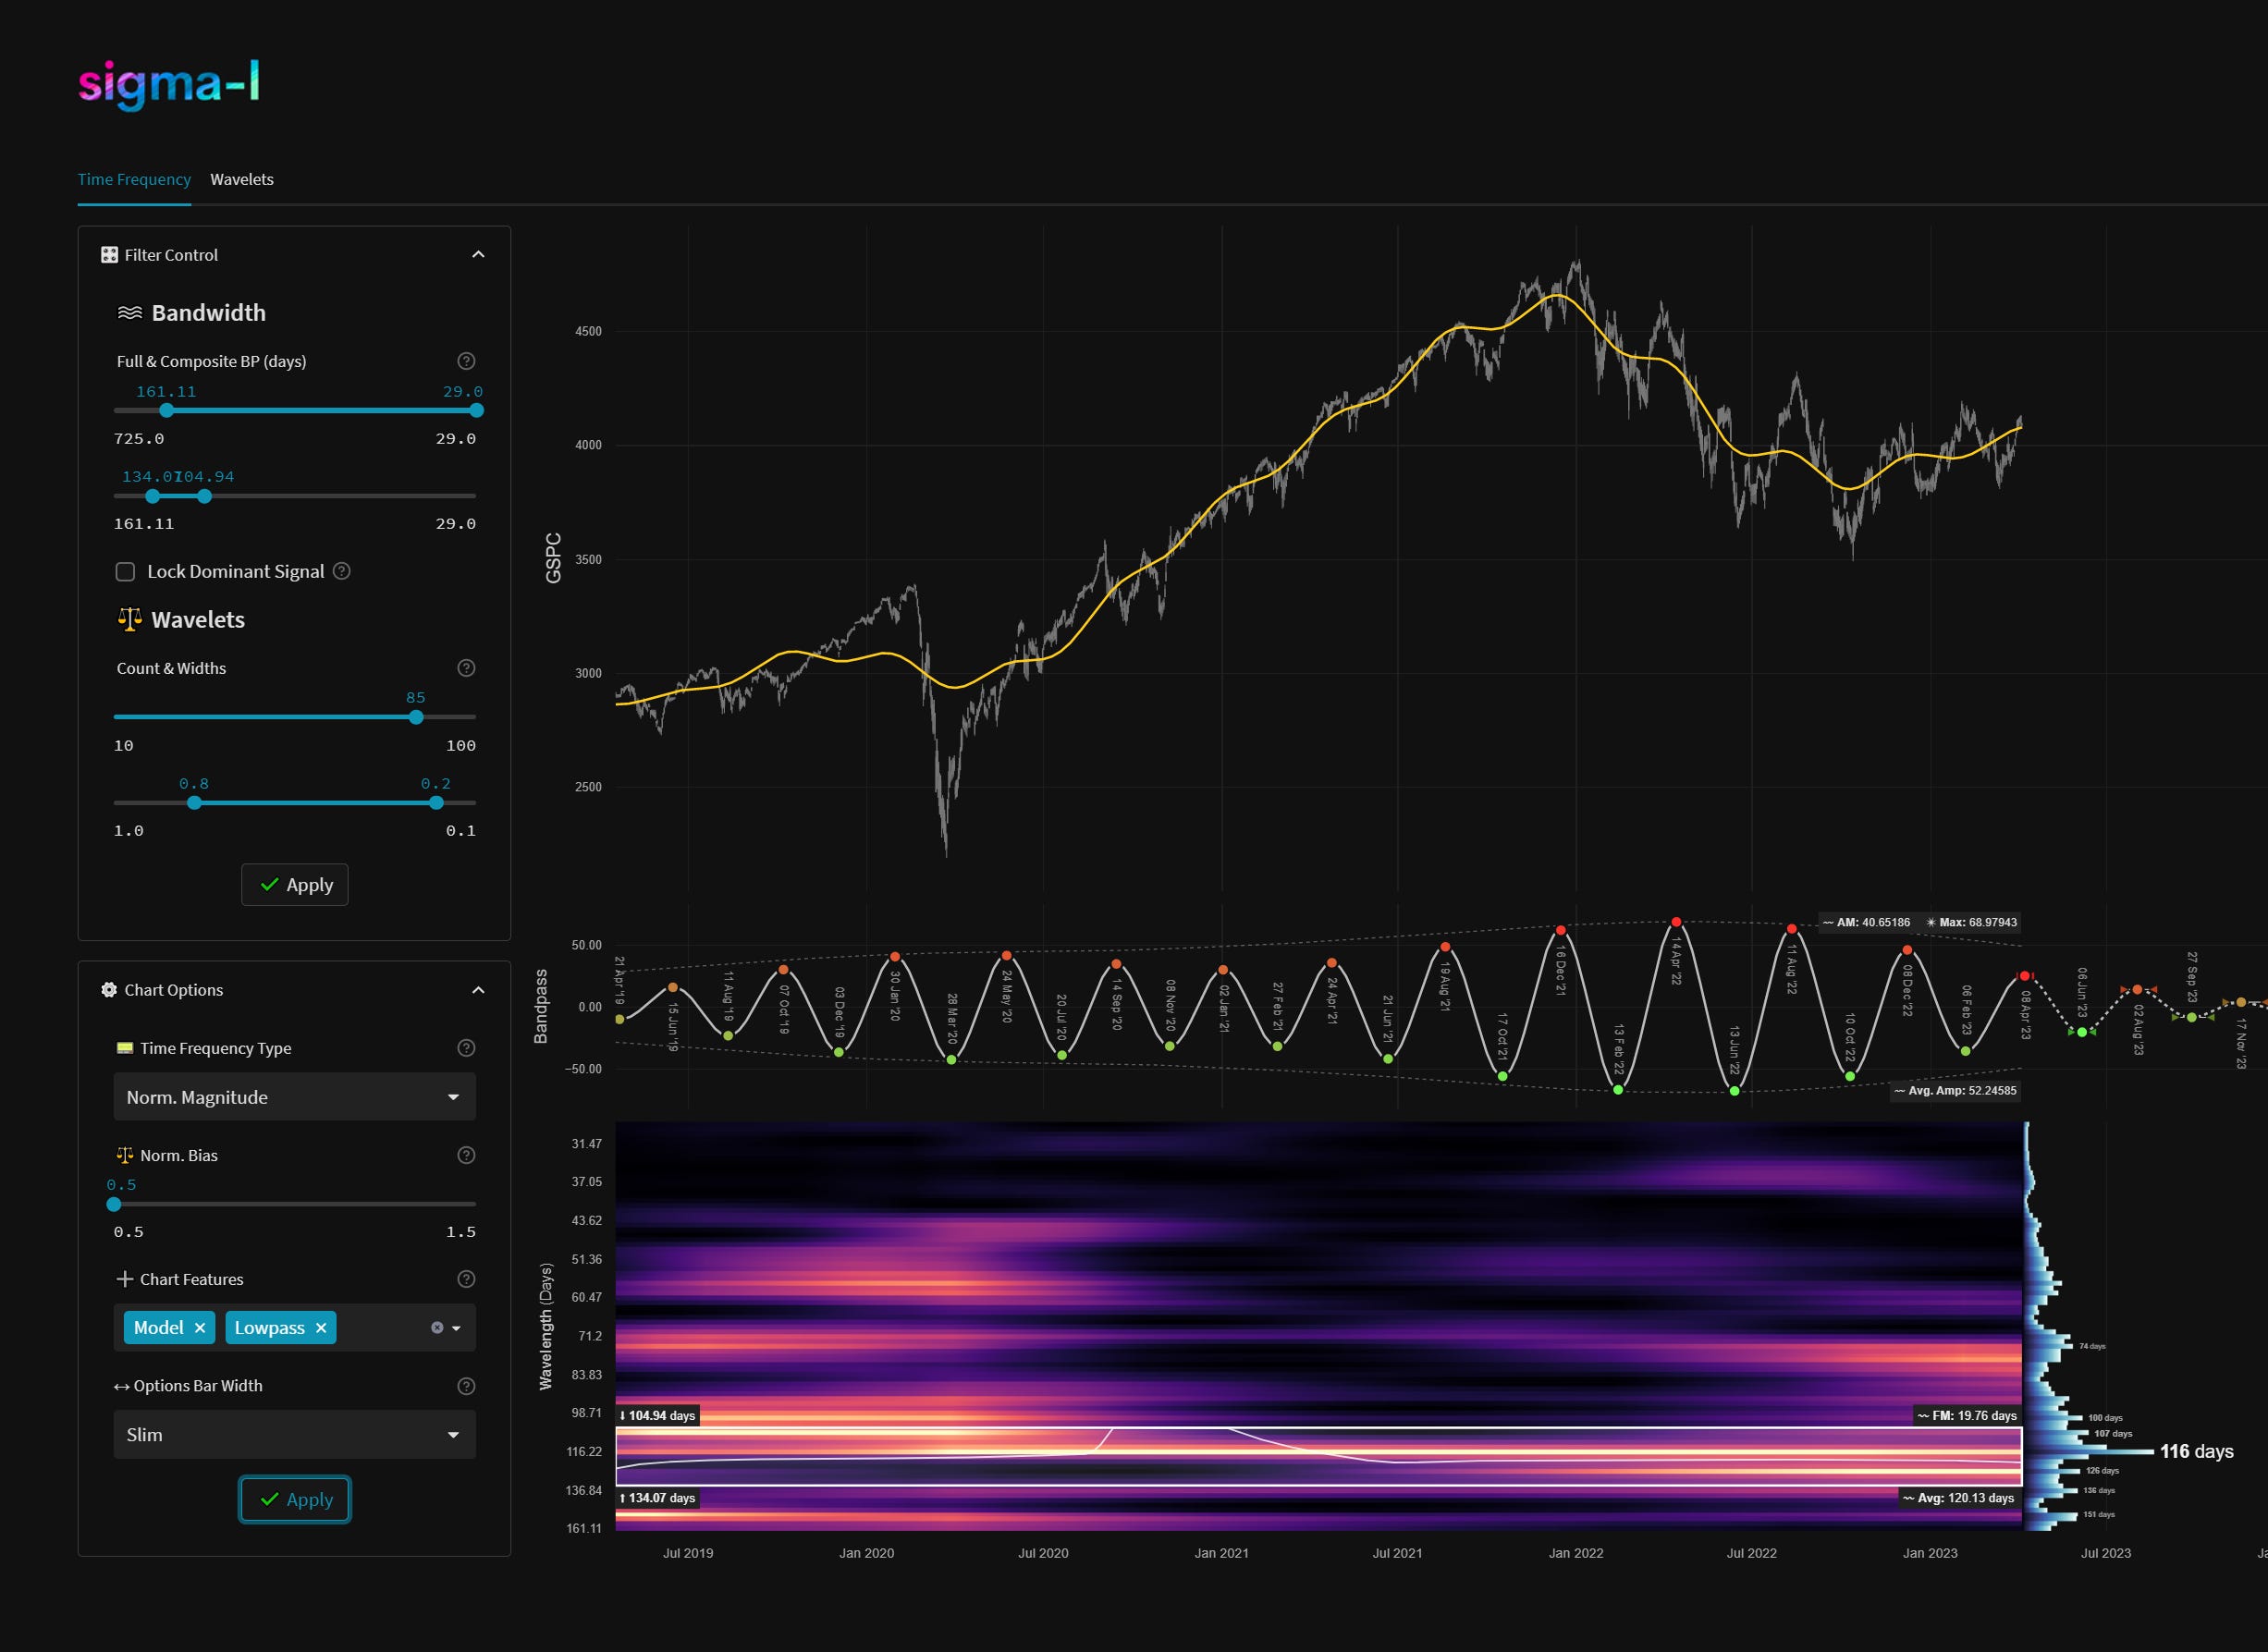
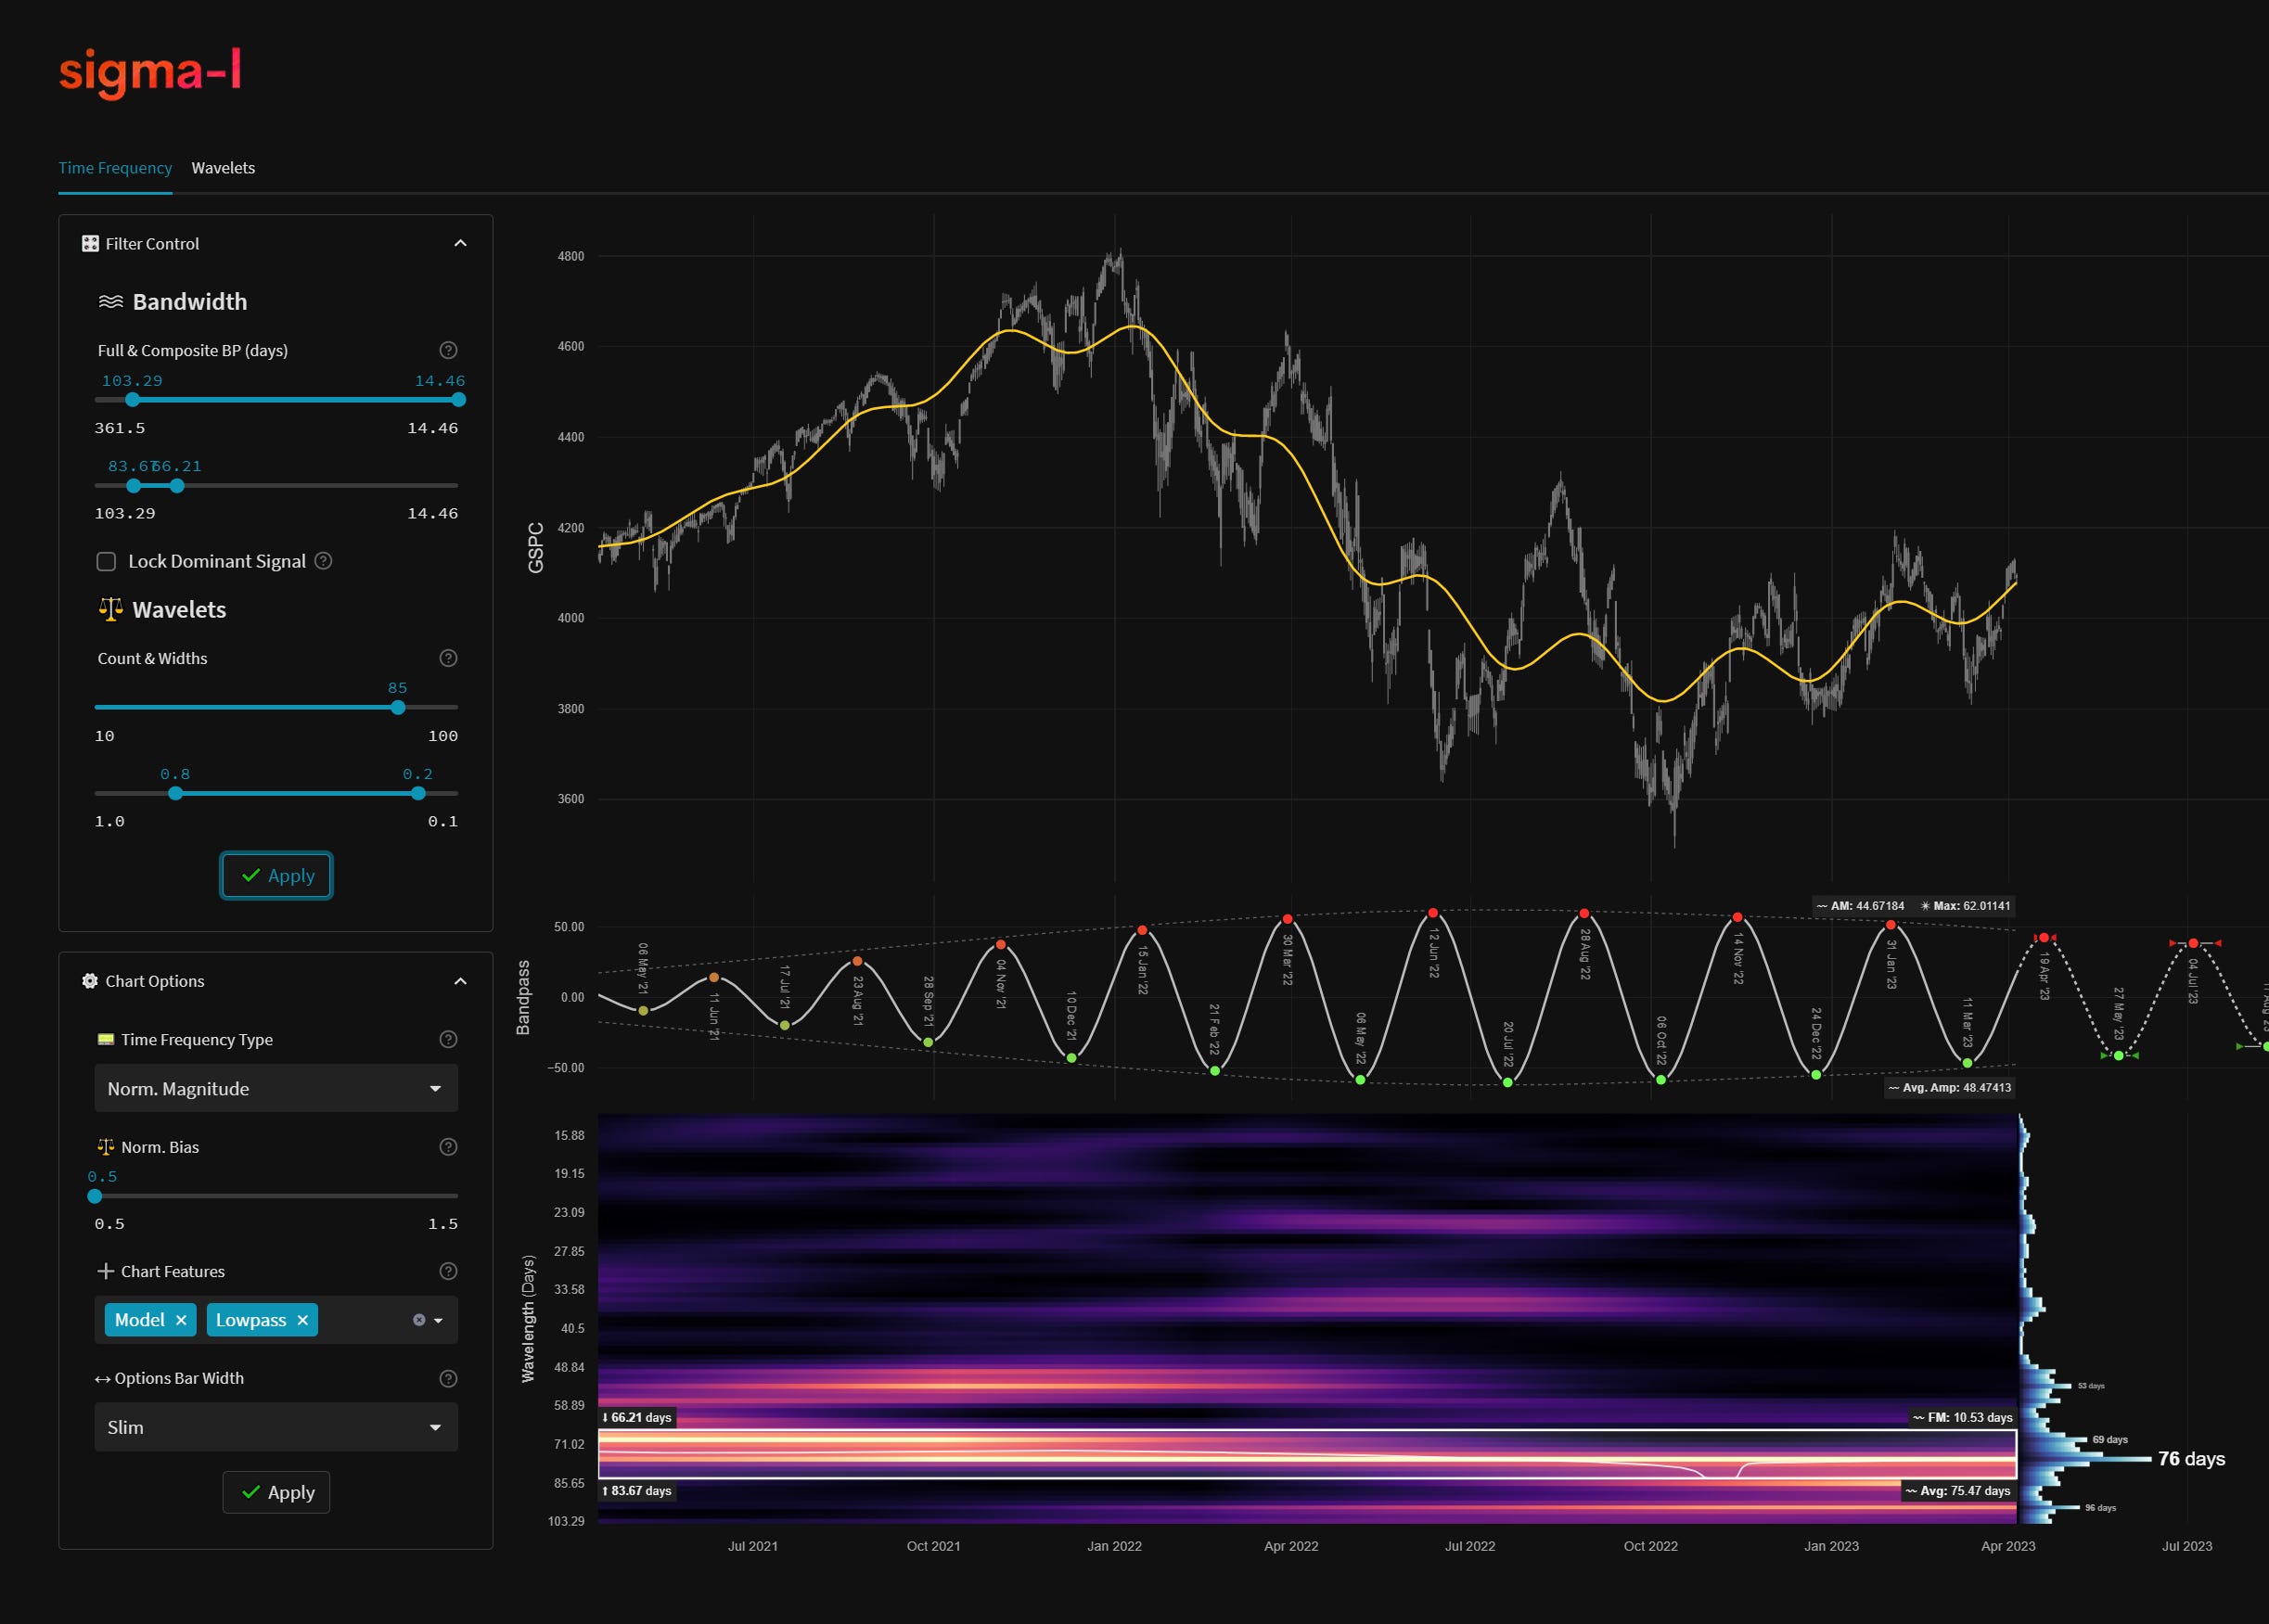
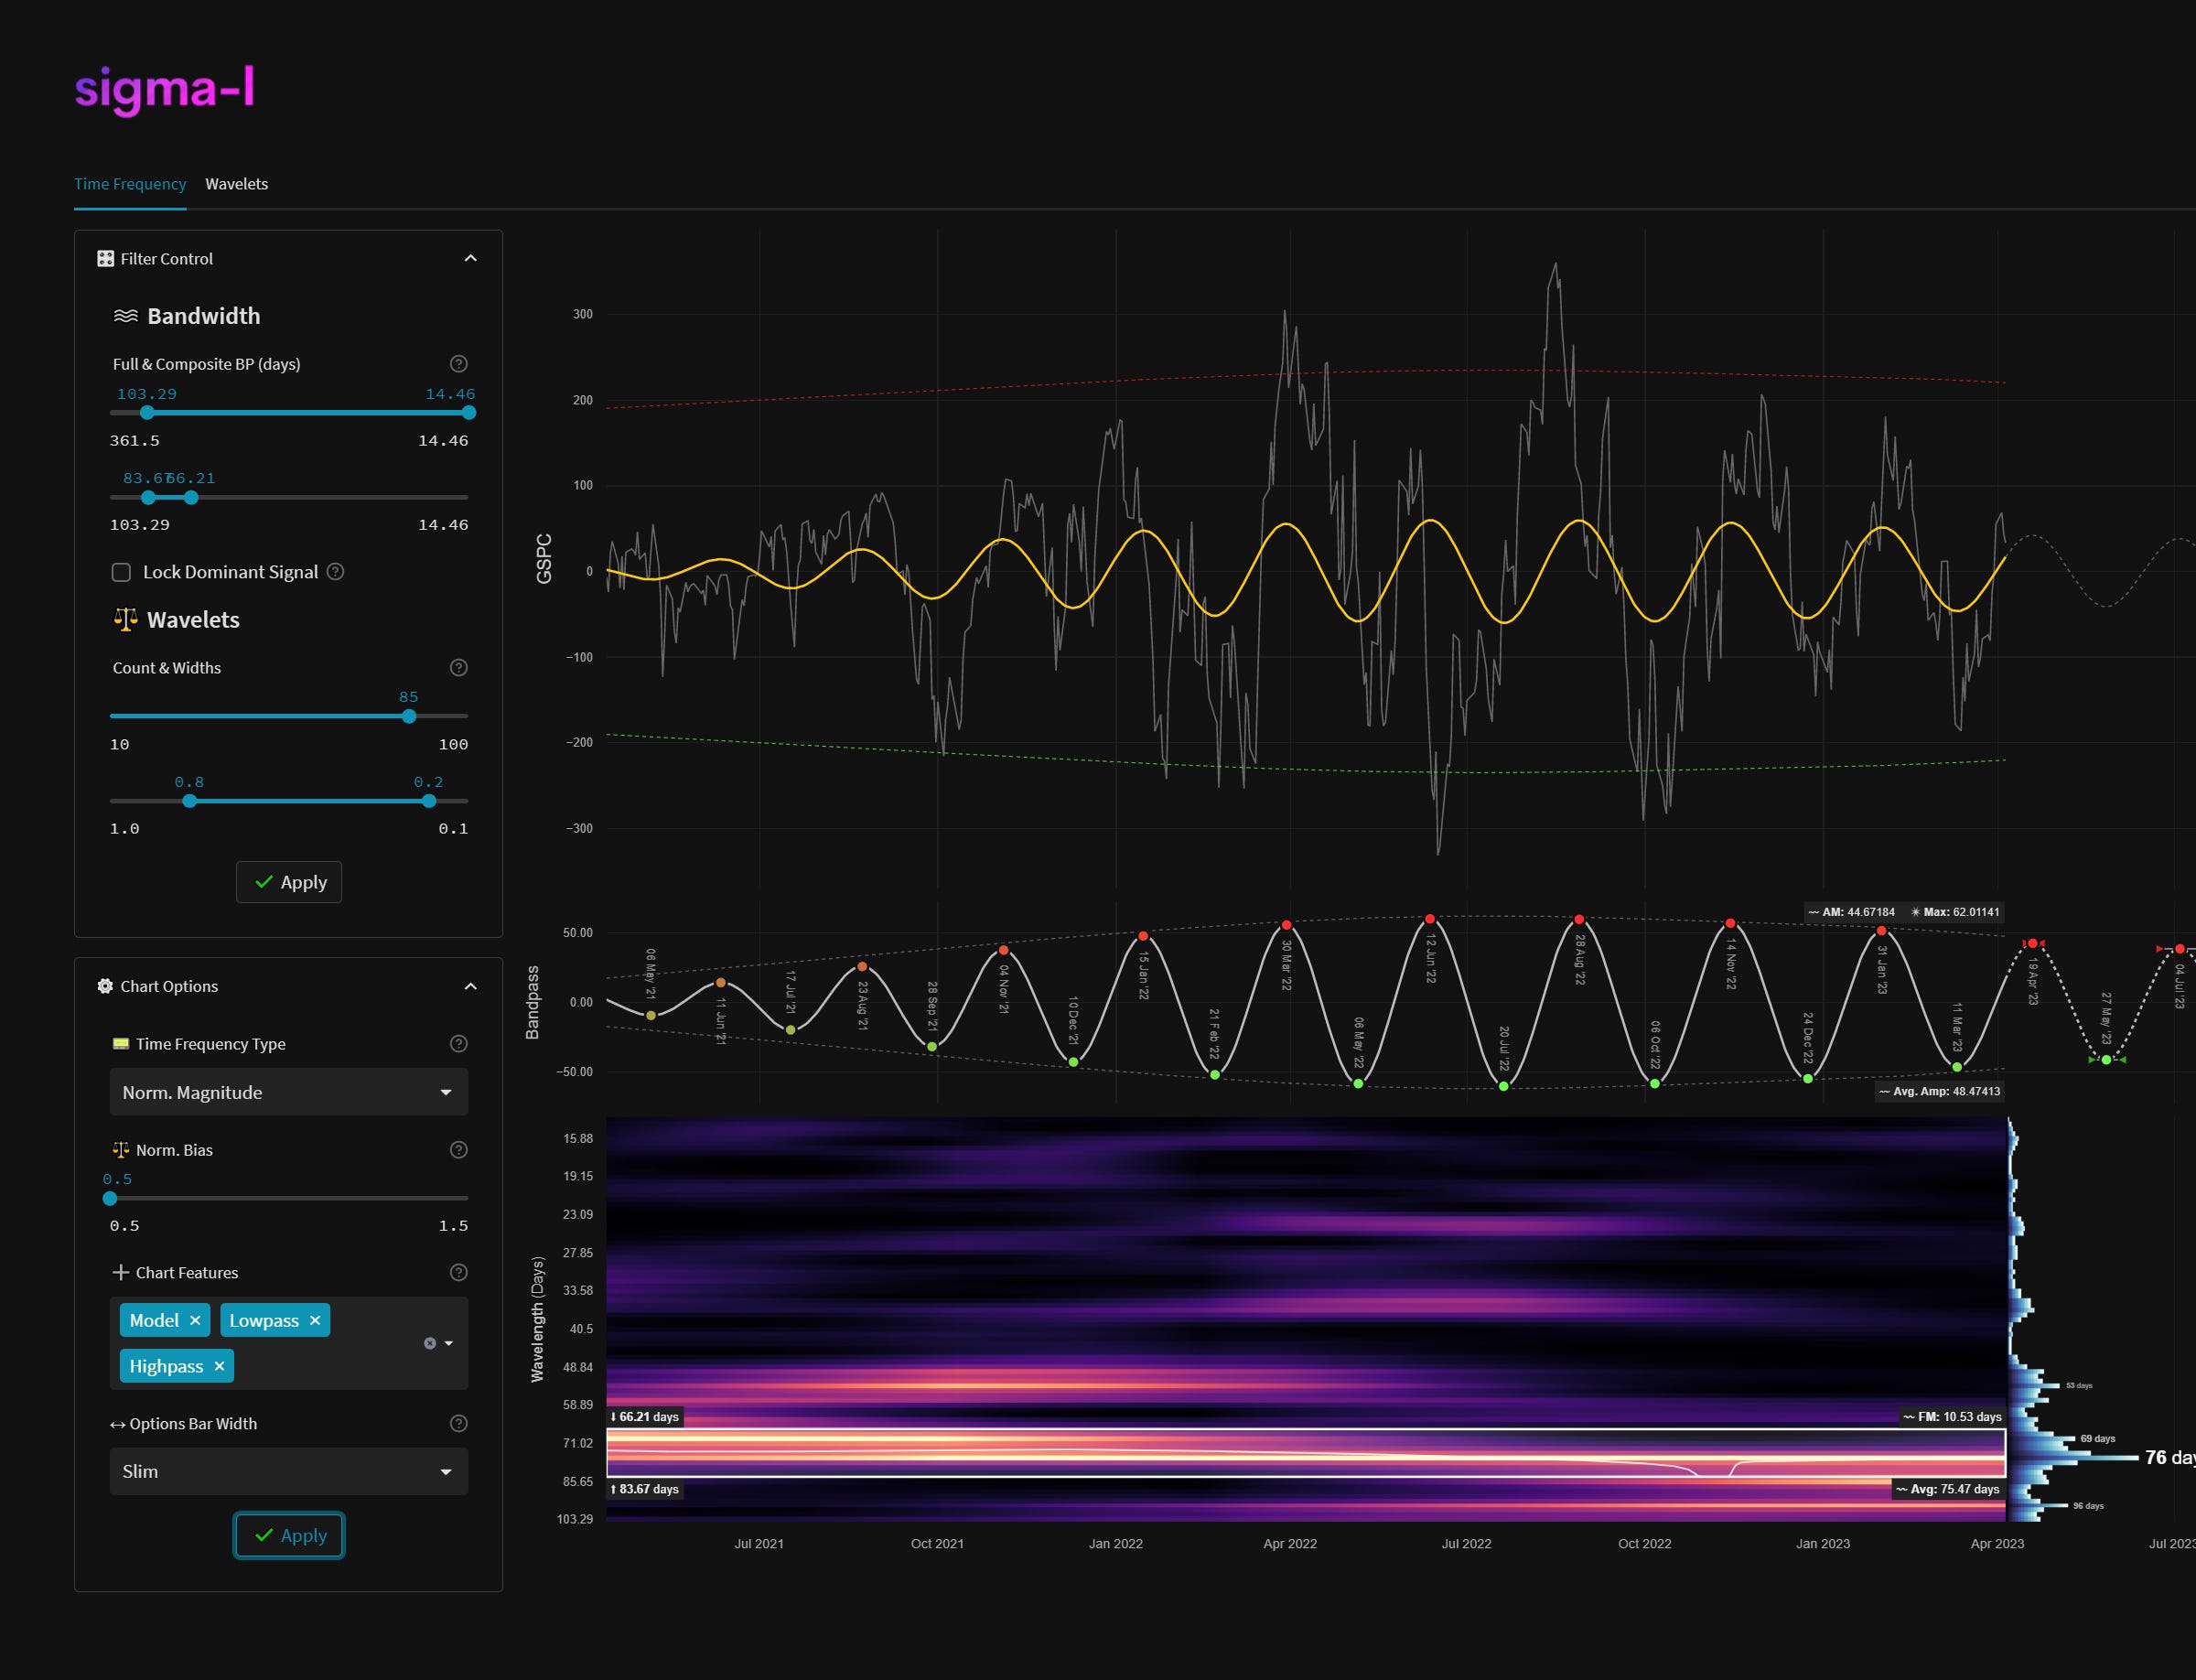
Back in late February we looked at the S&P 500 for signs of the 20 week nominal low, a wave that has been fairly coherent throughout the last two years. That low seems to have occurred in early March, reflecting a small increase in the frequency of the wave over the sample period. The time frequency analysis at the medium term (below) demonstrates the diffuse nature of this wave, indeed it interferes with the excellent component around 75 days (‘nominal’ 80 day wave) at some points. This is the cause of confusion for some Hurst advocates but it is the nature of periodic components in financial markets. They are not as static as some would portray but do occupy a distinct range of frequencies, that range is most easily discerned from a time frequency analysis where we can view the modulation over time.
So it is we come to a crucial peak, forming from now to over the next few weeks of both the 20 week and 80 day nominal components. The peaks of which, if the longer term phasing is accurate, should trigger the next stage of the descent into a larger component low, due later this year.
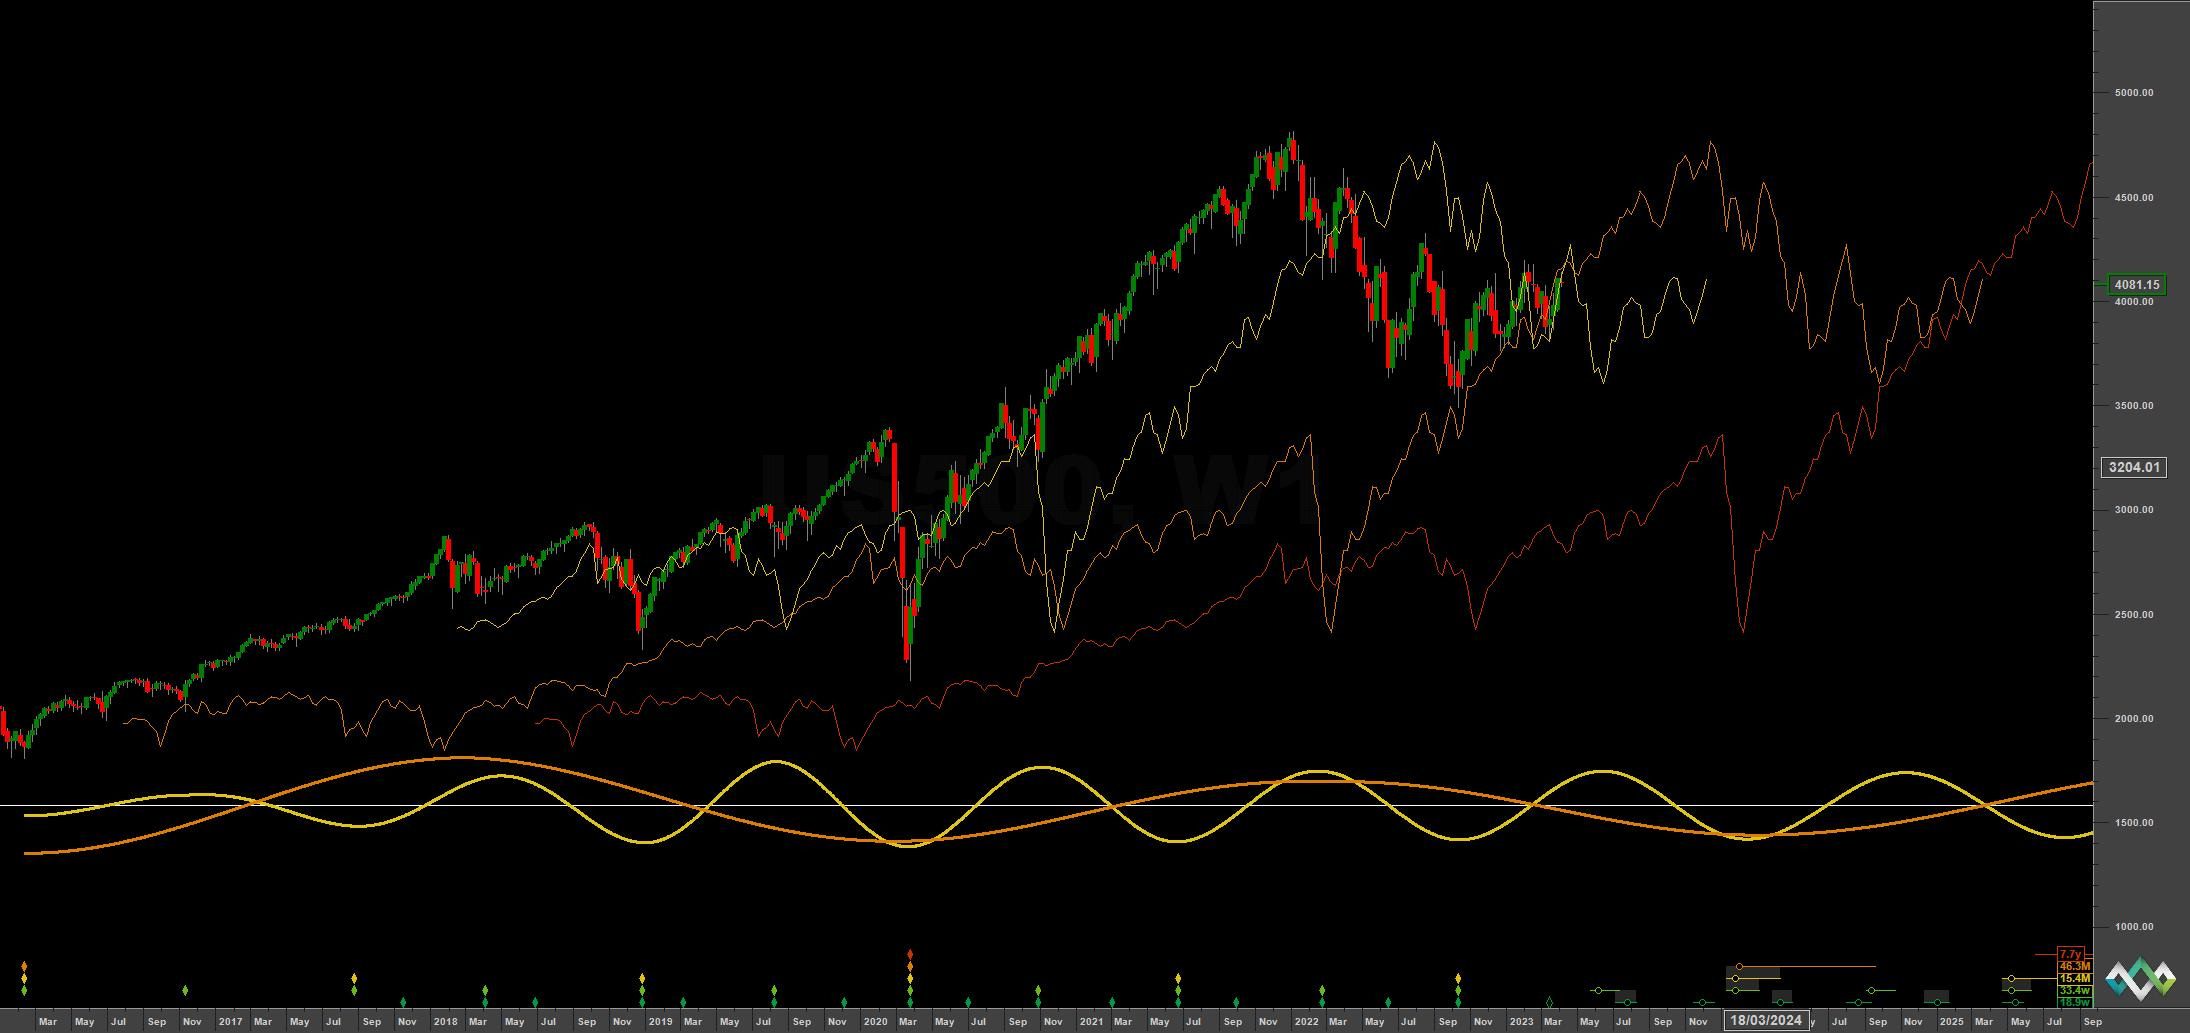
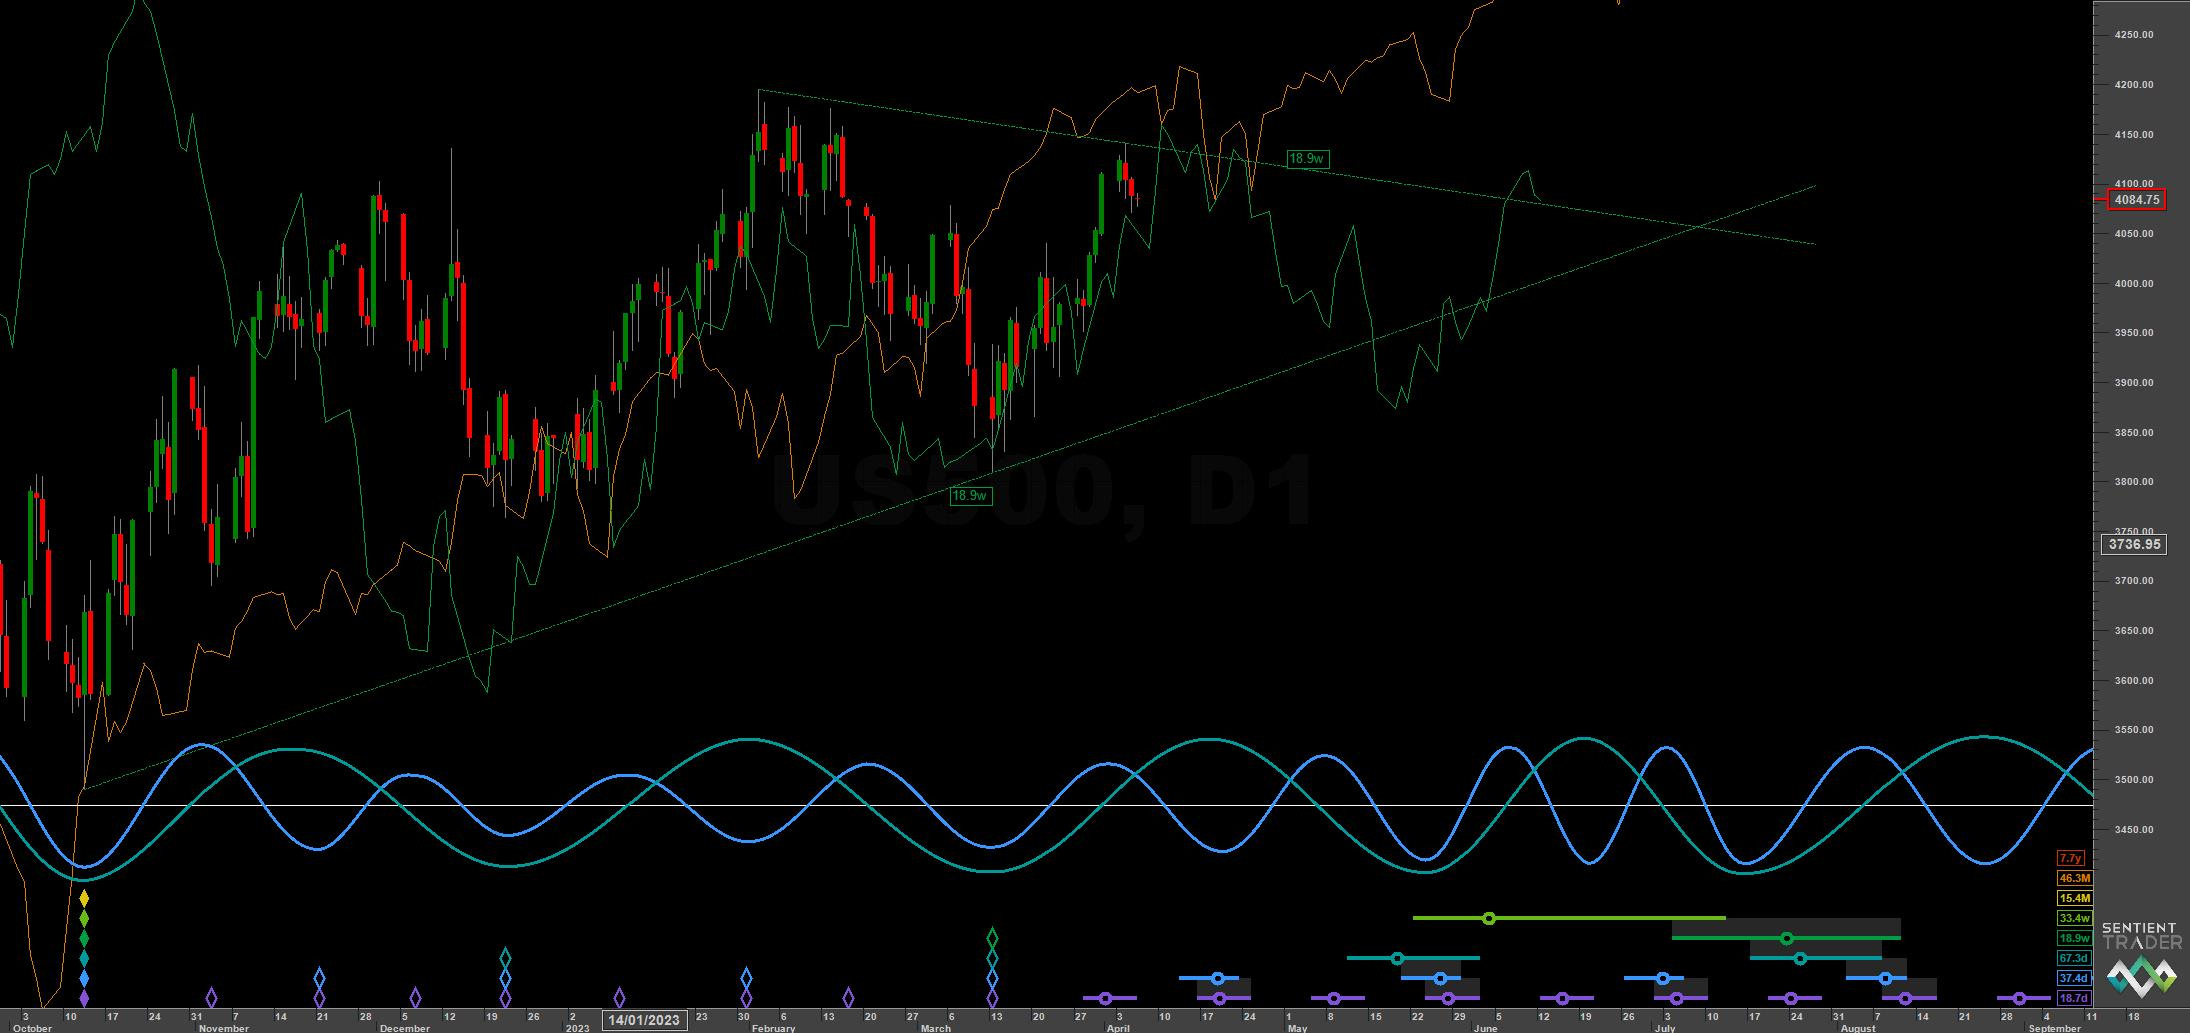
The longer component (around 1300 days from our TFA) is due a trough around August 2023, this will be refined as the shorter waves approach it in due course but from a sweep across a bandwidth of around 1700 days to 100 days, it really is the only signal in town. Sentient Trader’s own pattern based analysis makes a fair approximation of it too. Indeed it is the FLD shown on this chart that has been fascinating to us and readers over the last few months as price has found support here, prior to breaking through it recently on a weekly, median price basis. The target (from ST) is 3239, broadly finding support around the 9 year FLD, shown in red below.
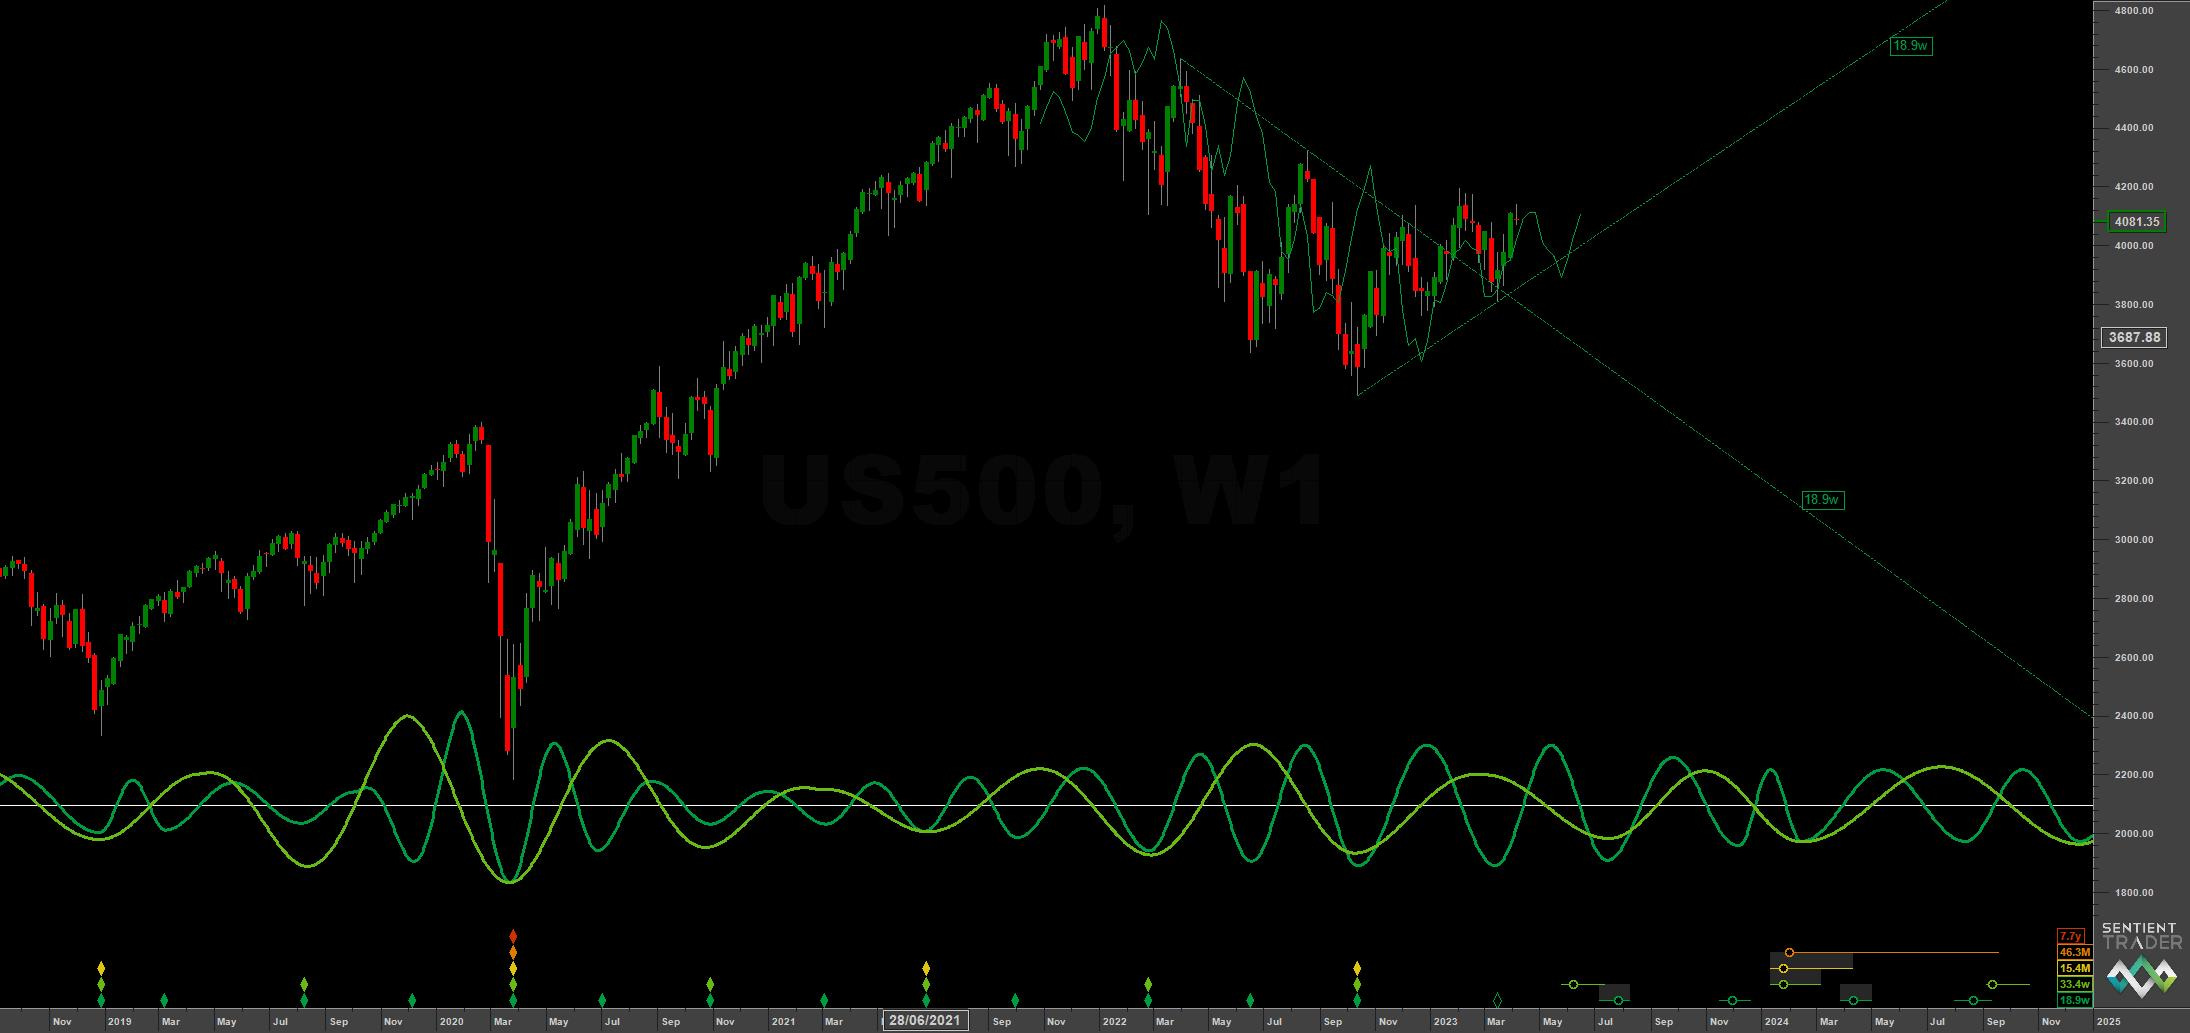
The excellent stationarity of the 80 day component in the last few iterations has enabled a nice upward 20 week VTL to be drawn on charts, shown on the medium term ST chart below. A median price, weekly breach of this VTL in the coming weeks and months will confirm the 40 week nominal peak, which may also be forming at this point in time in phase synchronicity with the 20 week wave. Price is, in general, tracking the 20 week FLD (shown on short term chart below) and it is a reasonable assumption that price, at this stage of the longer wave, will continue to track it in the downside of the 80 day component into May.
Phasing Analysis
Long Term
Components including and longer than the 18 month nominal wave
Medium Term
Components between the 20 week to 18 month nominal wave
Short Term
Components shorter than the 20 week nominal wave
Trading Strategy
Interaction Status
Interactions and price in the FLD Trading Strategy (Advanced). This looks at an idealised 40 week cycle and an array of 3 FLD signal cycles. We apply the instrument’s phasing to the model and arrive at an overall summary for the interactions with the 20 day FLD, current and forthcoming.
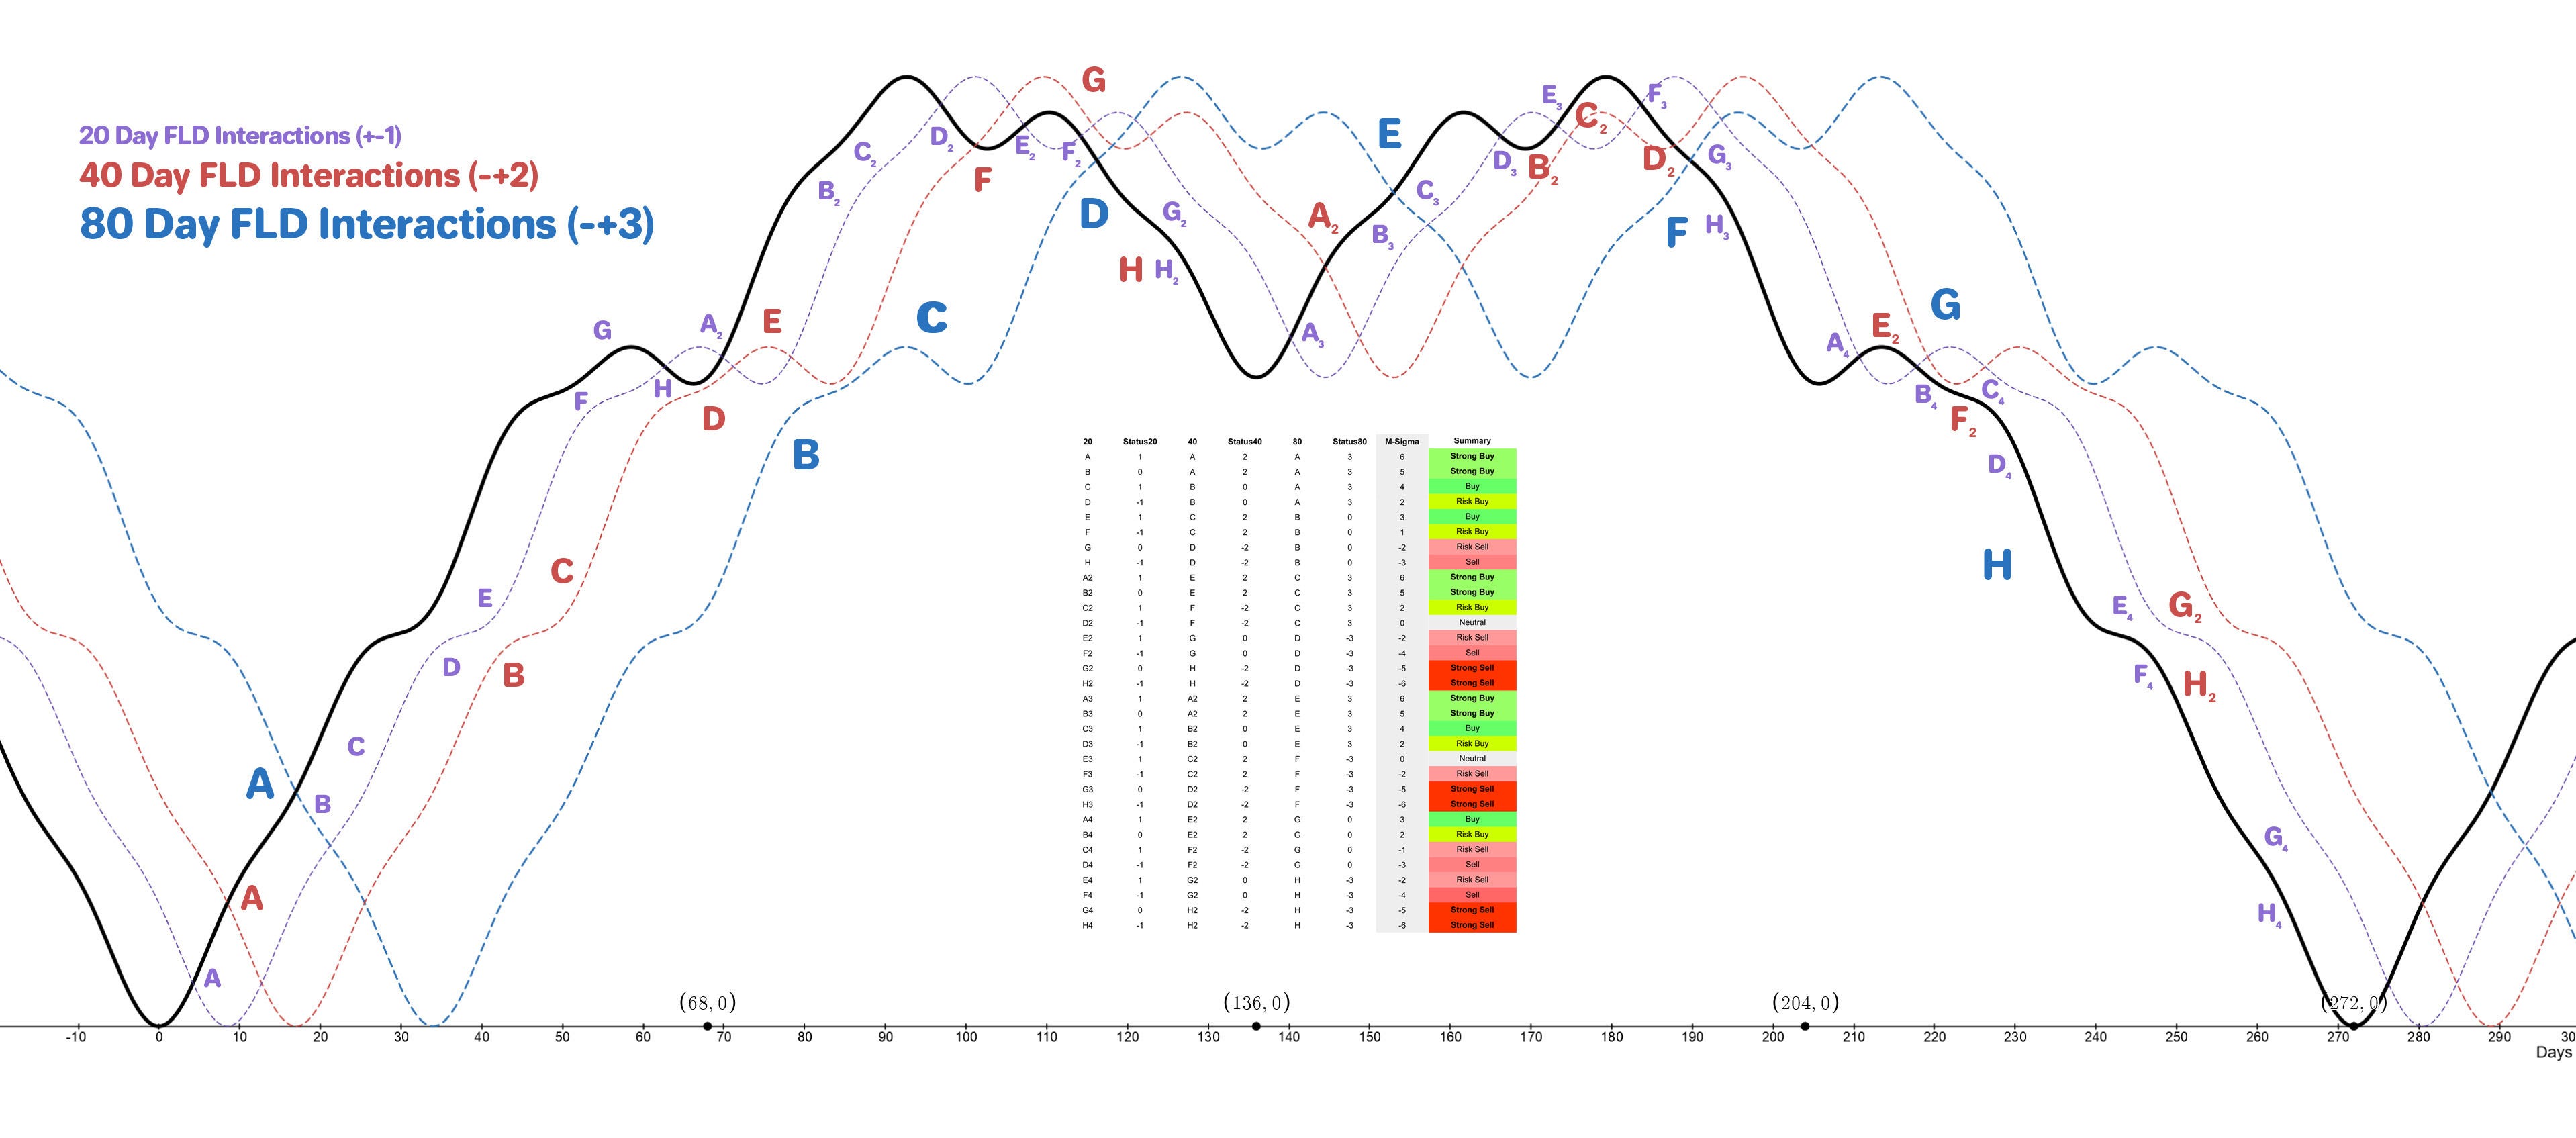
Sigma-L recommendation: Sell
Entry: 10 Day FLD / 20 Day FLD
Stop: Above forming 40 day / 80 day nominal peak
Target: 3850
Reference 20 Day FLD Interaction: D3
Underlying 40 Day FLD Status: B2
Underlying 80 Day FLD Status: E-F
Price is currently tracking the 20 week FLD and more broadly speaking still clinging to the 54 month FLD. Short term targets are down at 3850, if the longer term phasing is accurate this could also be a prime position to enter for the larger descent through most of 2023. Watch for a median, weekly price break of the upward 20 week VTL (shown above, short term ST chart) for confirmation of the 40 week nominal peak.
The next 80 day ‘nominal’ component trough is due mid-late May.
FLD Settings
If you do not have the use of Sentient Trader use these settings to plot common FLDs in your trading software (daily scale) to more easily follow trading signals and strategy from Sigma-L.
Make sure to account for non-trading days if your broker omits them in the data feed (weekends, for example). The below offsets are given with no added calculation for non-trading days.
80 day nominal: 67.3 days | 34 day FLD offset
40 day nominal: 37.4 days | 18 day FLD offset
20 day nominal: 18.7 days | 9 day FLD offset
10 day nominal: 9.6 days | 5 day FLD offset
Correlated Exposure
A non exhaustive list of correlated instruments for consideration
SPDR S&P 500 ETF Trust SPY 0.00%↑
iShares Core S&P 500 ETF IVV 0.00%↑
Vanguard S&P 500 ETF VOO 0.00%↑
SPDR Portfolio S&P 500 ETF SPLG 0.00%↑
Direxion Daily S&P 500 Bull 3X Shares SPXL 0.00%↑
Direxion Daily S&P 500 Bear 3X Shares SPXS 0.00%↑
ProShares UltraPro Short S&P500 SPXU 0.00%↑
ProShares UltraPro S&P500 UPRO 0.00%↑