ΣL September 2023 Results & October Preview
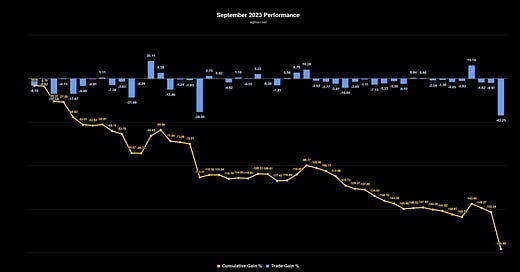
The Sigma-L portfolio saw a nominal loss of 195.49% (normalised -31.84%) in September 2023 via 49 trades. We also look at October's schedule, where we will be updating 44 reports across the month
ΣL September 2023 Performance
Covering trade reports posted in September 2023 on Sigma-L.
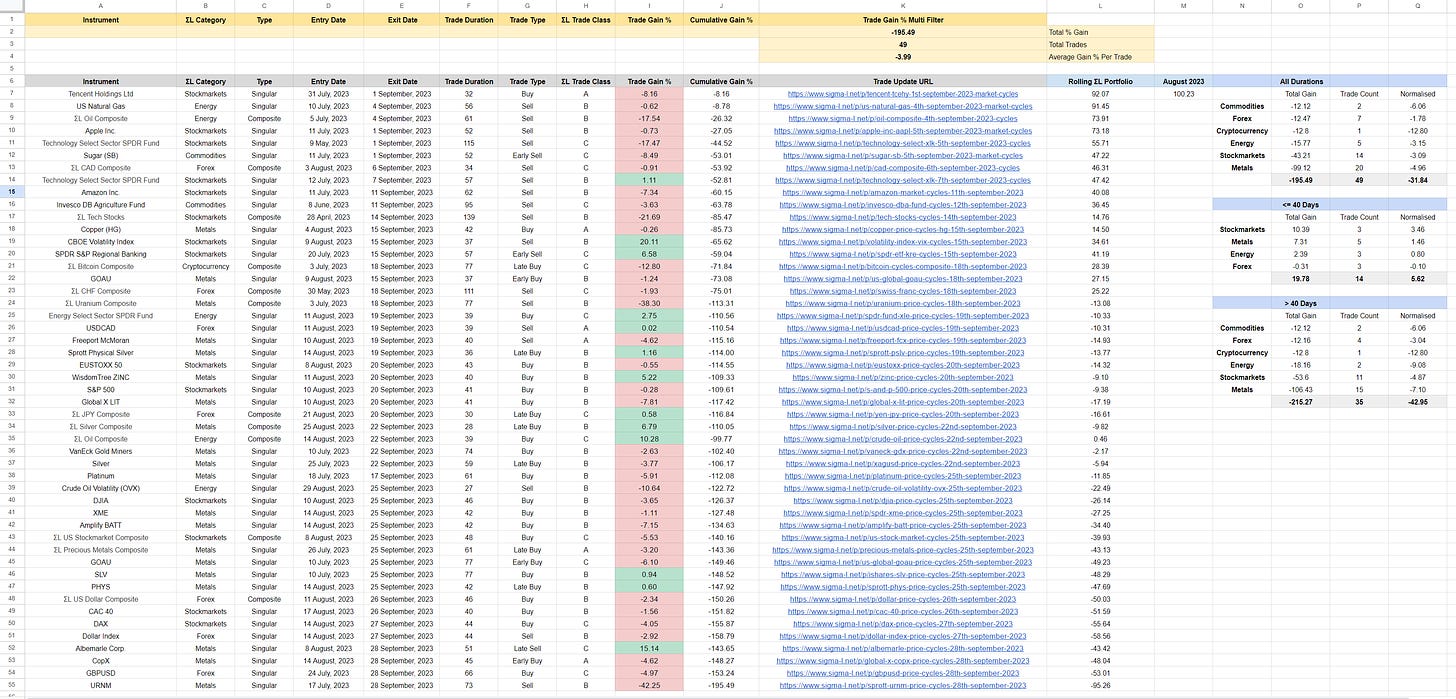
View the full trade list and details in Google Sheets
Headline Numbers
Sigma-L Nominal vs Benchmarks - September 2023
S&P 500 (-4.84%): -190.65%
Gold (-4.70%): -190.79%
WTI Crude Oil (8.80%): -204.29%
Bitcoin (4.62%): -200.11%
Monthly Breakdown


Total Nominal Gain: -195.49%
Total Normalised Gain: -31.84%
Total Trades: 49
Win:Loss Ratio: 0.36:1 (13:36)
Average Gain Per Trade: -3.99%
Win Percentage: 27%
Average Win: 5.48% / Average Loss: -7.41%
Average Duration: 55 Days
Breakdown by Direction & ΣL Category

Sell Side (Nominal)
Total Gain: -136.12% / Trade Count: 20 / Win:Loss Ratio: 0.33:1 (5:15)
Average Gain Per Trade: -6.81%
Win Percentage: 25%
Average Win: 8.59% / Average Loss: -11.94%
Average Duration: 64 Days
Biggest Win: 20.11% → Sell - CBOE Volatility Index 9th August 2023
Biggest Loss: -42.25% → Sell - URNM 17th July 2023
Buy Side (Nominal)
Total Gain: -59.37% / Trade Count: 29 / Win:Loss Ratio: 0.38:1 (8:21)
Average Gain Per Trade: - 2.05%
Win Percentage: 28%
Average Win: 3.54% / Average Loss: -4.18%
Average Duration: 48.1 Days
Biggest Win: 10.28% → Buy - ΣL Oil Composite 14th August 2023
Biggest Loss: -12.80% → Late Buy - ΣL Bitcoin Composite 3rd July 2023Nominal / Normalised Gain By ΣL Category (Trade Count)
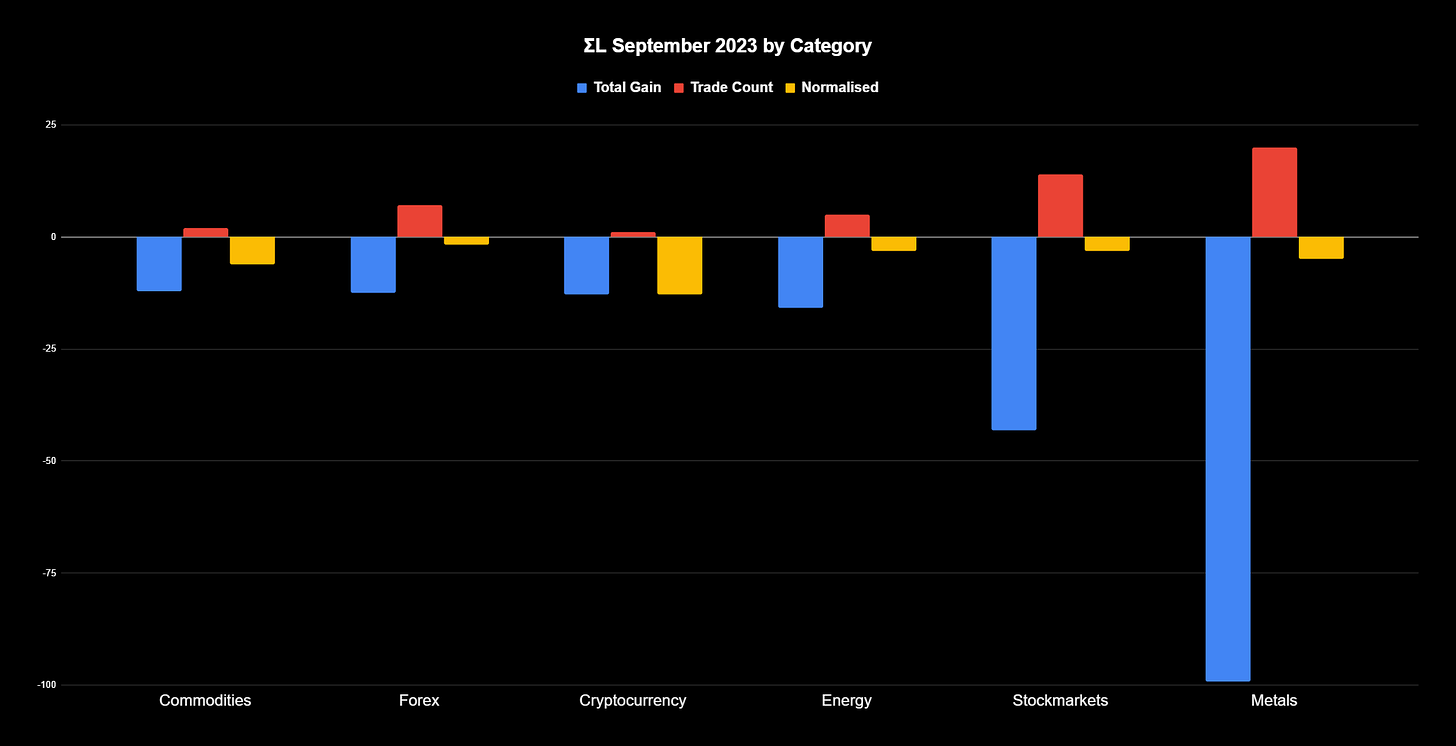
Commodities: -12.12% / -6.06% (2)
Forex: -12.47% / -1.78 (7)
Cryptocurrency: -12.8% / -12.8 (1)
Energy: -15.77% / -3.15% (5)
Stock Markets: -43.21% / -3.09 (14)
Metals: -99.12% / -4.96% (20)
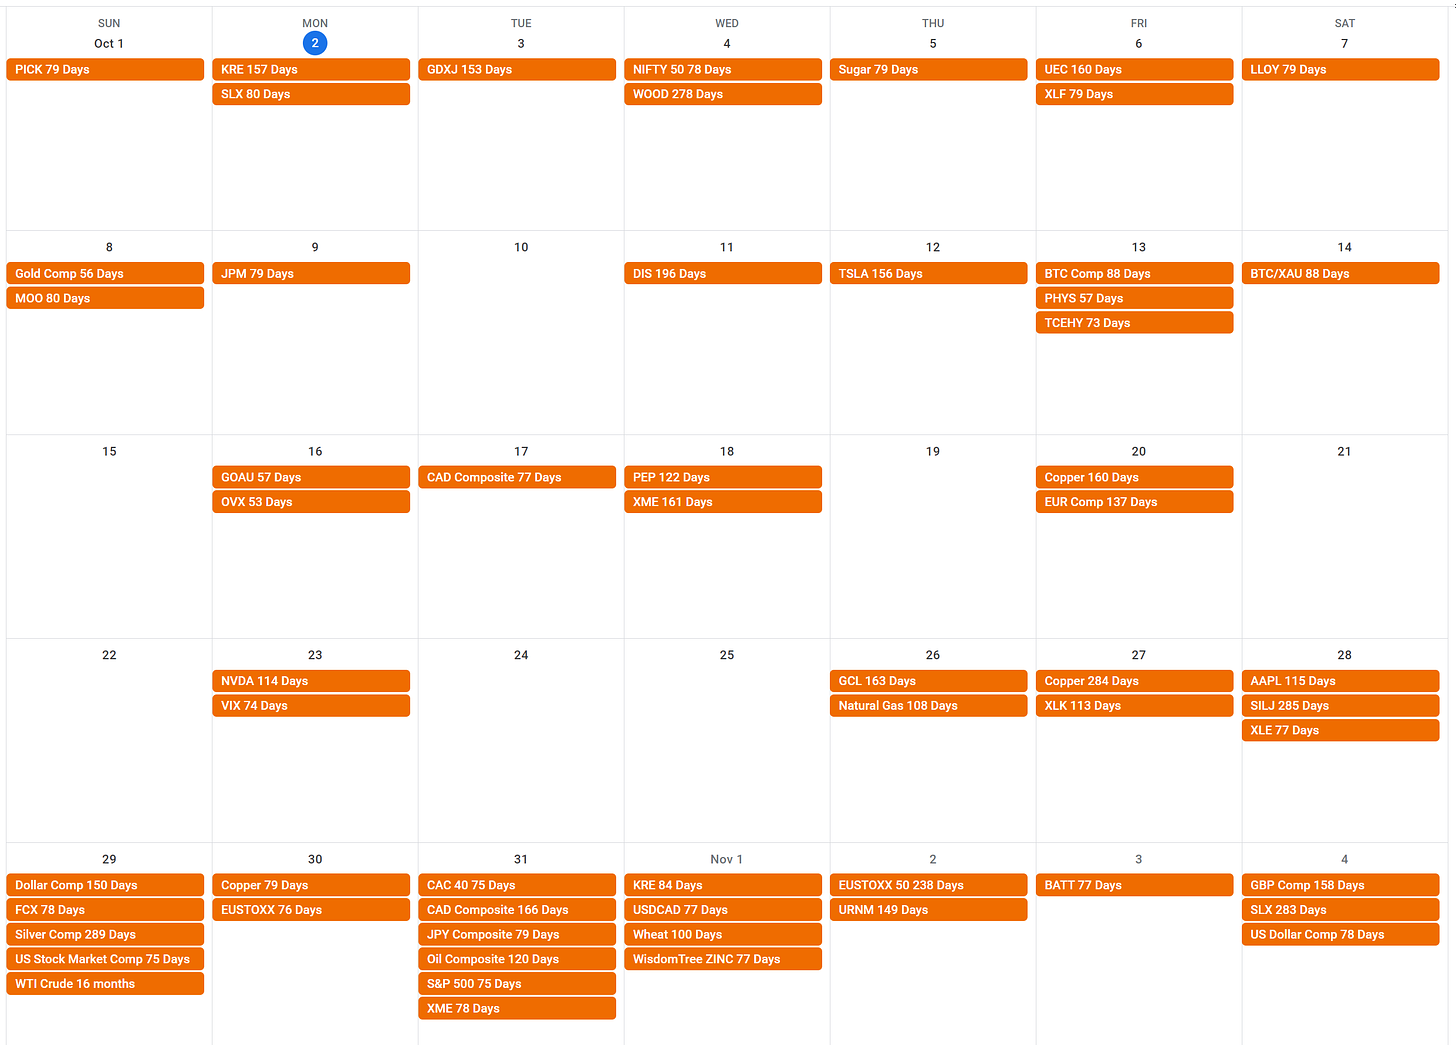
Dates for your Diary - October 2023
ΣL October 2023 Highlights
September saw, on the surface figures at least, a heavy loss summed across the collection of instruments we report on. On closer inspection the main outlier contributors to losses came from Uranium, in which a larger degree low has likely occurred back in April 2023, outlined back in November 2022. Of course one should also note the highly correlated nature of many of the instruments - the portfolio contains several different and correlated stock markets, forex pairs, metals and energy related instruments. This is to cater for all the requests we have for reporting, some subscribers have a particular favourite index, etf, forex pair or stock to watch.
To remove some of the correlation bias which reflects the commonality between instruments (for example 5 different stock indices which exhibit the same periodic component), we have introduced a normalised figure to the reports. This is simply the overall average of gain per category.
In this case the loss in metals moves from 99.12% to 4.96% (over 20 trades in September) as the effect of outliers/correlated instruments is largely removed.
Keen readers will also note that the average duration of trades generally reflects a bias toward the highly prevalent ‘80 day nominal’ component across many markets. Indeed for trades <= 40 days (~ half the average of this component), the portfolio returned a gain of 19.28% (normalised 5.62%) over 14 trades.
This is now detailed in the Google sheets accompanying the report and we will make this a regular feature going forward for further accuracy.
Note: for component time targets that fall on a Saturday or Sunday, we will generally update these on the preceding Friday or following Monday.
Monday 2nd October - VanEck Steel ETF 80 Days
With most eyes on recent bearish moves in Gold (see PHYS, for example) and Silver, it is also worth looking at some of the utility metals. Steel, reflected via SLX, has a beautiful periodic component around 80 days, due to peak shortly.
Wednesday 4th October - NIFTY 50 78 Days
The rolling over of the ‘80 day nominal component’ in global stock markets is well on the way. For the benefit of many of our Indian subscribers, the NIFTY 50 also reflects this periodic feature.
Sunday 8th October - Gold Composite 56 Days
The beacon signal (circa 55 days) in Gold approaches another low iteration with larger components also pushing down. For Gold bulls a possible bear market rally in prospect?
Friday 13th October - Bitcoin Composite 88 Days
Since June 2022 Bitcoin vs major fiat currencies has largely moved sideways, relative to past amplitude. This has enabled the component around 88 days to dominate proceedings, creating a reliable and detectable signal. The component is due to peak early-mid October and will be of interest to cryptocurrency investors.
Monday October 23rd - CBOE Volatility Index 74 Days
Reflecting an inverse relationship with the prominent component in stock markets around 75 days, the main periodic signal of interest in the VIX is highly frequency stationary. Keep an eye on this around the end of October to signal the end of a volatile few weeks ahead.
Sunday 29th October - WTI Crude Oil 16.3 Months
One of the best and most coherent long term signals in all markets, the component around 16 months in Oil (WTI Crude in this case) is due a peak toward the end of October. Definitely worth keeping an eye on as this will have implications for all kinds of economic metrics.


