S&P 500: Hurst Cycles - 30th September 2022
Price continues decline in bear market after brief bounce from the 80 day nominal low. The anticipated 18 month nominal low is almost upon us. In this report we examine the final stages
Tools required: Nominal Model | FLD | FLD Trading Strategy | FLD Trading Strategy (Advanced) | Principle of Nominality | Underlying Trend
Analysis Summary
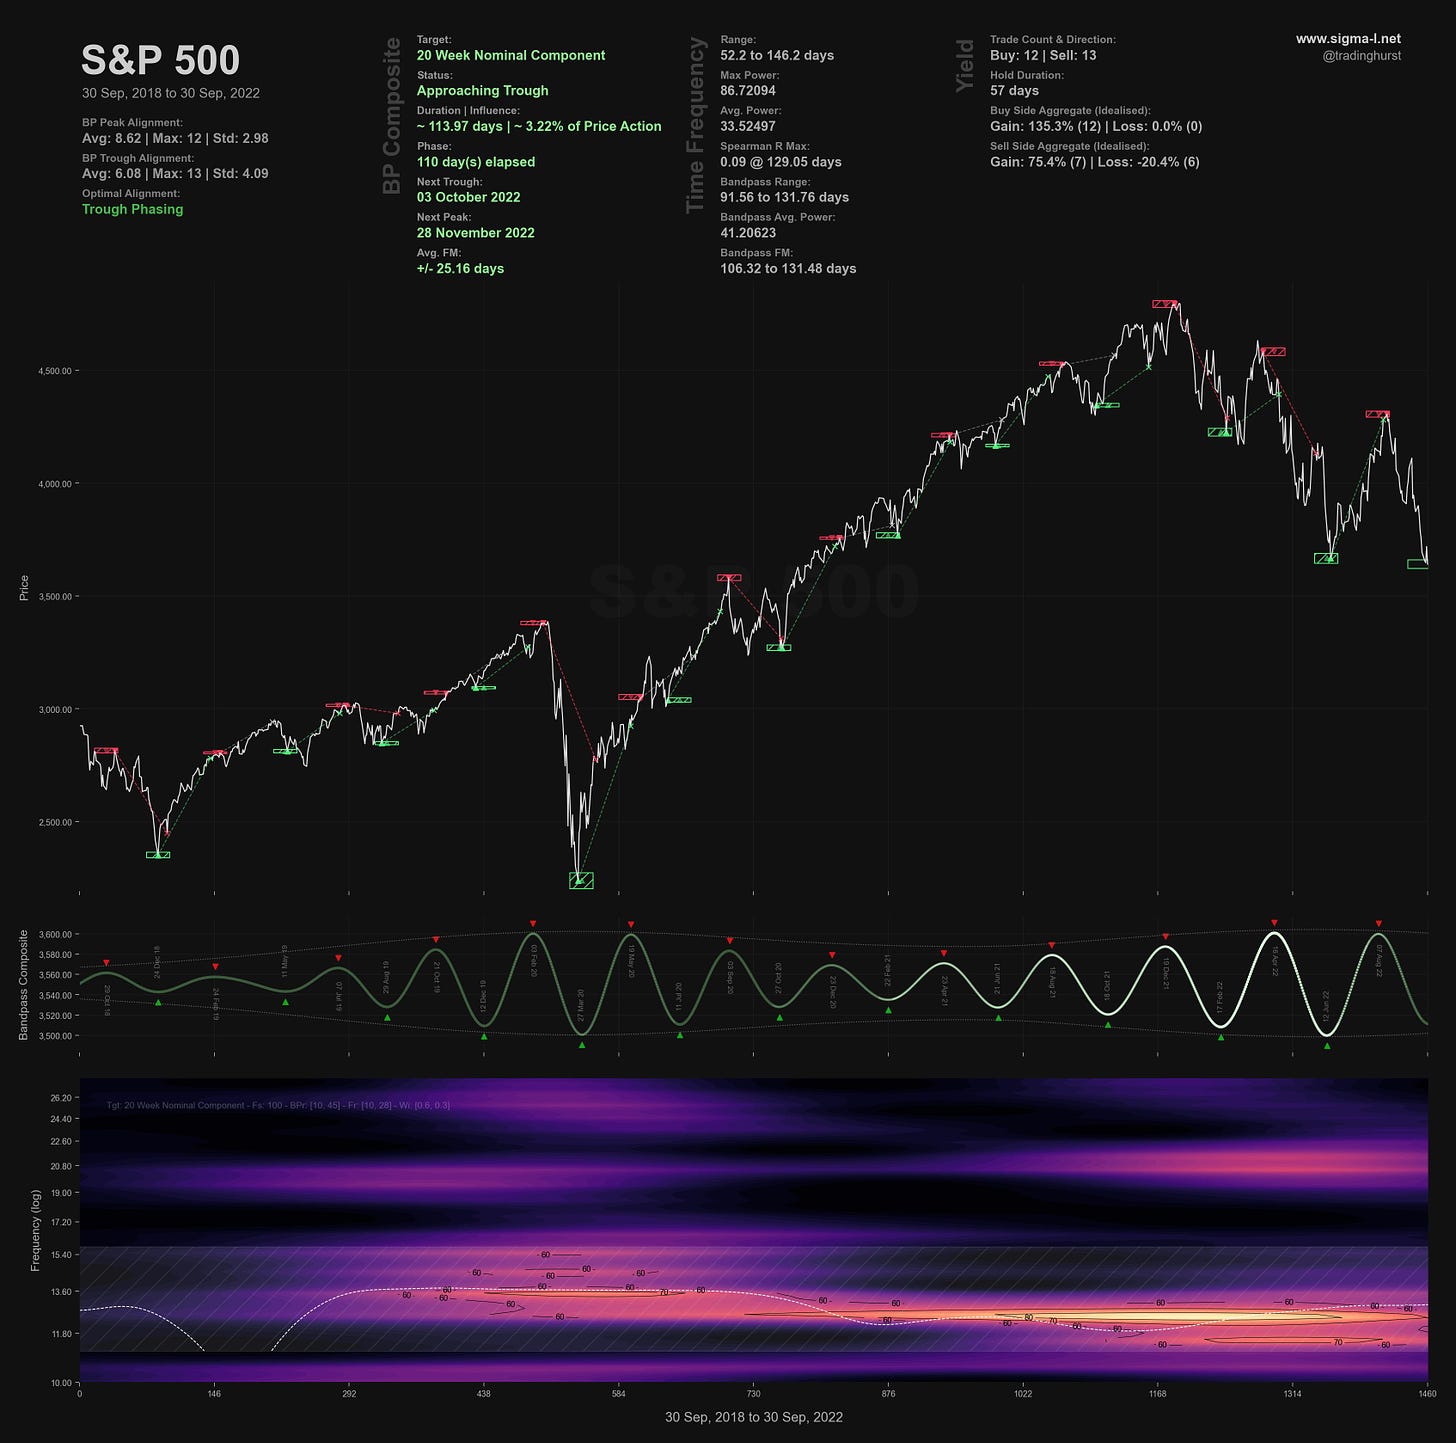
Price made the 80 day nominal low on the 7th of September and briefly bounced to our target of 4100, before falling rapidly within the first 20 day component. This is typical of the final stages of a larger bearish component, with capitulation increasingly evident. The 20 week component, shown on the time frequency analysis below and an excellent, consistent signal, approaches it’s latest trough iteration imminently.
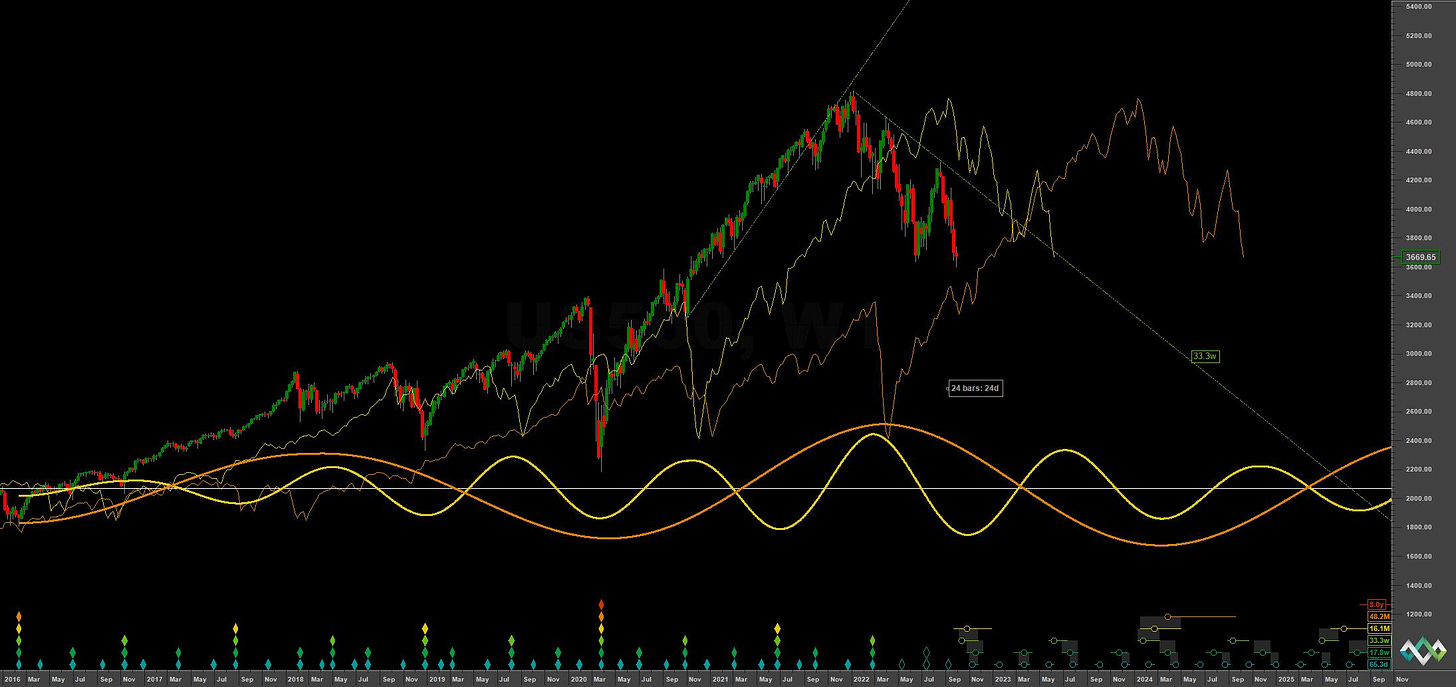
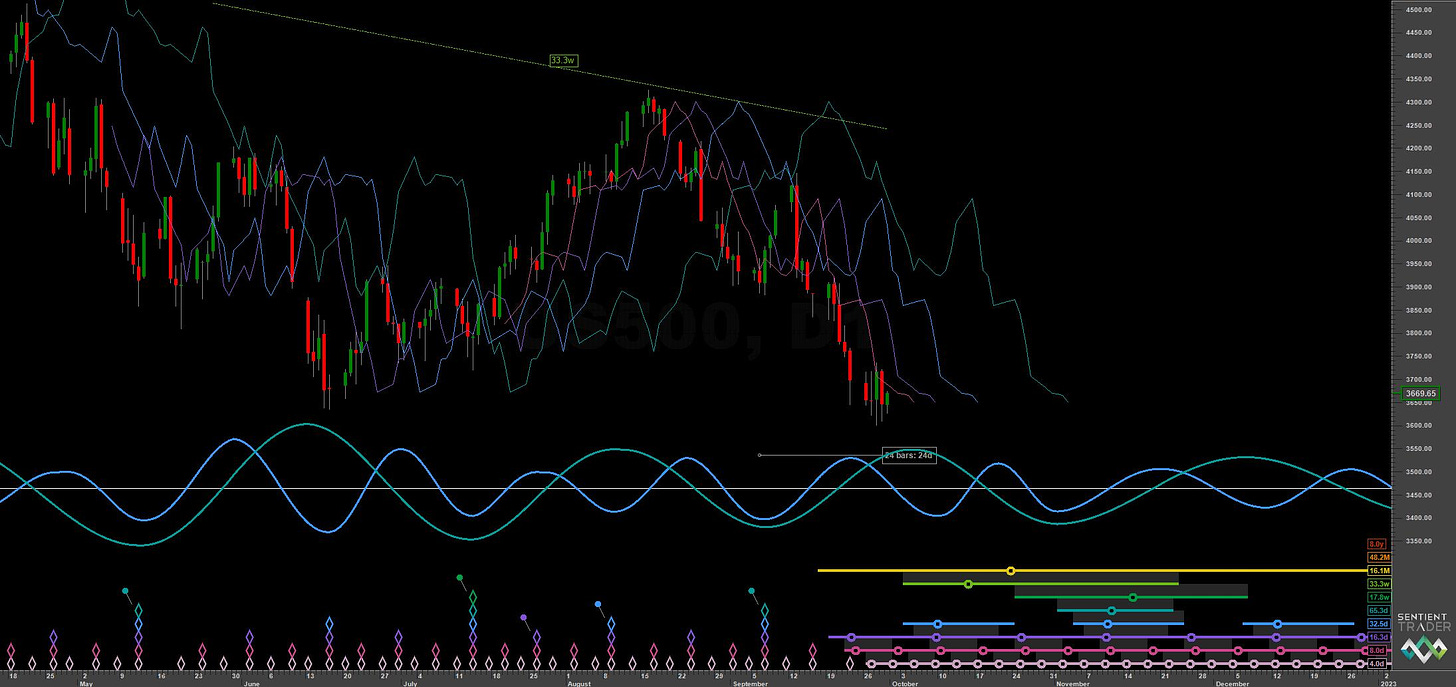
The current short term phasing suggests a 40 day nominal low is due in the coming days. There is an outlier possibility it is also of 80 day magnitude and, by the principle of synchronicity, also the 20 / 40 week / 18 month nominal lows. The fact price has not yet reached the 54 month FLD (orange on long term chart) suggests a little more downside to come and the accuracy of the current short term phasing. Other evidence is the position of the 40 day FLD peak, currently directly above price (see short term chart) - a sign that we should expect a trough of only 40 day magnitude within the next few days.
The downturn since early 2022 has seen an increase in the 20 week component’s amplitude and that is something we have taken advantage of, not least in anticipating resistance at the 40 week FLD (shown on the medium term chart). The time frequency analysis shows a good signal for this component, running at around 16-18 weeks average wavelength from the sample and Sentient Trader’s analysis. Assuming the area around early July was the previous 20 week nominal low we are certainly in the nest of lows (average frequency modulation!) for the next trough of this component.
The longer term picture looks established with a peak of the 54 month component in early 2022, assuming the low in 2020 was also of 54 month magnitude (48.2 months average wavelength). The move from the incoming 18 month nominal low will be expected to track the 54 month FLD up, likely to the 18 month FLD resistance (yellow, long term chart). This is prior to more bearish action around the middle of next year when, if the long term phasing is correct, things will get very intense indeed.
At this point in time the 54 month nominal low can be estimated to occur in the first quarter of 2024.
Phasing Analysis
Long Term
Components greater than and including the 18 month nominal cycle
Medium Term
Components less than and including the 18 month nominal cycle
Short Term
Components around the 80 day nominal cycle
Time Frequency
Wavelet convolution output targeting 20 week nominal component

Trading Strategy
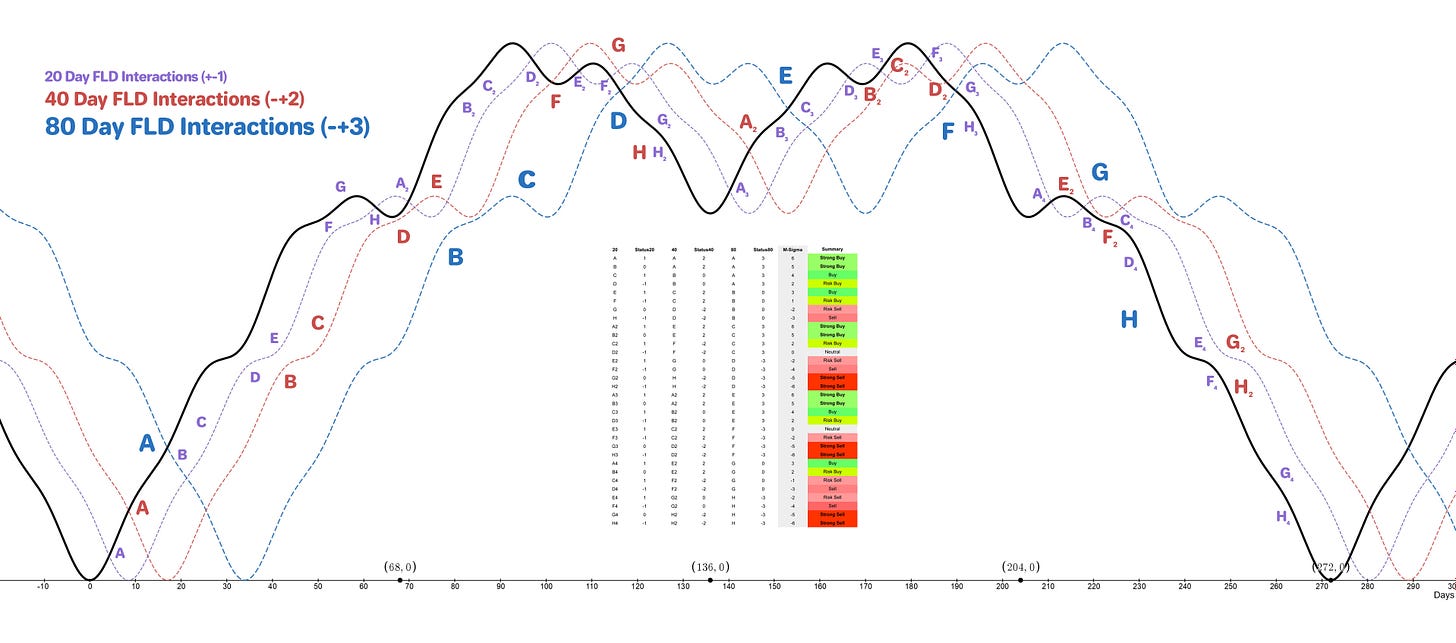
Interaction Status
Interactions and price in the FLD Trading Strategy (Advanced). This looks at an idealised 40 week cycle and an array of 3 FLD signal cycles. We apply the instrument’s phasing to the model and arrive at an overall summary for the interactions with the 20 day FLD, current and forthcoming.
Sigma-L recommendation: Neutral / Risk Buy
Entry: 20 Day FLD
Stop: Below formed 40 day nominal low
Target: 3800 or 40 day FLD resistance
Reference 20 Day FLD Interaction: E4
Underlying 40 Day FLD Status: G2
Underlying 80 Day FLD Status: H
Interactions are given assuming the incoming 40 day nominal low is not also the 80 day nominal low (and phased 18 month low). Price action should be lacklustre if the phasing is accurate and traders may wish to enter short after signs of resistance at either the 20 or 40 day FLDs for the final move down into mid-late October.
Should this be the larger nominal low the move up will be very strong but this is the outlier as described above and defined by commonality from other equity indices.
In both cases the next 40 day nominal low will be a strong buy.
FLD Settings
If you do not have the use of Sentient Trader use these settings to plot FLDs in your trading software (daily scale) to more easily follow trading signals and strategy from Sigma-L.
Make sure to account for non-trading days if your broker omits them in the data feed (weekends, for example). The below offsets are given with no added calculation for non-trading days.
80 day nominal: 65.3 days | 33 day FLD offset
40 day nominal: 32.5 days | 16 day FLD offset
20 day nominal: 16.3 days | 8 day FLD offset
10 day nominal: 8 days | 4 day FLD offset
Correlated Exposure Options
A non exhaustive list of correlated instruments for consideration
SPDR S&P 500 ETF Trust SPY 0.00%↑
iShares Core S&P 500 ETF IVV 0.00%↑
Vanguard S&P 500 ETF VOO 0.00%↑
SPDR Portfolio S&P 500 ETF SPLG 0.00%↑
Direxion Daily S&P 500 Bull 3X Shares SPXL 0.00%↑
Direxion Daily S&P 500 Bear 3X Shares SPXS 0.00%↑
ProShares UltraPro Short S&P500 SPXU 0.00%↑
ProShares UltraPro S&P500 UPRO 0.00%↑


Hi David. Has the index reached the 40 week FLD in this rebound or it is still resistance? Thanks