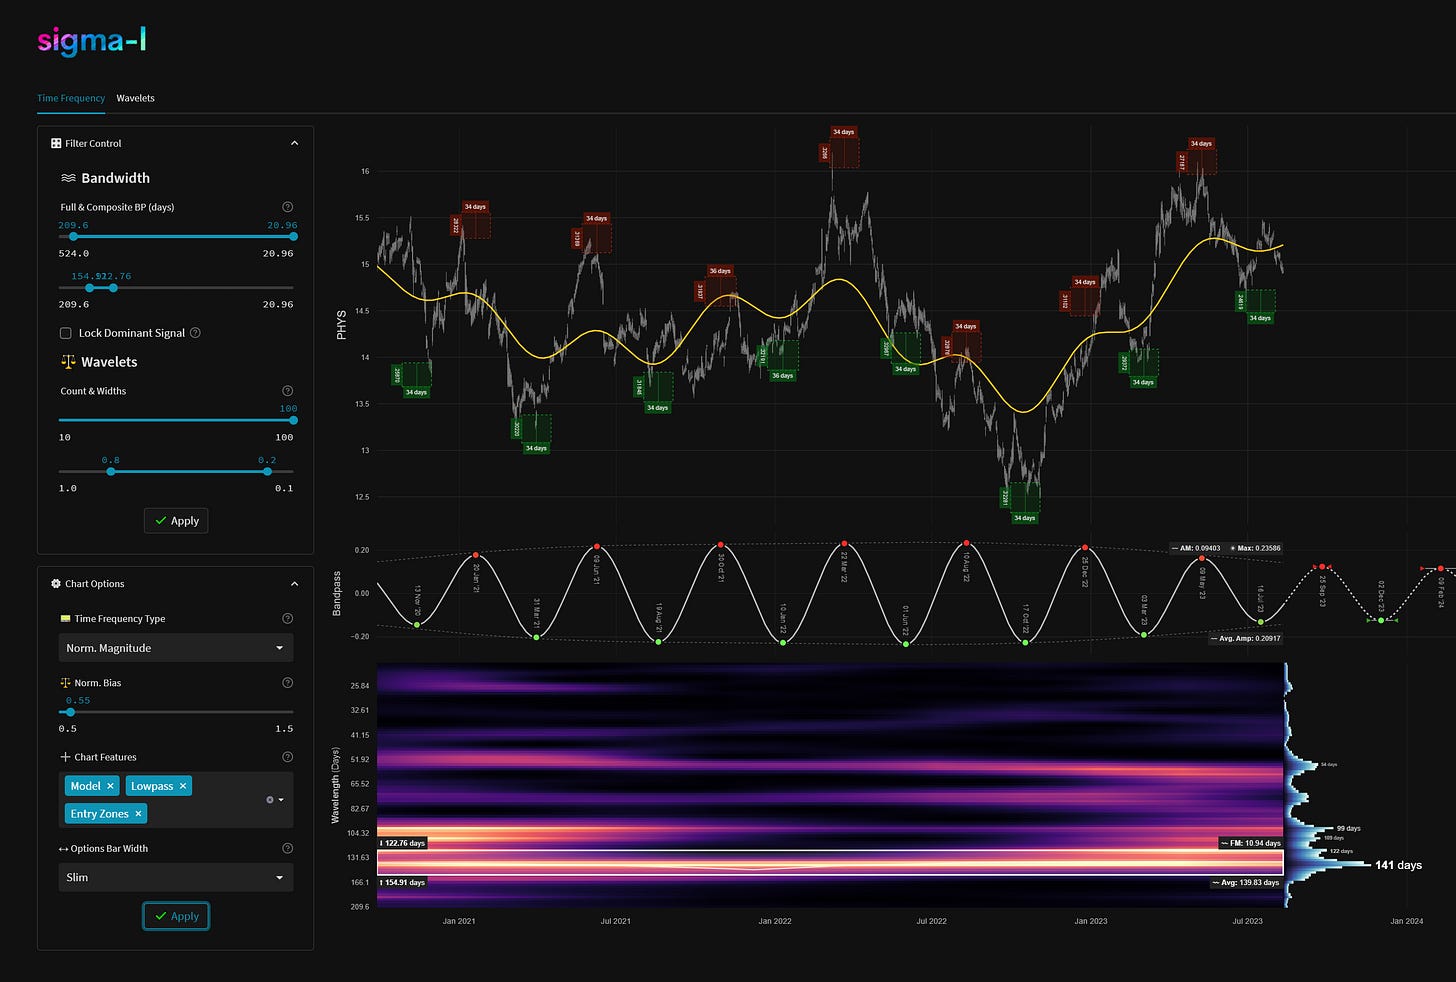
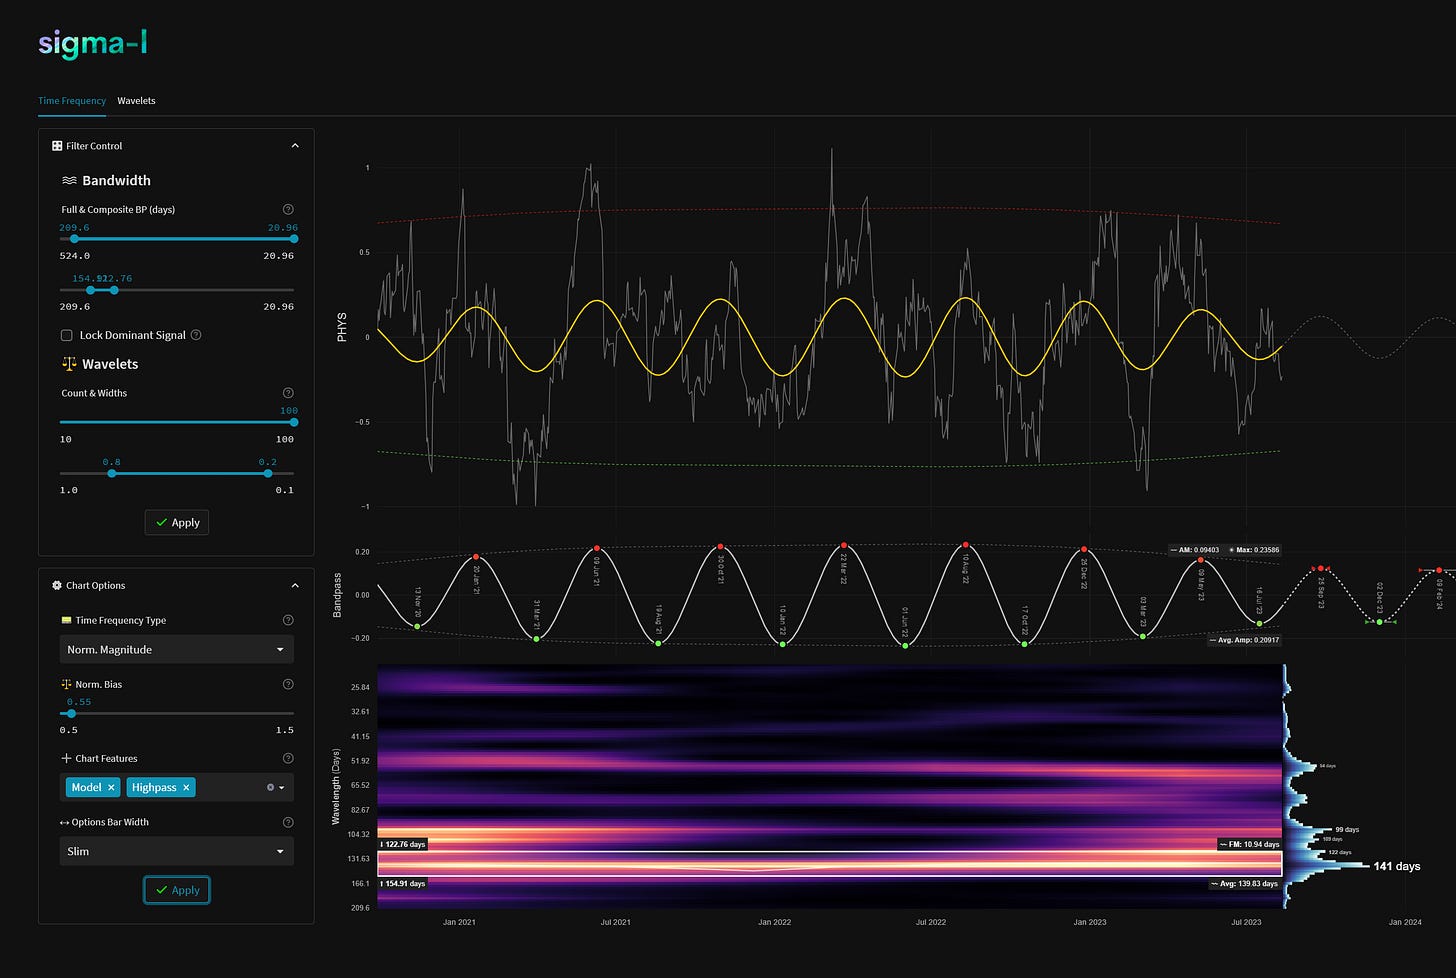
Sprott Physical Gold Trust (PHYS) - 14th August 2023 | @ 140 Days
'B' class signal detected in Sprott Physical Gold Trust (PHYS). Running at an average wavelength of 140 days over 8 iterations since October 2020. Currently hard up.
Instrument Summary
The PHYS ETF is a fund managed by Sprott that seeks to provide investors with exposure to physical gold bullion. It holds allocated gold stored in secure vaults and offers a convenient way to invest in gold without needing to directly own and store the metal. The fund's value reflects changes in the price of gold, making it a popular choice for those interested in precious metals.
Current Signal Status
Defining characteristics of the component detected over the sample period.
Detected Signal Class: B - learn more
Average Wavelength: 139.83 Days
Completed Iterations: 8
Time Frequency Analysis
Time frequency charts (learn more) below will typically show the cycle of interest against price, the bandpass output alone and the bandwidth of the component in the time frequency heatmap, framed in white. If a second chart is displayed it will usually show highpassed price with the extracted signal overlaid for visual clarity.
Current Signal Detail & Targets
Here we give more detail on the signal relative to speculative price, given the detected attributes of the component. In most cases the time target to hold a trade for is more important, given we focus on cycles in financial markets. Forthcoming trough and peak ranges are based upon the frequency modulation in the sample (learn more).
Phase: Hard Up
FM: +- 11 Days
AM: 0.09403
Next Trough Range: 21st November - 13th December, 2023
Next Peak Range: 14th September - 6th October, 2023
Sigma-L Recommendation: Late Buy
Time Target: ~ 25th September, 2023
Current Signal Phase
This is ‘how far along’ the cycle is in it’s period at now time and is related to the predicted price action direction.
Current Signal Frequency Modulation (FM)
This is how much, on average, the signal detected varies in frequency (or wavelength) over the whole sample. A lower variance is better and implies better profitability for the component. Frequency usually modulates relatively slowly and over several iterations.
Current Signal Amplitude Modulation (AM)
This is how much the component gains or loses power (price influence) across the sample, on average. Amplitude modulation can happen quite quickly and certainly is more evident than frequency modulation in financial markets. The more stable the modulation the better.


