


S&P 500 (SPY) - 14th November 2024 | @ 254 Days (36 Weeks)
'A' class signal detected in the S&P 500 (via SPY). Running at an average wavelength of 254 days (36 Weeks) over 14 iterations since December 2014. Currently peaking


ΣL Cycle Summary
This excellent longer term wave, familiar to regular readers and subscribers, is notionally the Hurst 40 week nominal wave. Whilst the approach we now take is one of objective evidence for periodicity in markets, via a time frequency analysis, one of the original pioneers of numerical/spectral analysis was JM Hurst. The fact this component is so very apparent long after he established his nominal model in the 1960’s and 1970’s is a wonderful tribute. We recently published a report for this wave in our US Stock Market composite but I thought it was worth also sharing this specific analysis for SPY as it is particularly clear.
Superbly stationary in the period 2016-2020, this wave has lost some power and price influence since then but is still front and center at a bandwidth below 400 days, in most stock markets. The S&P 500 (via SPY here) is a good example of this component, being very well spectrally separated. Indeed in the area below this wave (300-500 days) there is almost a complete vacuum of power, a telling sign of consistency over time for the prominent wavelength.
Subscribers should also be aware of the possibility that this incoming peak is also the peak of the much longer cycle around 3.5 years, published on Sigma-L back in September this year.
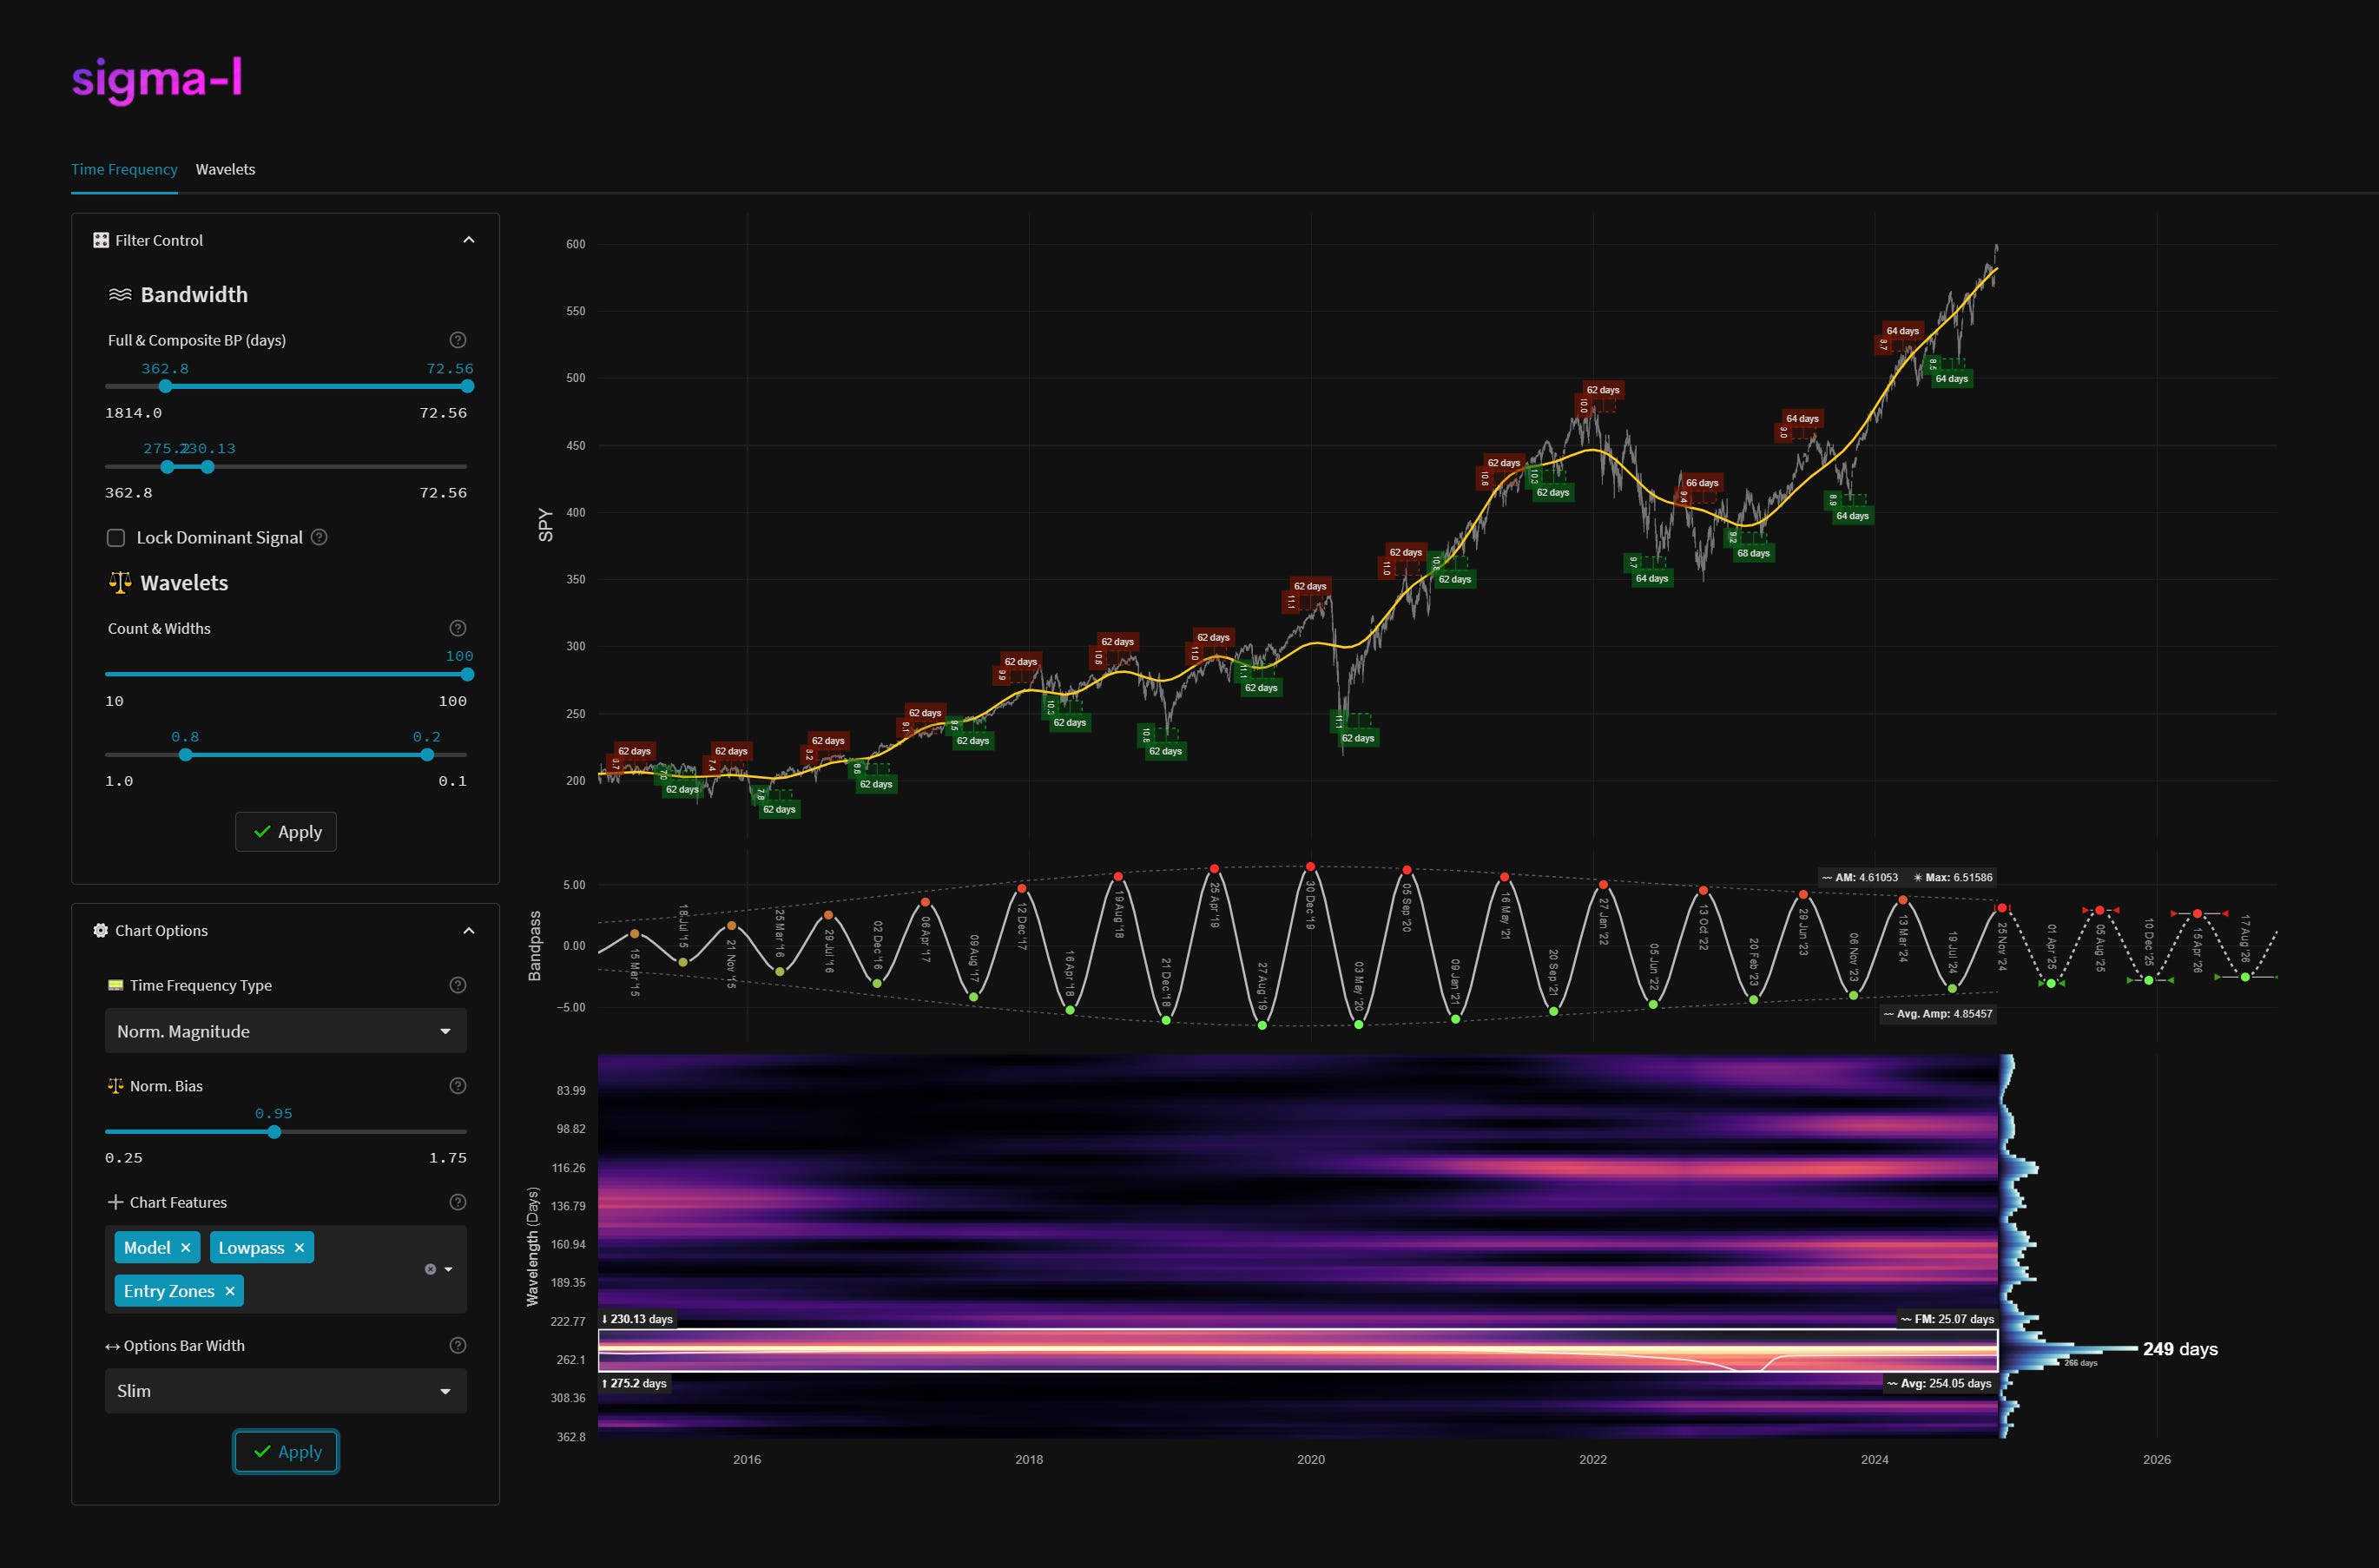
Time Frequency Analysis
Time frequency charts (learn more) below will typically show the cycle of interest against price, the bandpass output alone and the bandwidth of the component in the time frequency heatmap, framed in white.
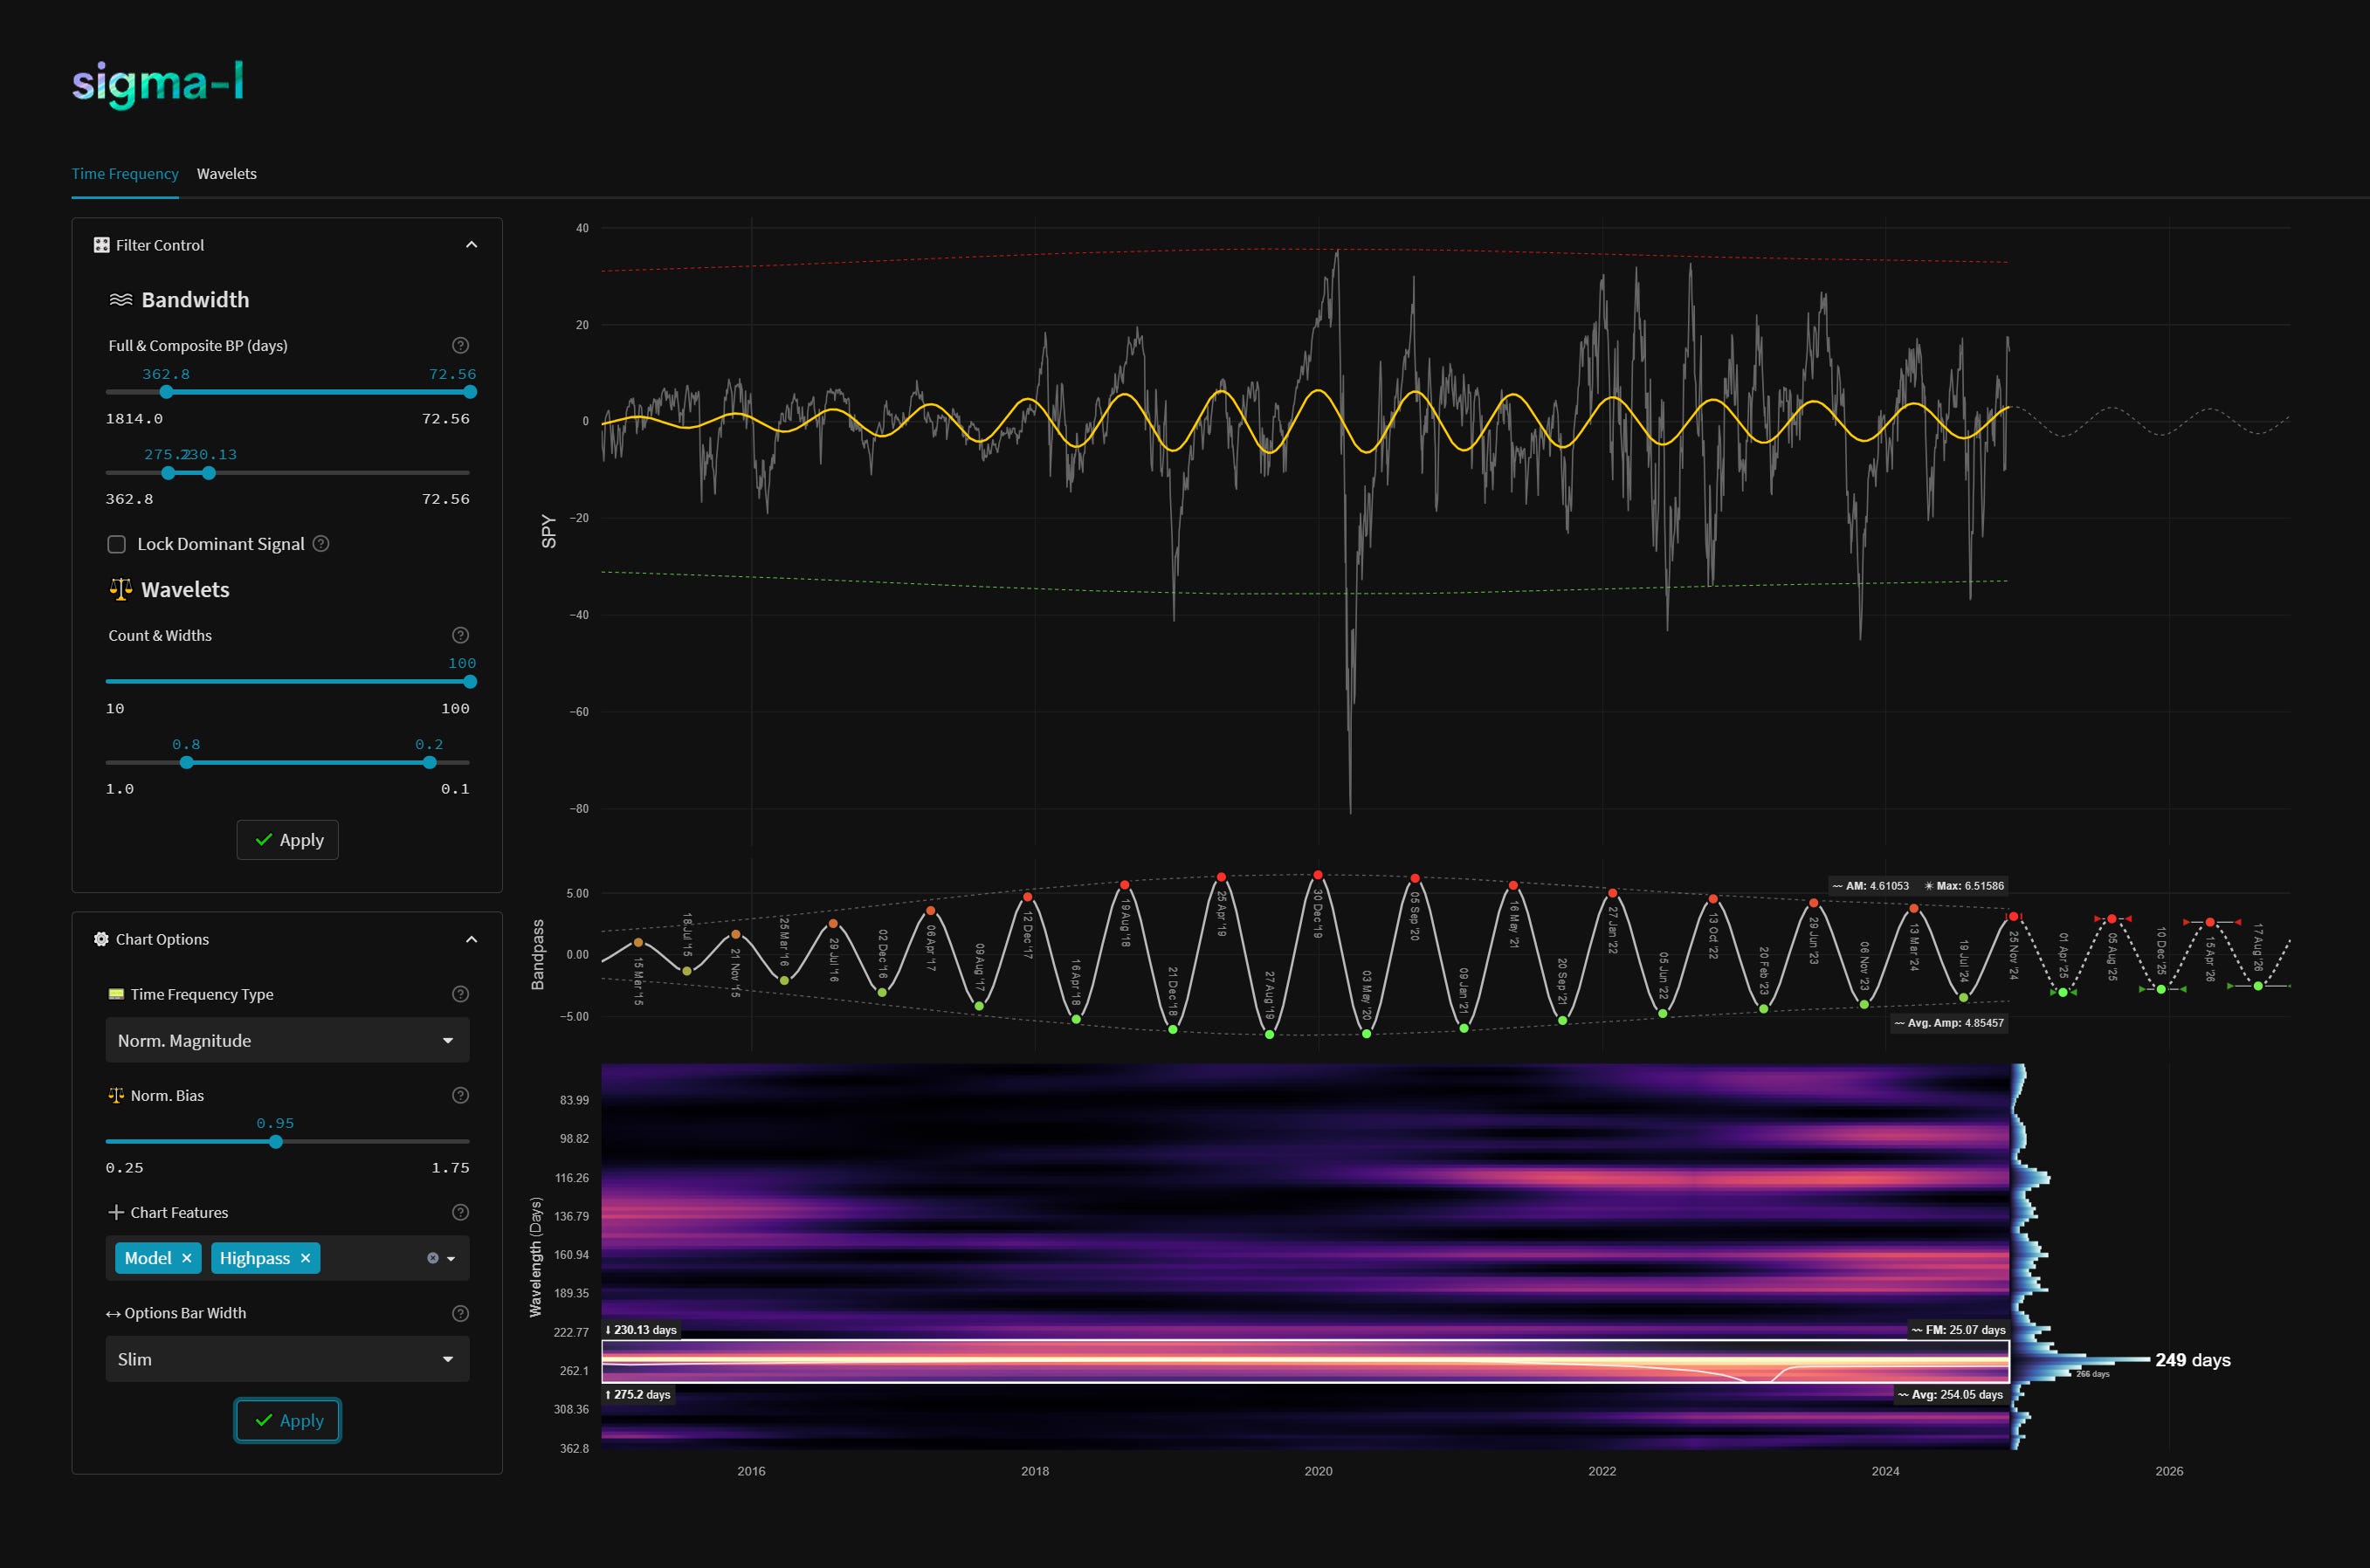
High-Pass Filtered Price
Our high-pass filter isolates the component of interest from underlying trend and presents buy and sell threshold envelopes (green and red). The envelopes are based upon the amplitude envelope of the bandpass filter +- 2 standard deviations. Breaches of either by high-passed price is a strong reversal action signal.
Current Signal Detail & Targets
Here we give more detail on the signal relative to speculative price, given the detected attributes of the component. In most cases the time target to hold a trade for is more important, given we focus on cycles in financial markets. Forthcoming trough and peak ranges are based upon the frequency modulation in the sample (learn more).
Detected Signal Class: A - learn more
Average Wavelength: 254.05 Days (36.29 weeks)
Completed Iterations: 14
Component Yield Over Sample: 130.73% (SPY) - learn morePhase: Peaking / Peaked
FM: +- 25 Days
AM: 4.61053 (SPY)
Next Trough Range: 19th March - 13th April, 2025
Next Peak Range: 23rd July - 23rd August, 2025
Sigma-L Recommendation: Sell
Time Target: ~ 1st April, 2025
Current Signal Phase
This is ‘how far along’ the cycle is in it’s period at now time and is related to the predicted price action direction.
Current Signal Frequency Modulation (FM)
This is how much, on average, the signal detected varies in frequency (or wavelength) over the whole sample. A lower variance is better and implies better profitability for the component. Frequency usually modulates relatively slowly and over several iterations.
Current Signal Amplitude Modulation (AM)
This is how much the component gains or loses power (price influence) across the sample, on average. Amplitude modulation can happen quite quickly and certainly is more evident than frequency modulation in financial markets. The more stable the modulation the better.
Here the time target is 01 April, this is right?
David do you mind looking at JETS etf. Global airlines. Looks to be breaking out on weekly wondering if there are medium or longer term cycles at play that you can find. Thanks.