ΣL US Stock Market Composite - 14th October 2024 | @ 36 Weeks
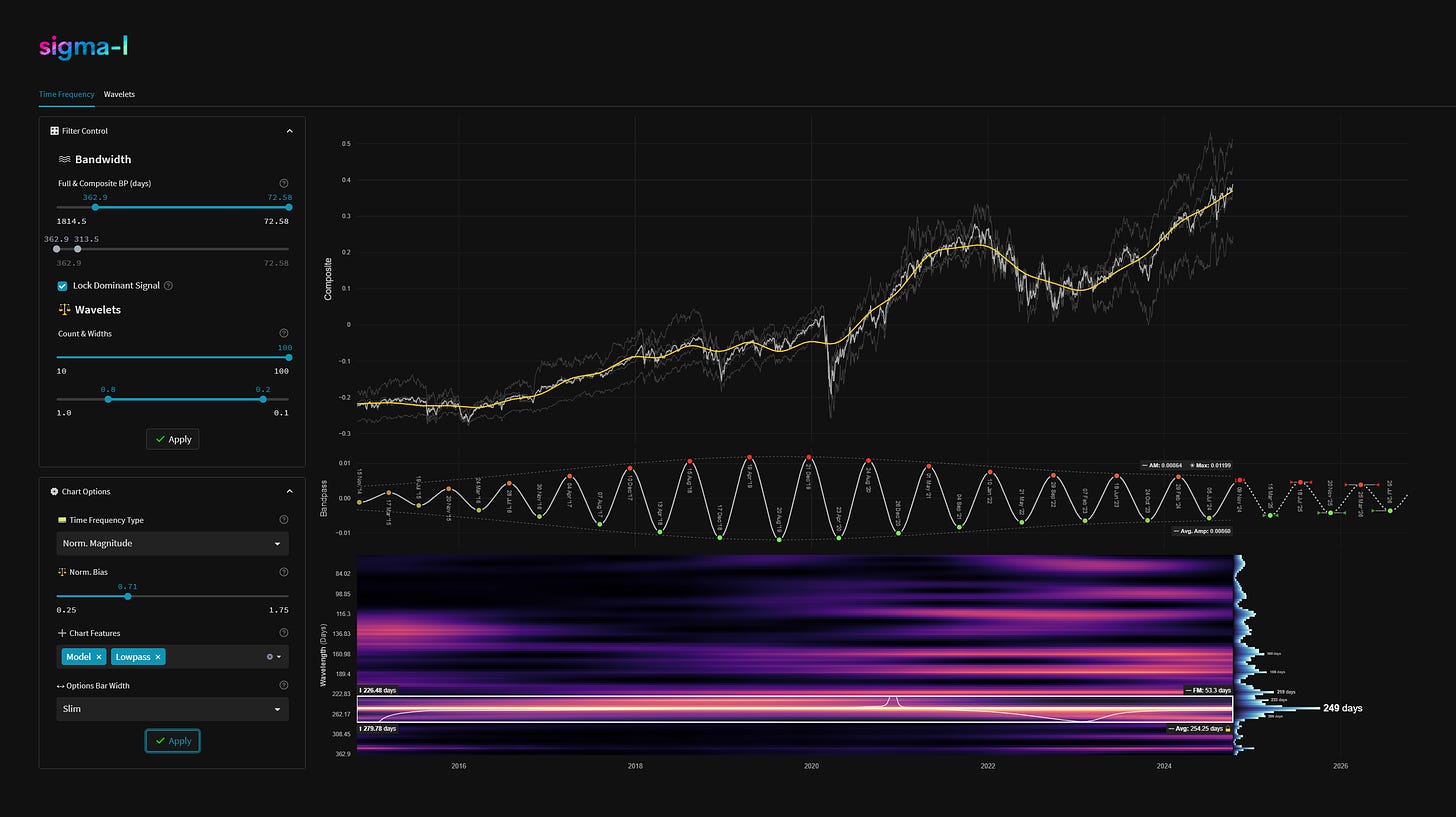
'C' class signal detected in ΣL US Stock Market Composite (SPY, QQQ, IWM, DIA). Running at an average wavelength of 36 weeks over 15 iterations since November 2014. Currently peaking.
ΣL Cycle Summary
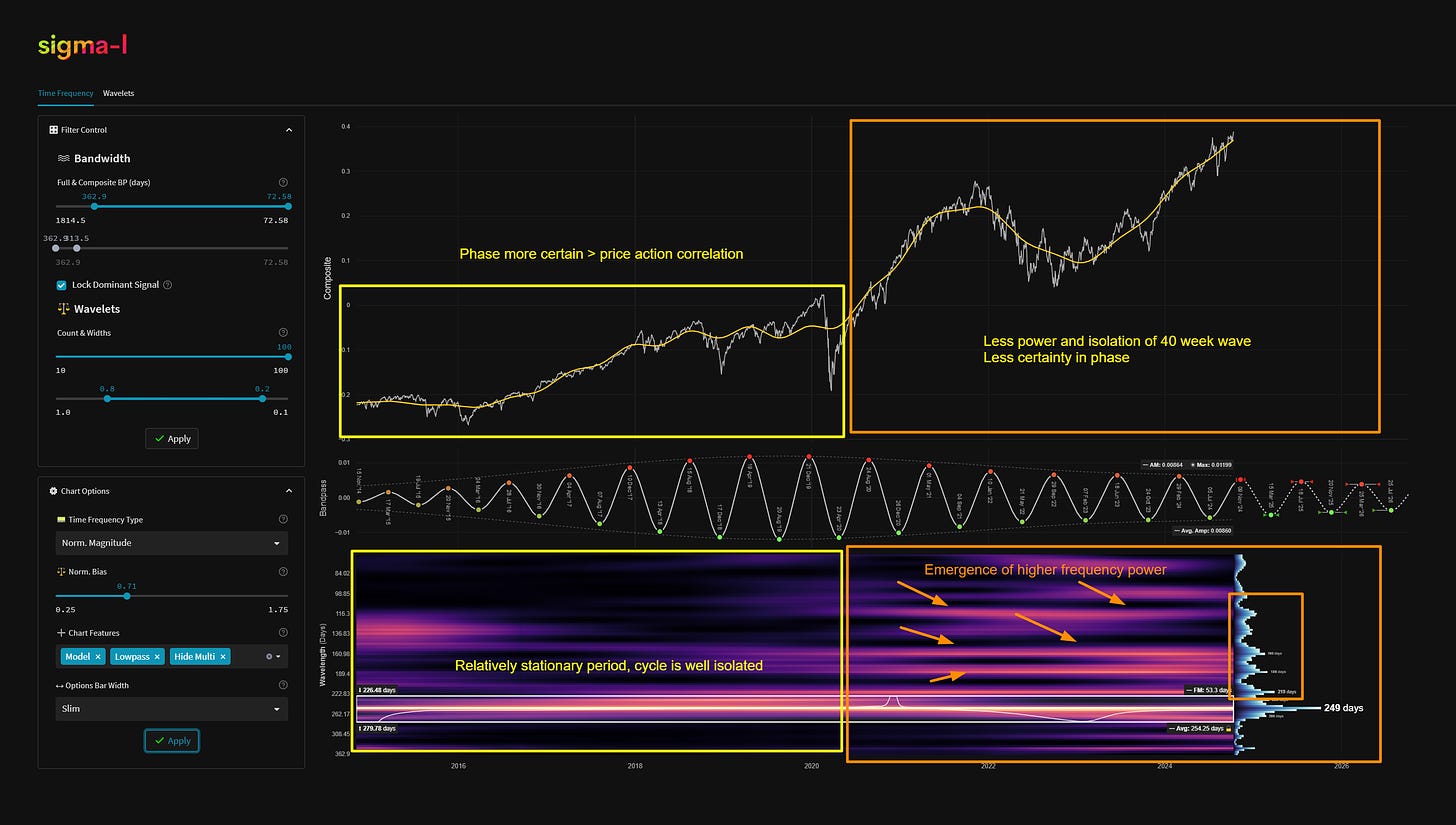
This longer term cycle, sampled here since 2014, is notionally the Hurst 40 week nominal wave, discovered by Hurst via early spectral analysis (FFT) in the 1960’s. Here we take a sample via popular US stock market ETFs, which very accurately reflect any periodic features within the wider market.
Although superbly stationary and well isolated in the period 2015-2020, subsequently there has been a emergent (2020 - now) area of power at higher frequencies. This has influenced price action correlation, resulting in an overall ‘C’ rating across the sample using our ranking criteria. Undoubtedly if this report had been written around the time of December 2018, for example, the spectra, and this component, would have drawn at least a ‘B’ rating. We attempt to demonstrate the difference below.
In addition, thanks to X (known back then as Twitter!), we can take a look at the phasing at that point with a Sentient Trader chart, used before developing the current, more robust software. We have also included a phasing of the 40 week nominal wave (for the FTSE 100) from a very early version of software development, on metatrader 4. This used a static FFT as a crude insight into the periodic features of price action.
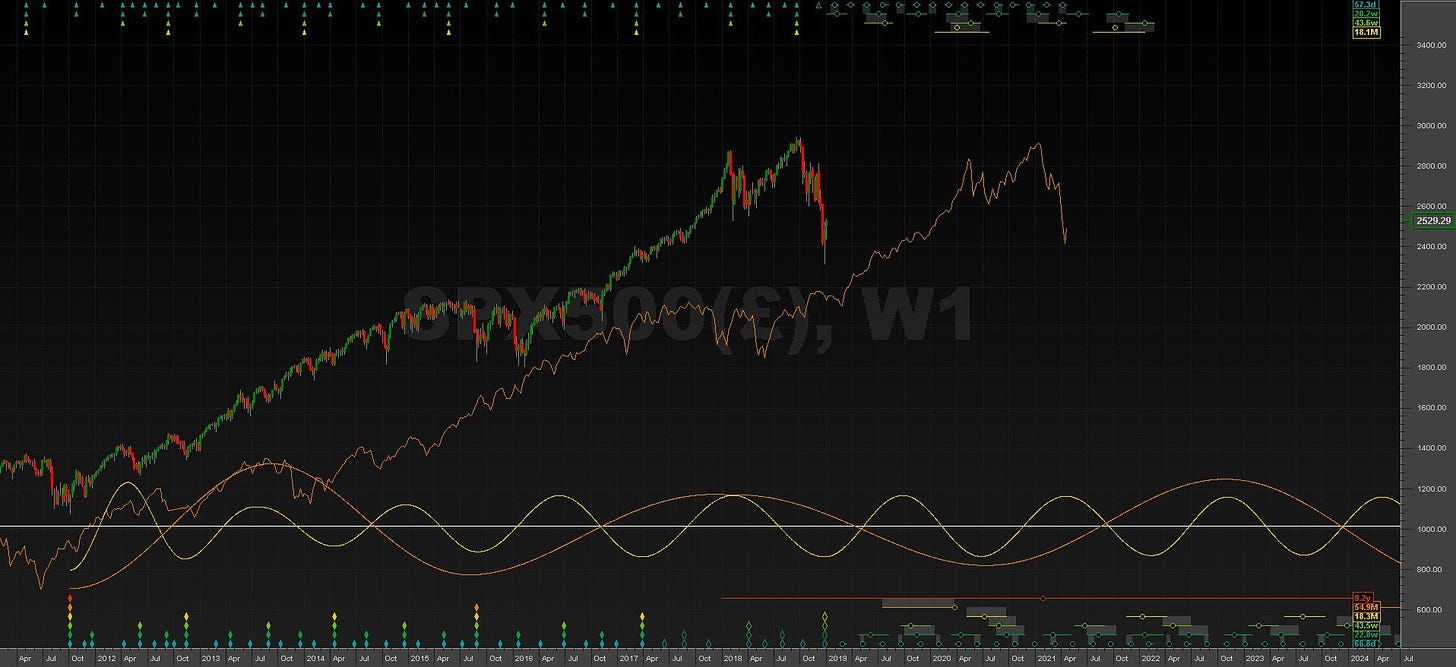
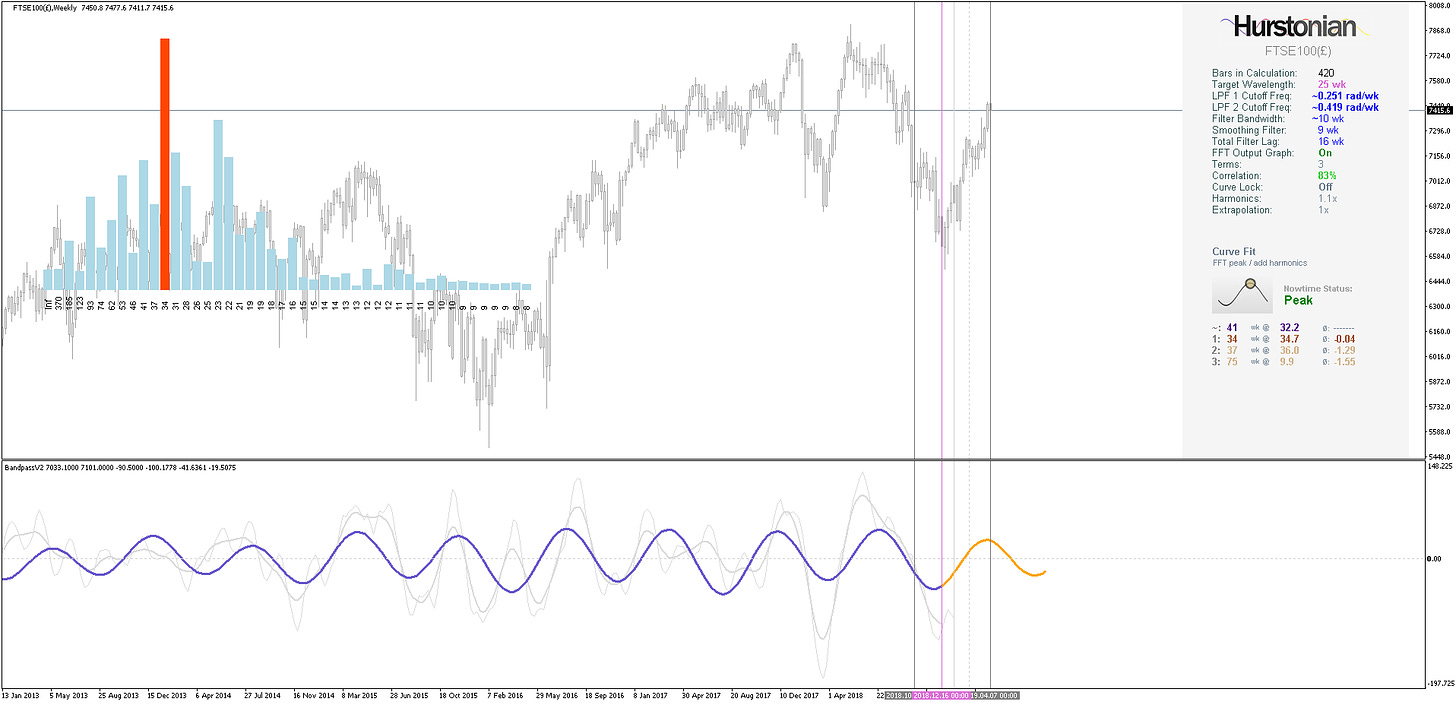
At nowtime, this component is phased as peaking with the next trough iteration due late in the 1st quarter 2025.
Time Frequency Analysis
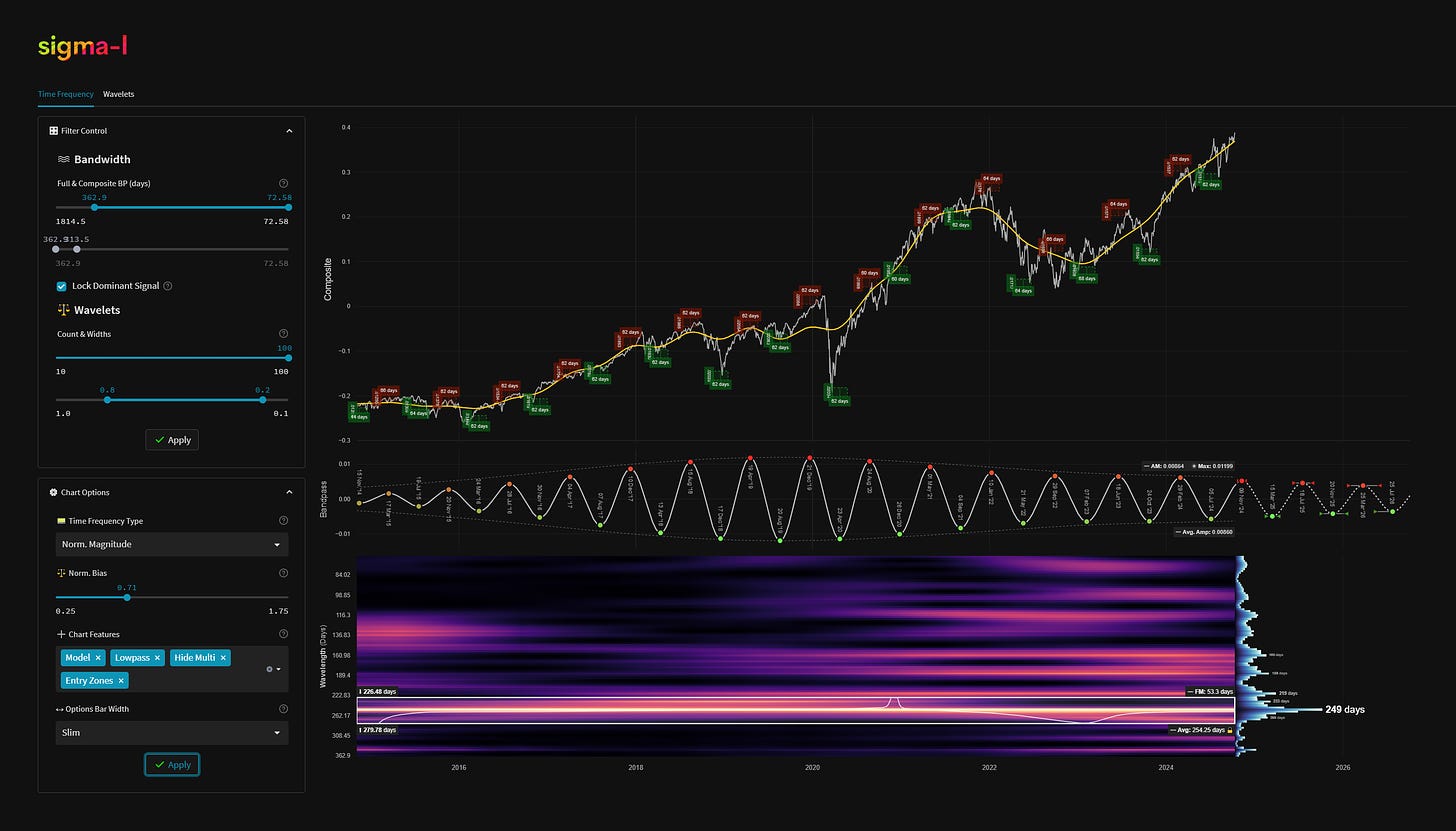
Time frequency charts (learn more) below will typically show the cycle of interest against price, the bandpass output alone and the bandwidth of the component in the time frequency heatmap, framed in white.
Current Signal Detail & Targets
Here we give more detail on the signal relative to speculative price, given the detected attributes of the component. In most cases the time target to hold a trade for is more important, given we focus on cycles in financial markets. Forthcoming trough and peak ranges are based upon the frequency modulation in the sample (learn more).
Detected Signal Class: C - learn more
Average Wavelength: 254.25 Days (36.32 Weeks)
Completed Iterations: 15Phase: Peaking / Peaked
FM: +- 53 Days
Next Trough Range: 16th February - 11th April, 2025
Next Peak Range: 21st June - 14th August, 2025
Sigma-L Recommendation: Sell
Time Target: ~ 15th March, 2025
Current Signal Phase
This is ‘how far along’ the cycle is in it’s period at now time and is related to the predicted price action direction.
Current Signal Frequency Modulation (FM)
This is how much, on average, the signal detected varies in frequency (or wavelength) over the whole sample. A lower variance is better and implies better profitability for the component. Frequency usually modulates relatively slowly and over several iterations.
Current Signal Amplitude Modulation (AM)
This is how much the component gains or loses power (price influence) across the sample, on average. Amplitude modulation can happen quite quickly and certainly is more evident than frequency modulation in financial markets. The more stable the modulation the better.


Great read! Excited for the future and seeing how well this component does here in the near future!
Hi David, this question may be due to my limited knowledge, but when you refer to a stationary signal (i assume this means consisten frequency modulation) , does that apply to amplitude as well? If a signal is Class A but with very little power, it would be difficult to trade despite being stationary no?