The FLD
Learn about the humble FLD or 'Future Line of Demarcation' - a simple yet powerful Hurstonian staple.
What is the FLD?
Proposed by JM Hurst in the Cycles Course and other work, this simple tool informs traders of several important cyclical factors at work in the market.
The FLD, or Future Line of Demarcation, is a humble tool with no complicated setup or need for intricate indicator configuration! However it is one of the most powerful tools we can use in combination with a full phasing analysis as we examine financial markets from the Hurstonian viewpoint.
Tell Me More..

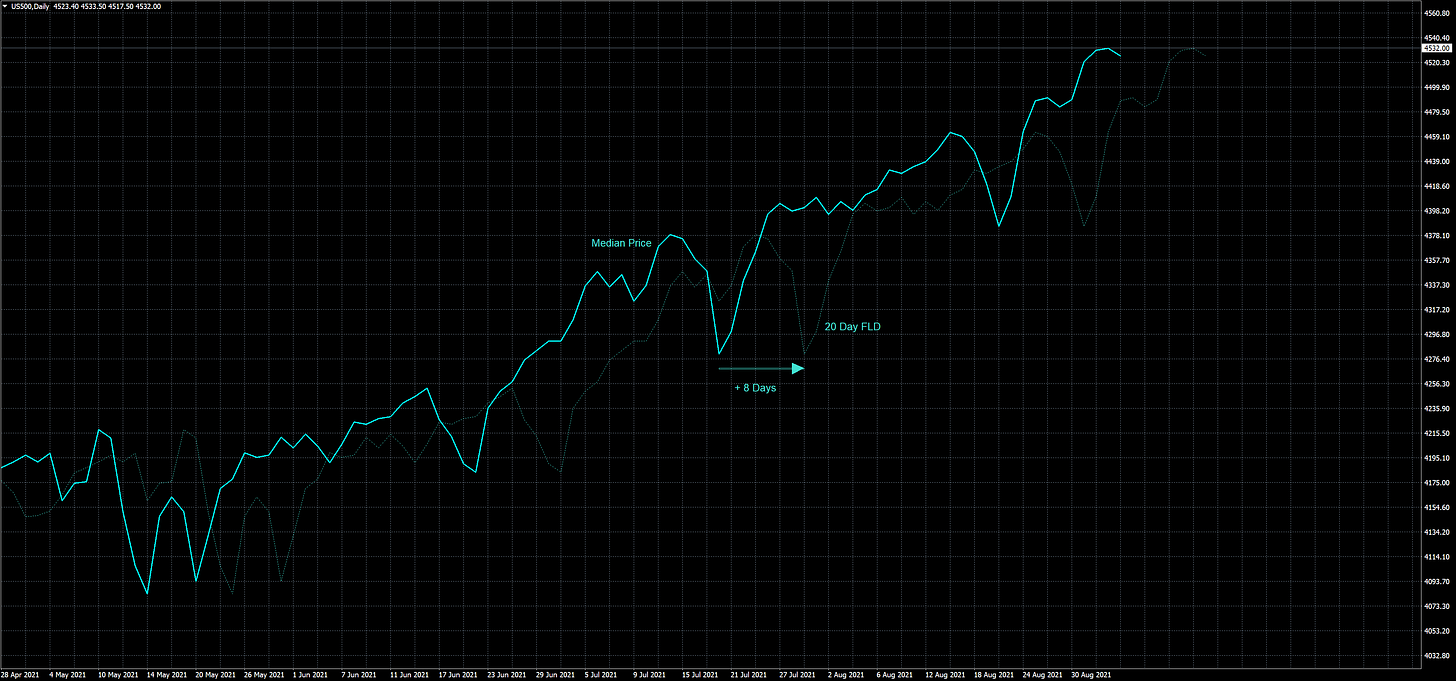
An FLD is formed by projecting median price forwards in time by the component’s wavelength, divided by 2. Examples below, based on a daily timeframe:
To plot a 20 day FLD which has a current average wavelength of 18 days, median price is projected forwards in time by 9 days.
To plot a 40 day FLD which has a current average wavelength of 37 days 1, median price is projected forwards in time by 18 days.
To plot a 80 day FLD which has a current average wavelength of 67.8 days 2, median price is projected forwards in time by 34 days.

Subscribers to Sigma-L have current wavelengths and FLD calculations provided in each market report. These are essential in order to execute potential trades based upon a full phasing analysis and subsequent FLD crosses.
Plot Your Own FLD
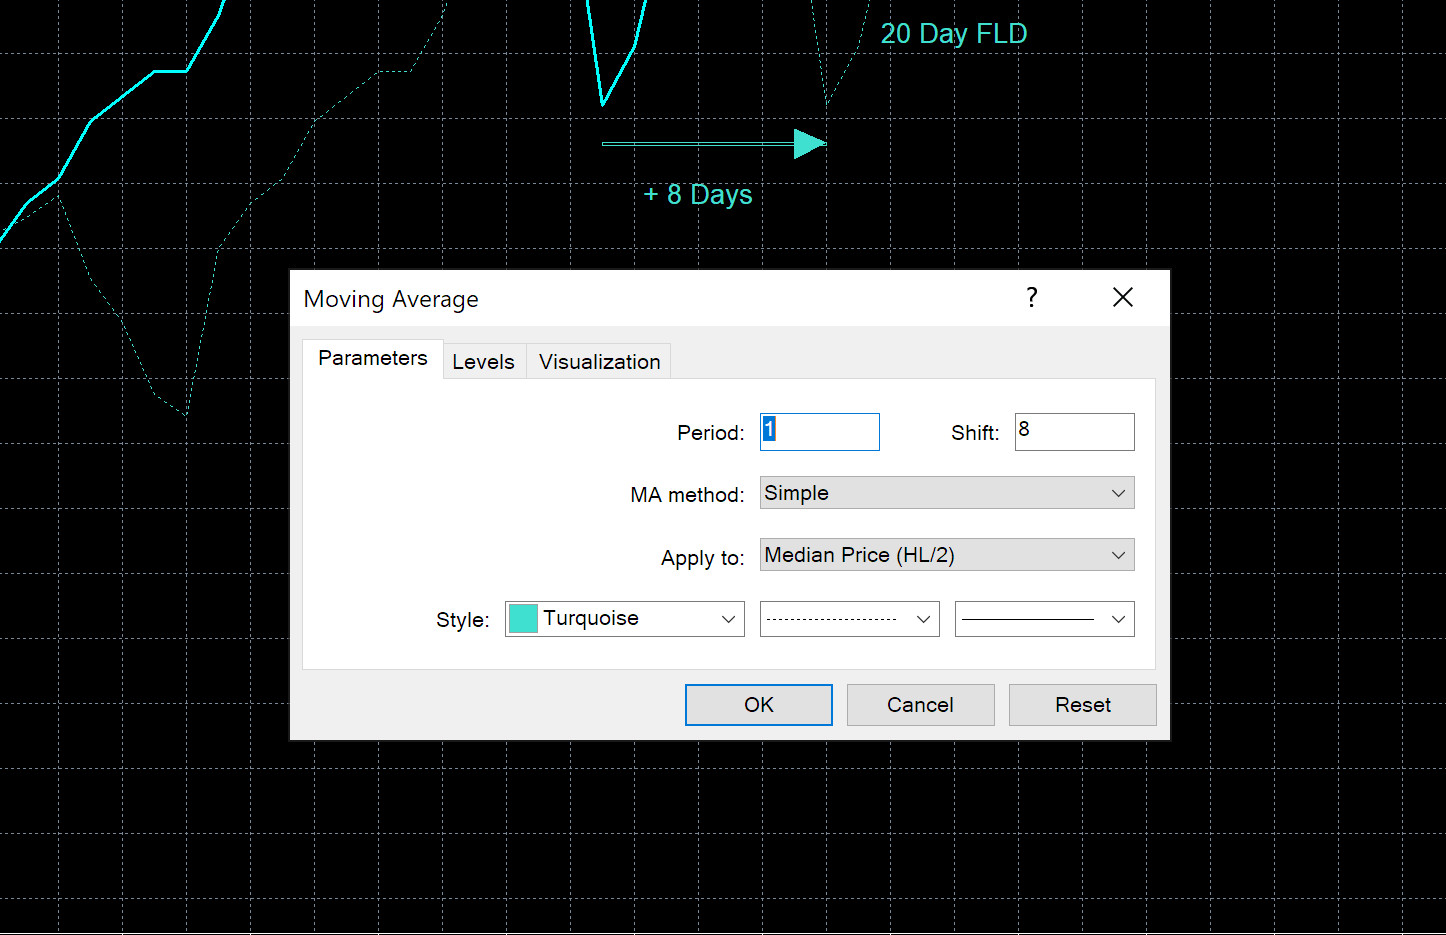
Plotting your very own Future Line of Demarcation (fancy sounding eh?) is very easy in most modern trading platforms. We can use a simple moving average of period 1 (effectively just unchanged price) on median price and project that average forwards in time by the calculated amount, derived from the phasing analysis.
IMPORTANT NOTE! If your broker feed does not include gaps for non-trading days (weekends etc..) you will need to account for this in your calculations when plotting FLDs from Sentient Trader’s phasing analysis. For example, plotting an FLD for the 40 day component, calculated at 34 days from Sentient Trader, will be amended to account for weekends (2 non trading days, in this first example) as follows:
d = 34; Period of 40 day component via phasing analysis
nd = floor(2*(d/7)); ~ 9 non trading days
fld_offset = floor((d-nd)/2); FLD offset of 12 days
If your broker only omits 1 day for the data feed (trading starts on Sunday, for example) it is sufficient to only account for 1 day as a non-trading day per week per period:
d = 34; Period of 40 day component via phasing analysis
nd = floor(d/7); ~ 4 non trading days
fld_offset = floor((d-nd)/2); FLD offset of 15 days
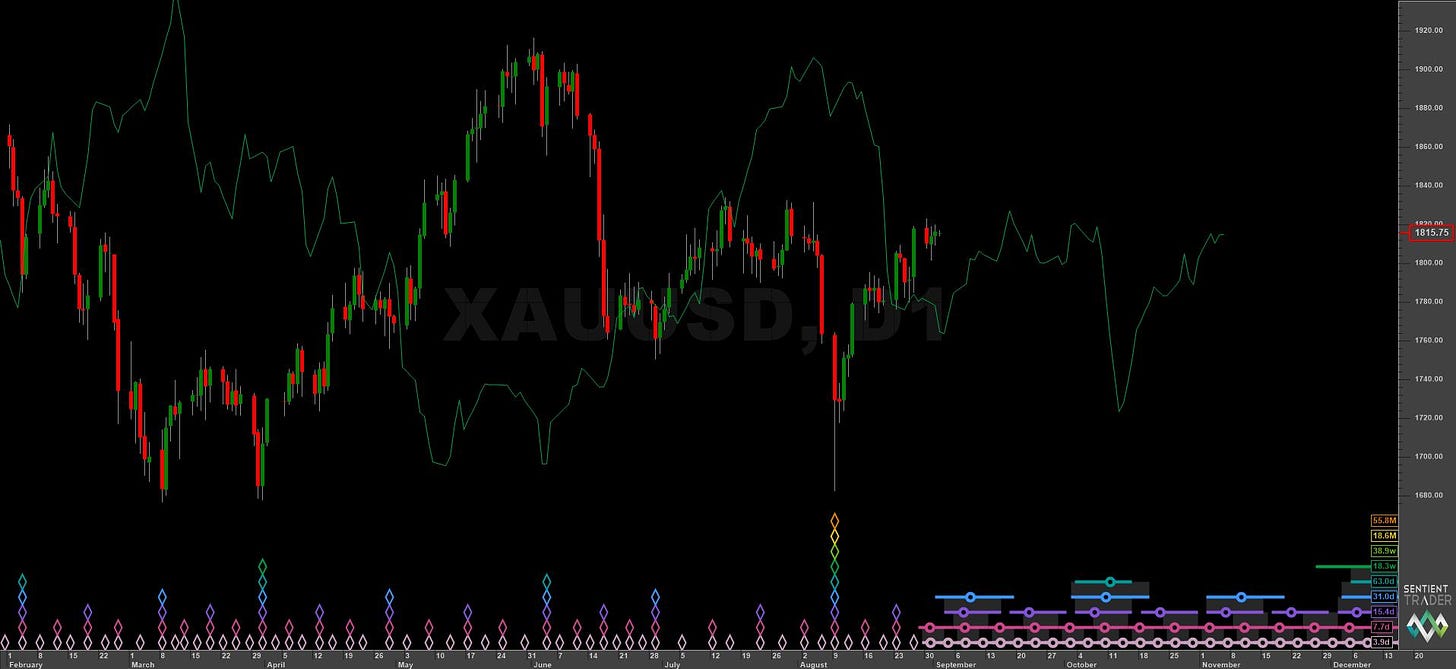
In this way your FLDs will resemble those in Sentient Trader as that particular software adds gaps (and dummy bars if required) for non trading days.
If you instead perform your own, manual, phasing analysis any non trading days omitted in the datafeed will be automatically calculated via the slightly shortened wavelengths of phased components, compared to Sentient Trader’s FLD offsets.
Cycles progress, according to Hurst’s model, continously over time, regardless of whether markets are open. This is because the motivation behind the cyclic, periodic movement in financial markets has it’s roots in human decision making.
This decision process does not stop at the weekend or any other non trading day!
Below is a screenshot from Metatrader 4 detailing the S&P500 on a daily timeframe and the indicator panel configuration needed to plot an FLD of the 20 day component (wavelength 16.5 days). From this we can start to form evidence about the market and inform trading decisions.
Of course multiple FLDs based upon all cyclical components derived from a phasing analysis can be plotted for the ultimate market knowledge, more about that below. Generally 3 FLDs are useful in trading: one for the cross target and the two subsequent higher degree FLDs for dynamic support and resistance.
All FLDs, however, can inform the skilled trader as to the cyclical status of a financial market to some extent.
Ok, So What Can I Use It For?
The simple FLD tells us several powerful things about any market under examination:
As an FLD is projected forwards in time by half the wavelength of the component of interest, the FLD is 180° out of phase with that component and this can be very useful. If taken in isolation and idealised when the FLD reaches a trough in future time price can be expected to peak at that time. Inversely when the FLD reaches a peak in future time price can be expected to trough at that time. In reality and in a non idealised scenario price is subjected to all other cyclical components, which leads onto the next point of interest..
If the price peak of a component occurs prior to the FLD trough it is evidence of bearish pressure being exerted by longer components than the component under examination. In other words sigma-l (the sum effect of longer cycles) is pushing down! This is called left translation. Of course the opposite is also true; if price forms a peak subsequent to the FLD trough it is said to be right translated and therefore evidence of bullish sigma-l. Both of these scenarios can be useful in deciding which direction of trade to execute (the trend is your friend - that old chestnut!).
Price projections. With price being 180° out of phase with the FLD we can make accurate price projections if price crosses the FLD. We can assume with a good deal of confidence that price will move the same distance past the FLD that is has moved from the cycle peak or trough. This can be measured of course and software like Sentient Trader does this kind of donkey work for the trader - not that it is hard to do with simple tools in Metatrader or other platforms. In an idealised scenario price would accurately meet targets - of course real markets are not idealised and we have to take into account sigma-l! So, another piece of evidence as to the status of sigma-l is whether FLD cross targets are met, exceeded or missed. A target being met (within an objective range of noise) indicates a flat sigma-l (rare), exceeded indicates a bullish sigma-l and missed indicates a bearish sigma-l. Again this feeds into the trader’s knowledge of the underlying trend of a financial market and the overall bias of trades to be chosen.
Dynamic support and resistance. This is something that was not originally proposed by Hurst in his work but is of use to modern Hurst Cycles proponents. Price will often stop or track at FLD levels en-route or at price peaks or troughs. This interaction can be tracked and is repeatable. More broadly it is useful to align FLD cross targets with support and resistance of higher degree cycle FLDs to inform targets or stop loss/risk levels.

FLD 2.0 - Can We Improve It?
Absolutely. In an exclusive article for subscribers only we look into how applying a low pass filter to the FLD can assist in trading decisions by attenuating higher frequency components (inc random noise).
The FLD is a great and powerful tool, use it wisely and you may not need any other technical analysis tools again.
If you enjoyed this article please consider sharing it with friends and colleagues!
If the average wavelength of a component is an odd number it can be rounded up or down to arrive at a whole number for the FLD projection. Here we have rounded down to 36. Check for price action support or resistance at the FLD to choose between the two rounding methods.
Here a floating point number defines the average wavelength. In this case we can arrive at the FLD projection figure by rounding to the nearest even number. Here it is 68 days and the subsequent FLD is then 34.


