Uranium: Hurst Cycles - 30th November 2022
Uranium continues largely sideways with diminishing amplitude at the 20 week component, betraying a bearish influence. We look at the next moves, most importantly the incoming 18 month nominal low
Tools required: Nominal Model | FLD | FLD Trading Strategy | FLD Trading Strategy (Advanced) | Principle of Nominality | Underlying Trend
Analysis Summary
In our last report into Uranium via the Global X Uranium ETF URA 0.00%↑, we speculated on the position of the 40 week component and, in addition, whether the 4.5 year nominal peak had occurred:
From 12th July Report:
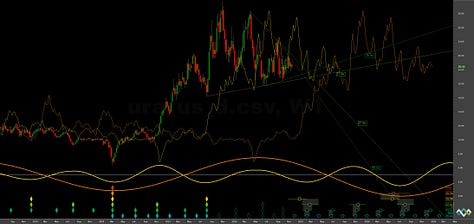
Whether the 4.5 year component of the 9 year component has peaked is a question we can’t yet answer but it is highly likely there will be support at the 4.5 year FLD (orange on long term chart) for the 18 month nominal low at the end of 2022. Subsequent to that low a test of the highs around 30 may well occur to form a generally sideways move into the 4.5 year low due 2024.
The 40 week nominal low is now highly likely to have occurred in the May - June time zone (as phased below) with a relatively weak move up to the 24 area completing a triangulation of price. The 18 month component that governs this triangle is therefore neutral to bearish and we can say with a good deal of confidence that the peak in late 2021 was ostensibly a peak of 4.5 year magnitude.
Given that the trough in 2020 was likely of 9 year magnitude, what can we expect over the next year or so? Well, the most likely scenario is one of largely sideways price action. The combination of the upward influence of the 9 year component combined with the downward influence of the 4.5 year component producing a net neutral effect.
Going further (and of course we can go ad infinitum!) we can anticipate that if the low in 2020 was of 18 year magnitude the low due in mid 2024 will be a tremendous bullish opportunity, but only after the grind to come. The crucial point is the support at the 4.5 year FLD, due now early 2023, taking the latest wavelength calculations into account. Stationary price action at the larger components is a great thing for us as we can expect more clarity from the medium and smaller components - which are eminently tradeable.
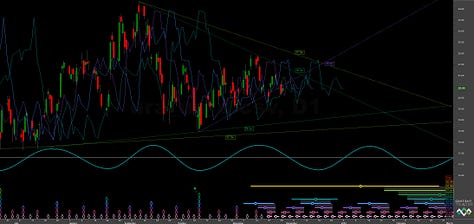
Medium term price is likely forming the peak (or has formed) of the 20 week component. The 40 week VTL down at around 18 is likely to be tested and this forms the lower bound of the triangulation. Triangulation in itself is simply amplitude modulation over time, the larger components exerting downward pressure in a visually apparent manner. The 18 month nominal low is expected in February 2023 and should be an excellent chance to exploit a bullish part of the anticipated sideways (neutral) underlying trend for a few months.
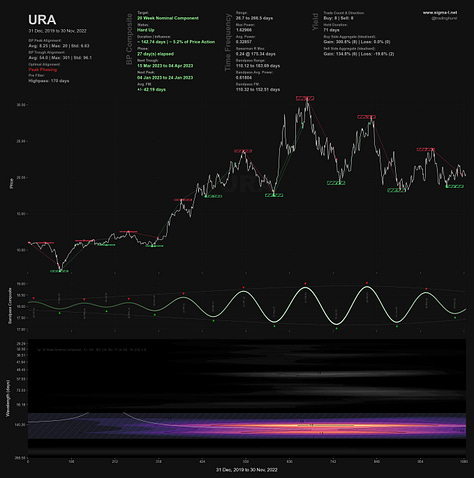
An interesting note to add for the time frequency analysis below is the cross correlation with both Yellow Cake PLC and the Sprott Uranium Miners ETF URNM 0.00%↑. All analyses reveal an excellent component around the 50-60 days wavelength. We can group these into the 80 day ‘nominal’ component category as per Hurst’s nominal model, although this is not strictly necessary. This component could be very useful going forward, should it maintain the stationarity shown historically here.
Phasing Analysis
Sentient Trader
Utilising a pattern recognition algorithm and Hurst’s diamond notation


Time Frequency Analysis
Wavelet convolution targeting 80 day and 20 week nominal components


Trading Strategy
Interaction Status
Interactions and price in the FLD Trading Strategy (Advanced). This looks at an idealised 40 week cycle and an array of 3 FLD signal cycles. We apply the instrument’s phasing to the model and arrive at an overall summary for the interactions with the 20 day FLD, current and forthcoming.
Sigma-L recommendation: Sell
Entry: 10 Day FLD (risk on) / 20 Day FLD
Stop: Above most recent 40 day nominal peak
Target: Initially 18.75 (80 day FLD cross target) then 16 (4.5 year FLD support)
Reference 20 Day FLD Interaction: F3 / G3
Underlying 40 Day FLD Status: D2
Underlying 80 Day FLD Status: F
Assuming the long term phasing is accurate traders may wish to join into the short to the 4.5 year FLD support due early next year. Initially and at the next 80 day low price will likely test the 40 week VTL (shown in light green, short term ST chart) around 18. The 80 day FLD cross target is at 18.75. Price is just currently above the 20 day FLD (straddling the 80 day FLD somewhat) and this can be a valid entry.
A subsequent hold through the first couple of months of 2023 should see price fall to it’s final destination in this 18 month component, support around the 4.5 year FLD at ~ 16.
FLD Settings
If you do not have the use of Sentient Trader use these settings to plot common FLDs in your trading software (daily scale) to more easily follow trading signals and strategy from Sigma-L.
Make sure to account for non-trading days if your broker omits them in the data feed (weekends, for example). The below offsets are given with no added calculation for non-trading days.
80 day nominal: 65.5 days | 33 day FLD offset
40 day nominal: 31.7 days | 16 day FLD offset
20 day nominal: 16 days | 8 day FLD offset
10 day nominal: 8.1 days | 4 day FLD offset
Correlated Exposure
A non exhaustive list of correlated instruments for consideration
Global X Uranium ETF URA 0.00%↑
North Short Global Uranium Mining ETF URNM 0.00%↑
Cameco CCO 0.00%↑
Uranium Energy Corp UEC 0.00%↑
Rio Tinto RIO 0.00%↑


David, are you familiar with thinkscript that is language used in thinkorswim software? Was trying to implement FLD code in this software but plots are not even close with what is shown in ST software.
Thanks David I did find the link on the website after the fact. I did message you the code on Twitter. Thanks.