US Natural Gas - 14th February 2024 | @ 106 Days | - 29.71%
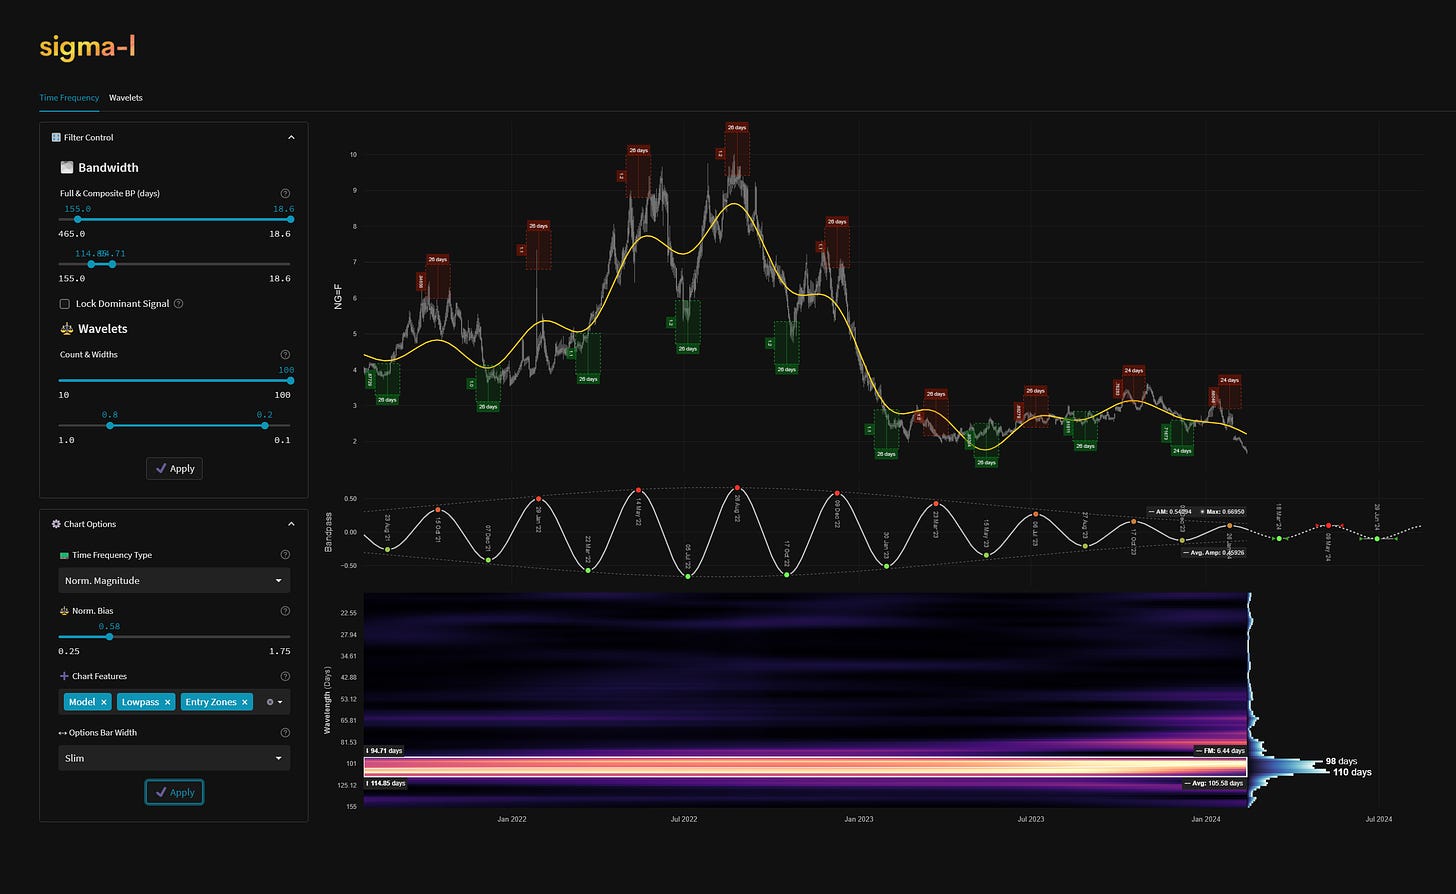
Last trade: - 29.71% | 'B' class signal detected in US Natural Gas. Average wavelength of 106 days over 9 iterations since July 2021. Currently moving down.
ΣL Cycle Summary
US Natural Gas, via the frequency stationary wave at around 105 days, moved up from early December in a bullish manner prior to establishing a left translated price peak, signifying larger periodic component are continuing to push down. The cycle peak likely occurred quite recently with a small whimper back up in late January, such is the amplitude modulation being applied to this component over the last few iterations. Indeed this signal might be consigned to a ‘C’ category for amplitude modulation alone, were it not for the superb stationarity in frequency over time, shown below in the time frequency plots. Taking a sample from January 2015 reveals a longer, somewhat modulated, component around 350 days dominating the smaller waves, shown below. That wave is due to trough March-April this year and will likely form a cluster of power with the smaller wave around 100 days, featured in this report and which is also due to trough mid-late March.
Trade Update
See also: Live ΣL Portfolio & History
Summary of the most recent trade enacted with this signal and according to the time prediction detailed in the previous report for this instrument, linked below.
Type: Early Buy - US Natural Gas 14th December 2023
Entry: 14th December 2023 @ 2.39
Exit: 14th February 2024 @ 1.68
Gain: - 29.71%
Before and After
Signal comparison between our last report and the current time, in chart format.


