USDCAD: Hurst Cycles - 20th December 2022
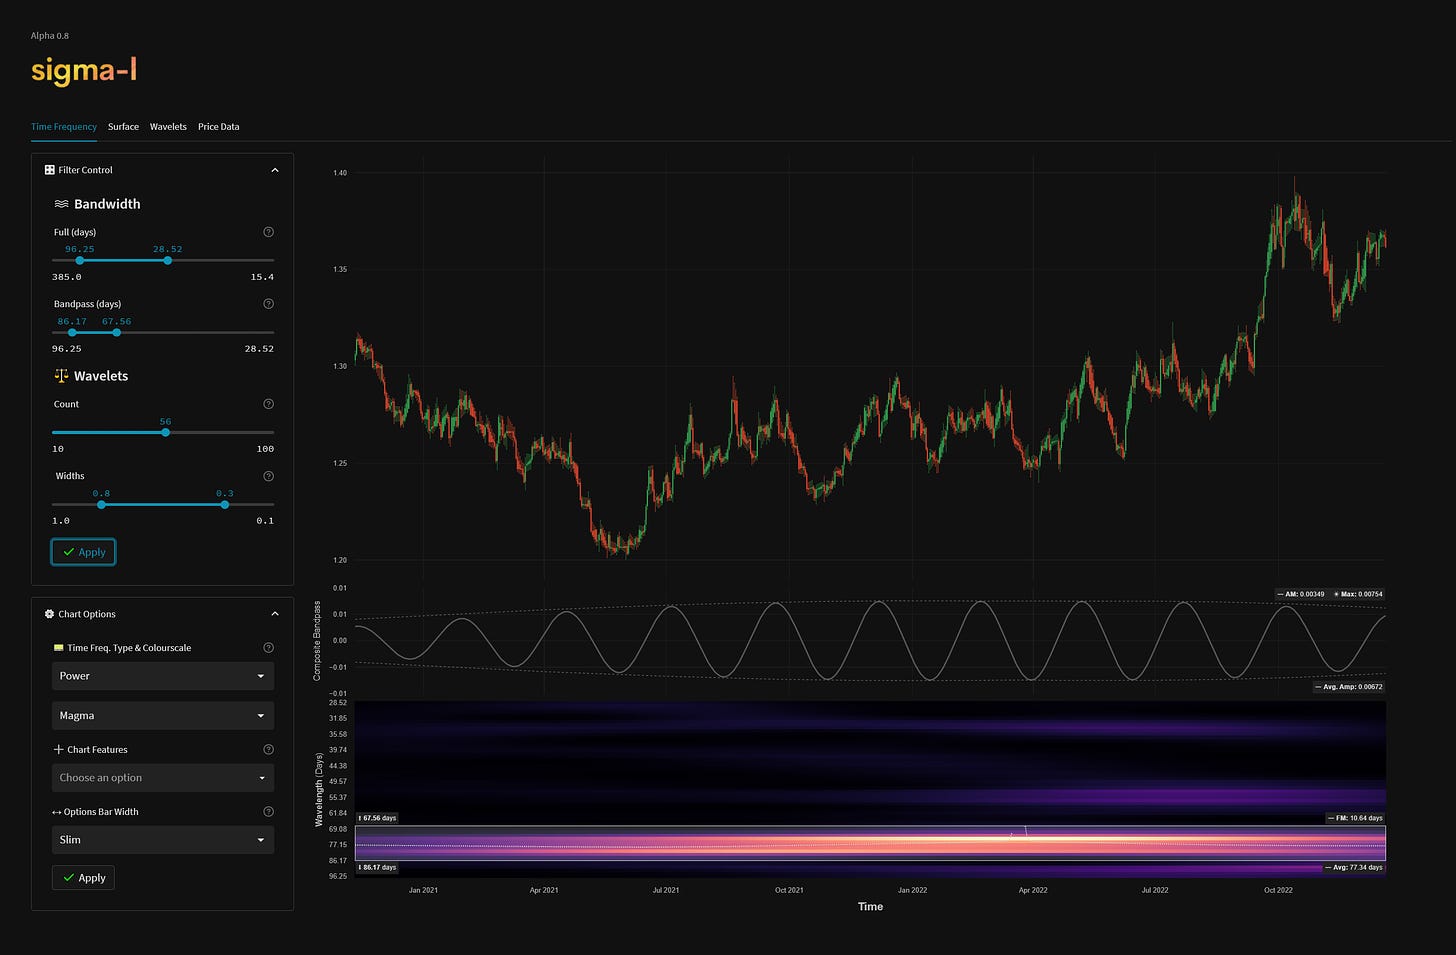
The recent move up in USDCAD is befitting an 80 day component, a low of which we explored in the last report. Did the time frequency analysis prove to be correct?
Essentials: Nominal Model | FLD | FLD Trading Strategy | FLD Trading Strategy (Advanced) | Principle of Nominality | Underlying Trend | Time Frequency Analysis
Analysis Summary
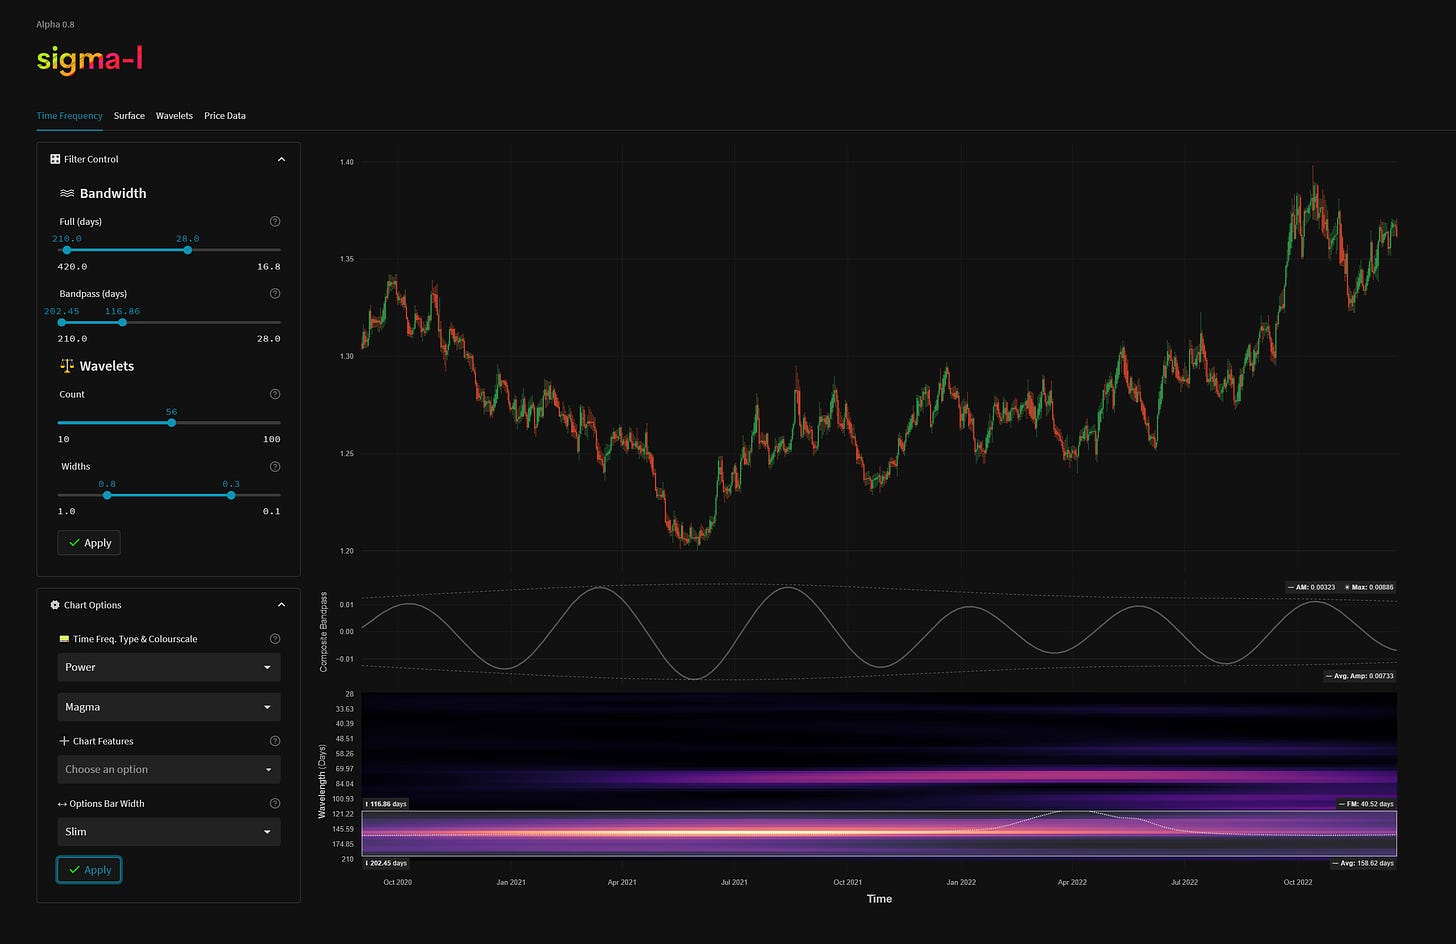
In our last report into USDCAD we speculated on the position of the most recent 80 day component after it was seemingly attenuated by the strong move up in September this year. Interestingly though the time frequency analysis, which allows an objective and entirely mathematically evidenced based approach to be viewed, suggested the low was forming (or had recently formed) early November.
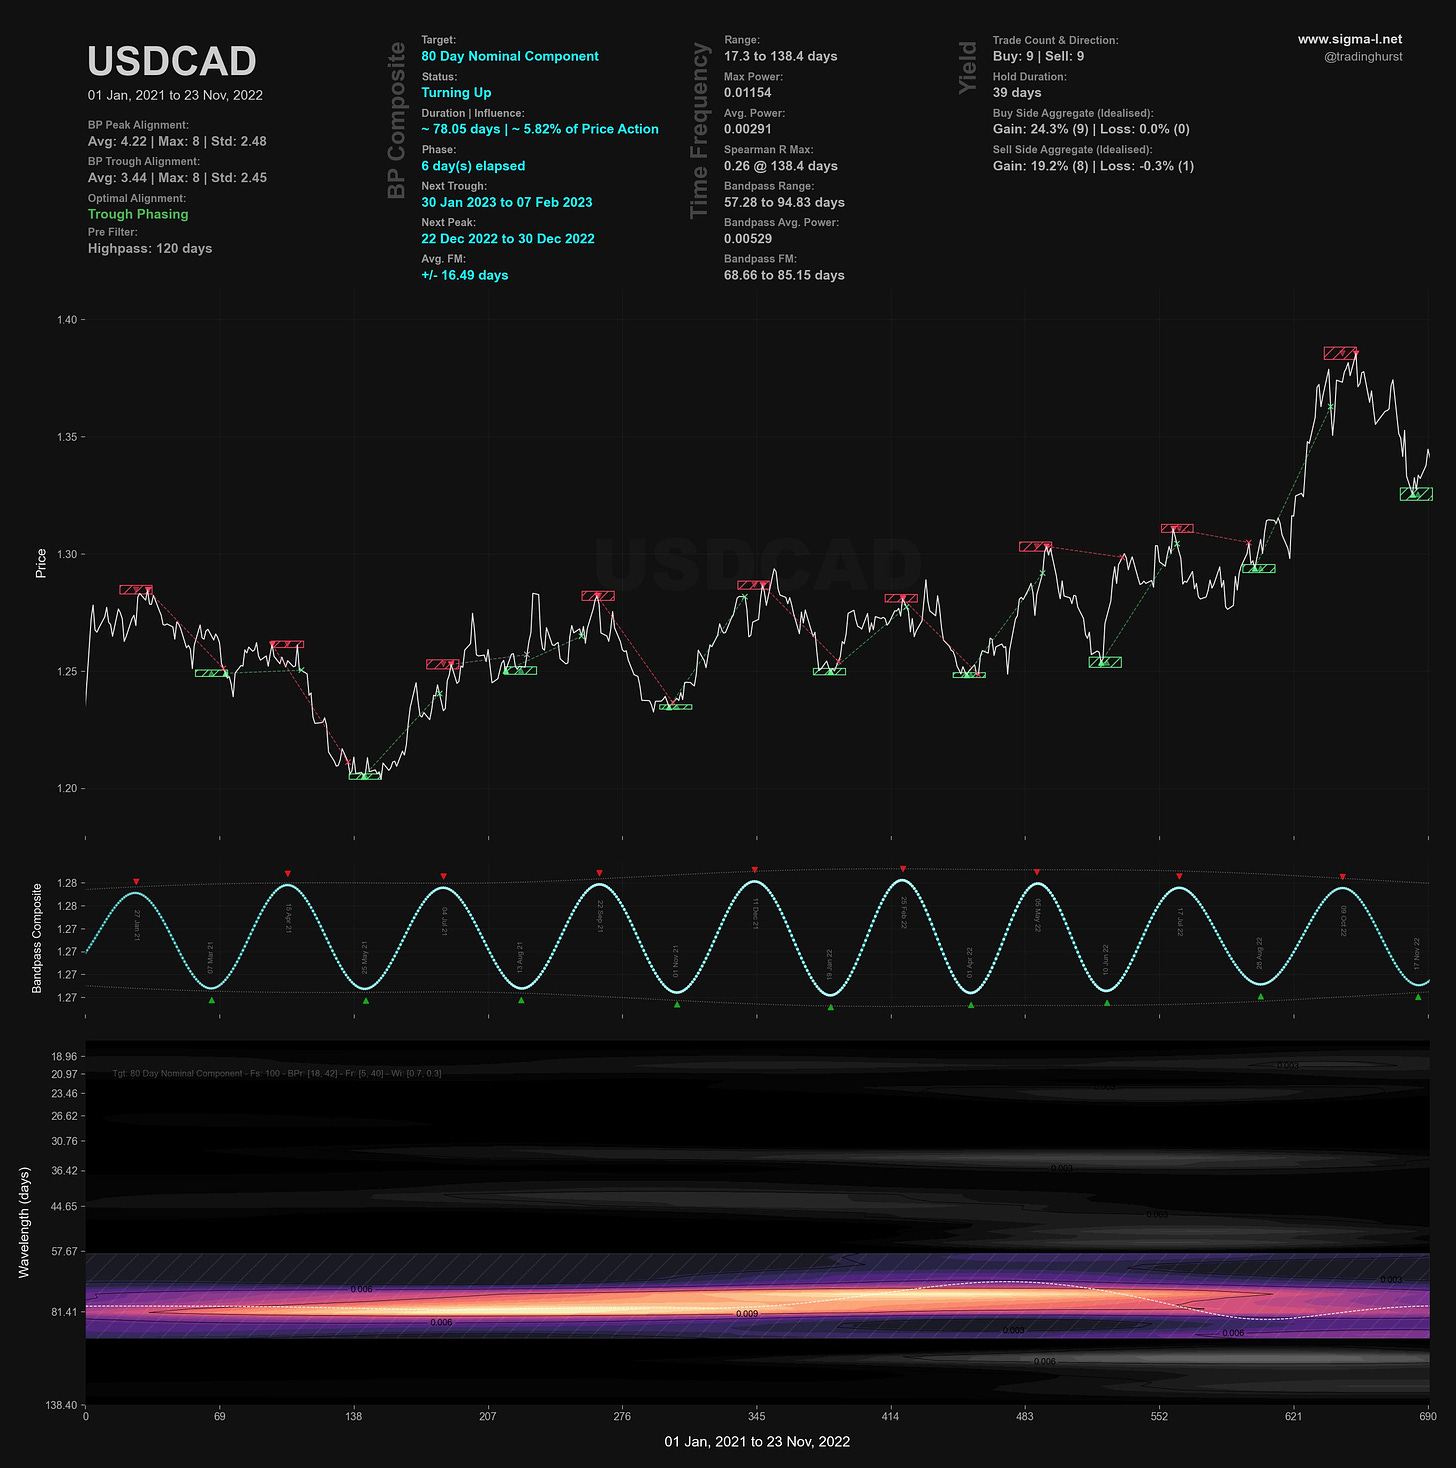
This is now likely the case with the deviation from the component average (78 days) only around 10 days. The 40 day margin of error we mentioned can now be dismissed as we once again marvel at the wonderful stationarity of this 80 day component, spanning a duration of nearly one and a half years and 8 iterations!
Price is currently crossing down through the 20 week FLD and, if the longer phasing is accurate, on the cusp of moving into an 18 month nominal low, expected late January or early February 2023. The 20 week FLD projection itself is around 1.33 but if underlying trend is indeed pushing down, price will test the lows made in early November, at least.
Support will likely come for the 18 month nominal low at the 40 week FLD down at around 1.3.
Phasing Analysis
Sentient Trader
Utilising a pattern recognition algorithm and Hurst’s diamond notation
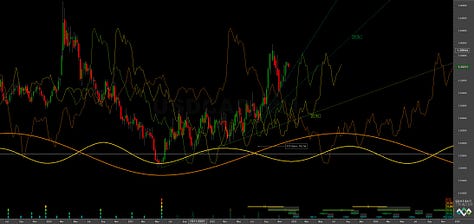
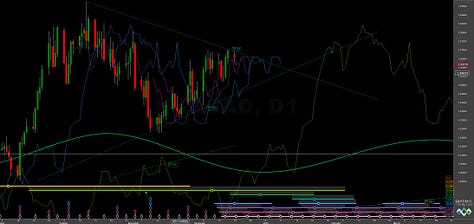
Time Frequency Analysis
Wavelet convolution targeting 80 day and 20 week components
Trading Strategy
Interaction Status
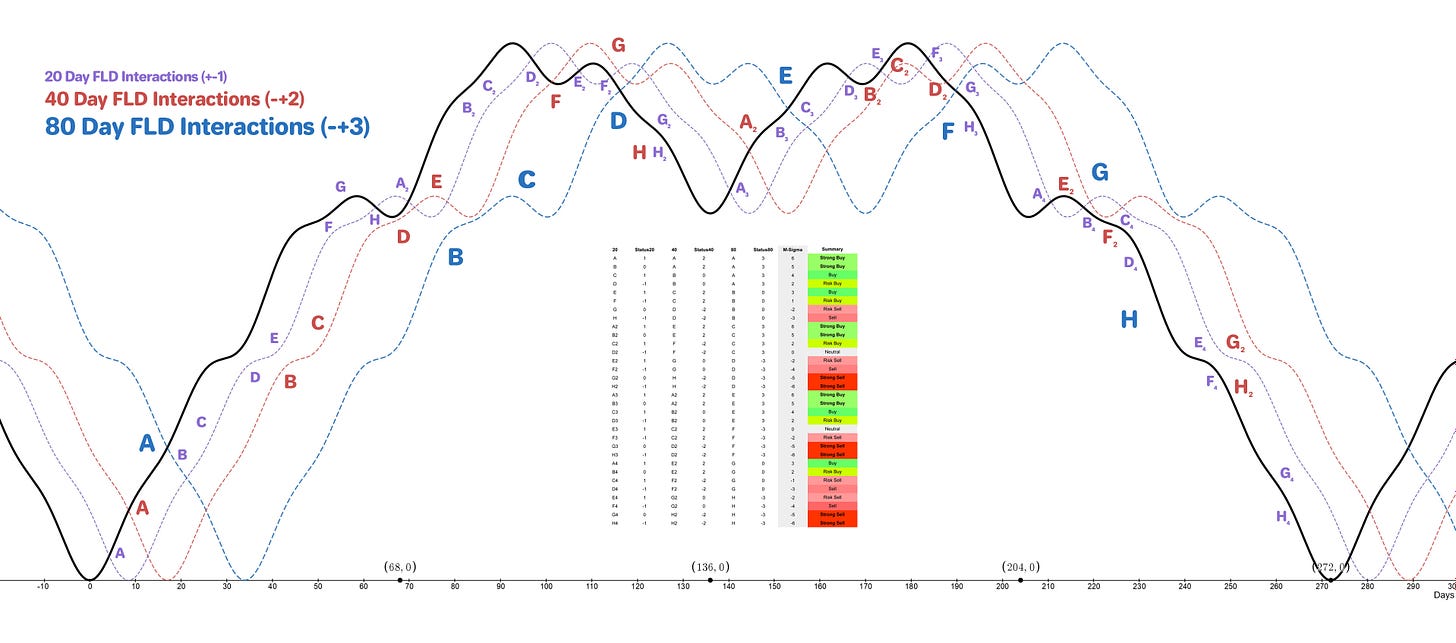
Interactions and price in the FLD Trading Strategy (Advanced). This looks at an idealised 40 week cycle and an array of 3 FLD signal cycles. We apply the instrument’s phasing to the model and arrive at an overall summary for the interactions with the 20 day FLD, current and forthcoming.
Sigma-L recommendation: Strong Sell
Entry: 10 Day FLD / 20 Day FLD
Stop: Above forming 80 day nominal peak
Target: 1.33, then 1.30 around the 40 week FLD support
Reference 20 Day FLD Interaction: D4 or F4
Underlying 40 Day FLD Status: F2
Underlying 80 Day FLD Status: H
Assuming that the 80 day component low did indeed occur in early November we have a strong sell in prospect for USDCAD as price makes a final move to an anticipated 18 month nominal low. Initial targets are the previous low of the 80 day component around 1.33 then at the 40 week FLD itself, around 1.3.
The 80 component low is expected in late January 2023, this should also be the 18 month nominal low.
Heavy outlier chance that the low in early October was the 18 month nominal low. If that is the case the 80 day component should form a higher low in late January.
FLD Settings
If you do not have the use of Sentient Trader use these settings to plot common FLDs in your trading software (daily scale) to more easily follow trading signals and strategy from Sigma-L.
Make sure to account for non-trading days if your broker omits them in the data feed (weekends, for example). The below offsets are given with no added calculation for non-trading days.
80 day nominal: 74 days | 37 day FLD offset
40 day nominal: 38 days | 19 day FLD offset
20 day nominal: 19.2 days | 10 day FLD offset
10 day nominal: 9.5 days | 5 day FLD offset


