USDCAD: Hurst Cycles - 23rd November 2022
The loonie is a joy to analyse on Sigma-L, a strong signal at the 80 day component fascinating to observe. After price peaks from the 18 month component in October, we anticipate price action to come
Tools required: Nominal Model | FLD | FLD Trading Strategy | FLD Trading Strategy (Advanced) | Principle of Nominality | Underlying Trend
Analysis Summary
USDCAD is a wonderful example to bring to Sigma-L subscribers in recent months, mainly due to the two main states of price action in financial markets that can guide us: cycling and trending modes.
In a cycling mode, more commonly assigned the colloquial ‘sideways’ price action title, larger periodic components are net neutral in their influence on price. We alluded to this a little in the last report, noting that the wonderfully stationary signal at the 80 day component will begin to be suppressed when power from the 18 month component is exerted, price action subsequently entering a trending mode.
From 27th September Report:
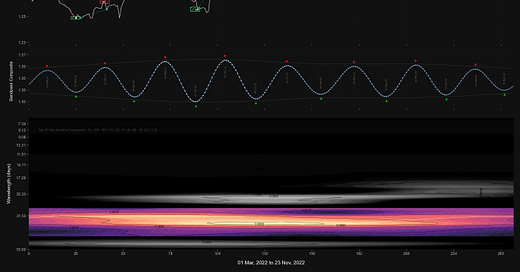
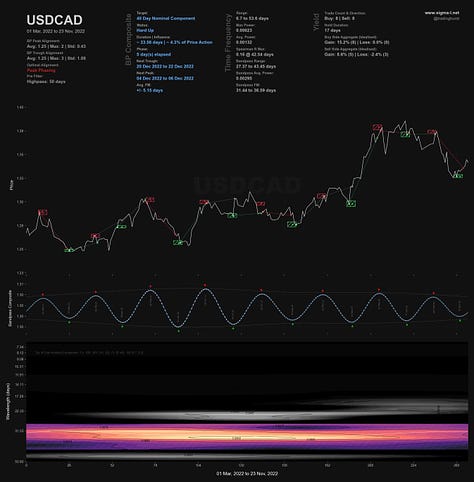
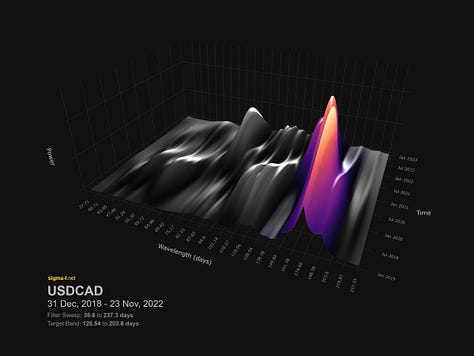
Indeed it is the relatively neutral influence of larger periodic components that has revealed the exemplary 80 day component signal (@ ~ 75 days) shown on the time frequency analysis below.
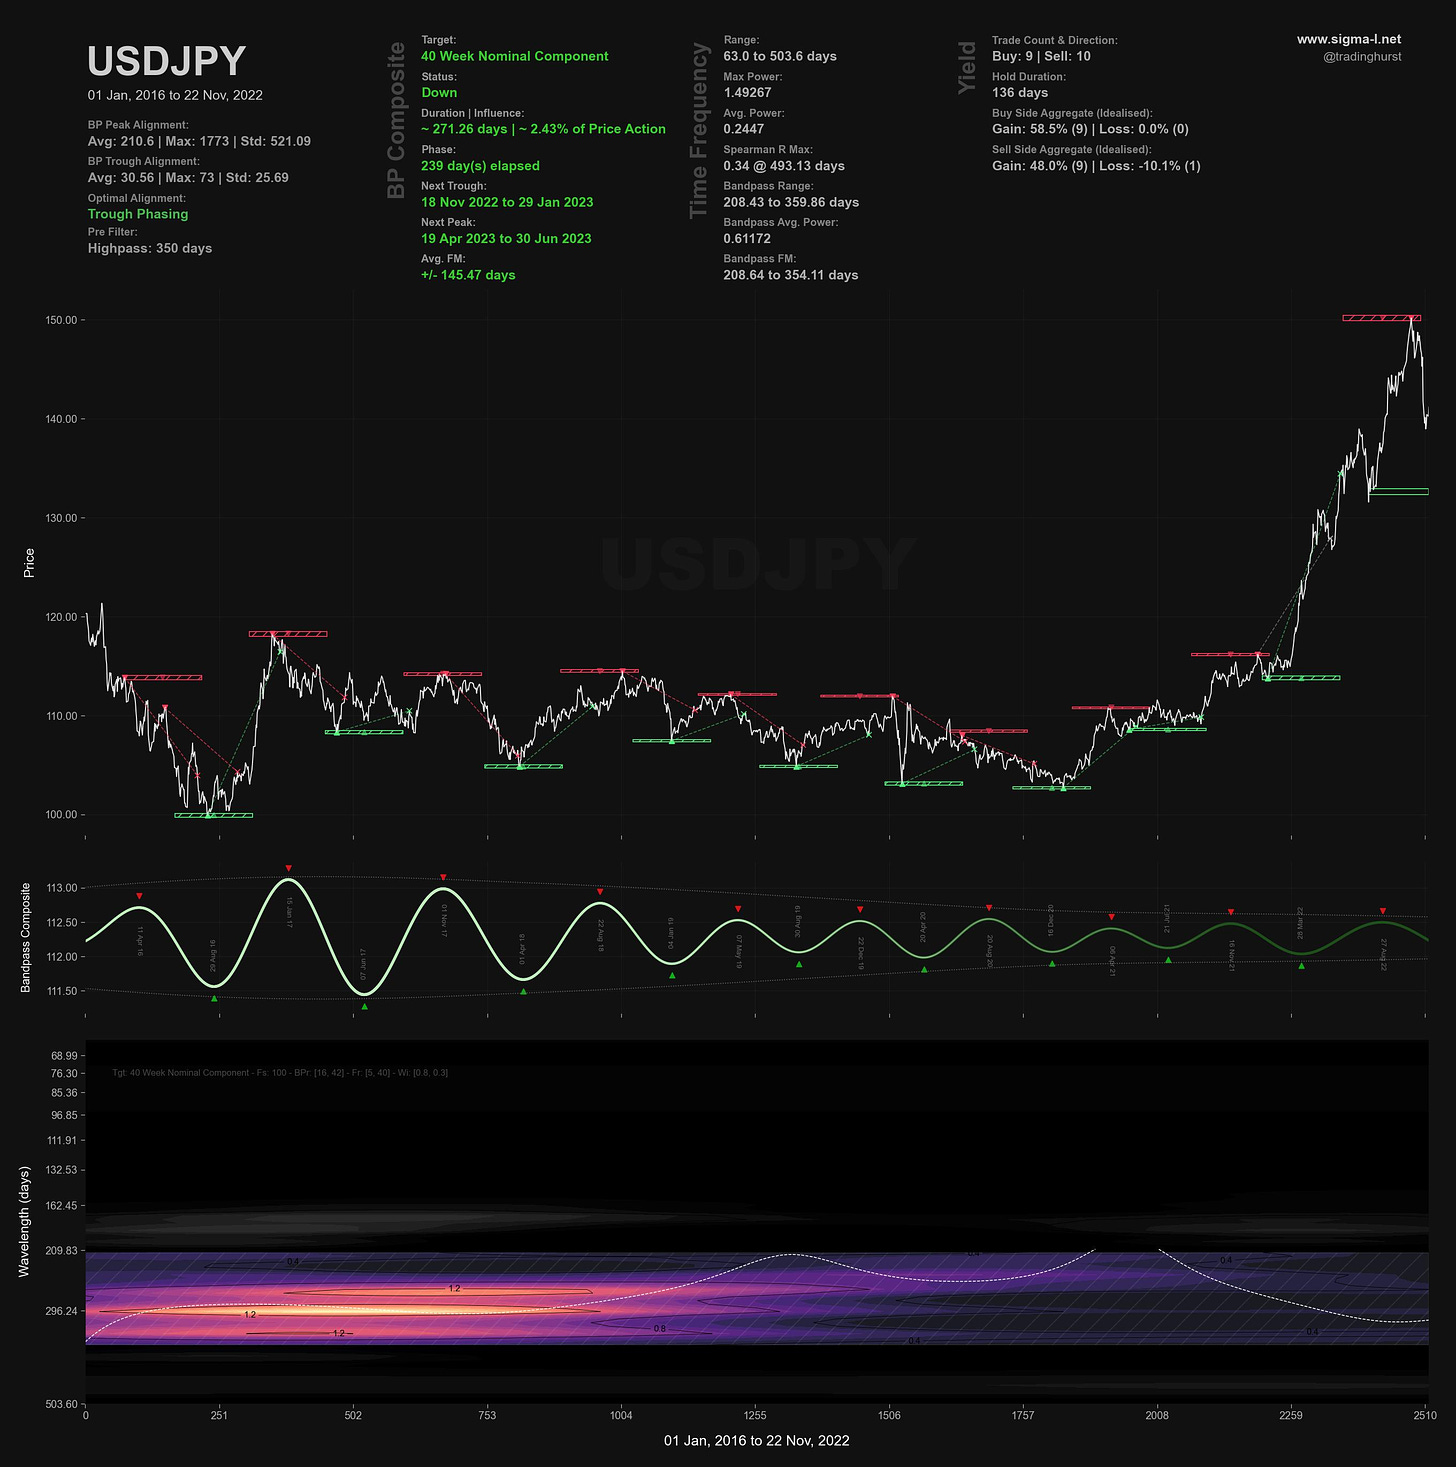
The cycling mode was referred to by Hurst in some of his work as a pause zone and includes ‘triangle’ style ‘traditional price action’ structures. The triangle structure itself comprising a series of smaller component being gradually ‘squeezed’ by the increasing influence of a larger component. Below is a textbook example in USDJPY, in this case the 40 week nominal wave:
Of course context is necessary here: a trend mode at the 18 month component level may well be a cycling mode at the 4.5 or 9 year component level, such is the fractal nature of price organisation in financial markets.
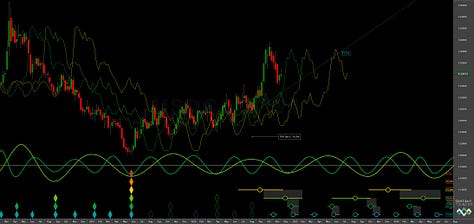
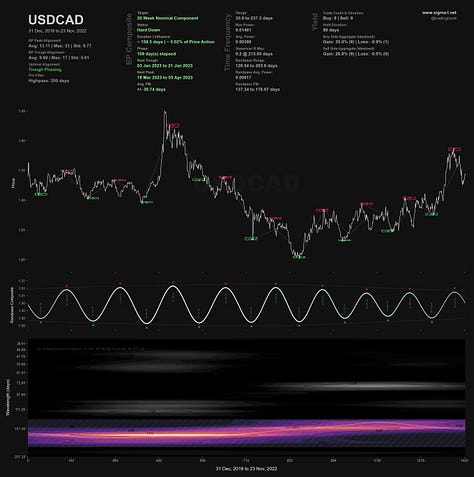
The trending mode we saw in September with the USDCAD pair has also suppressed the previously wonderful 80 day nominal component. So much so that both the time frequency analysis and Sentient Trader’s algorithm are really struggling to assess a valid placement for it. This has introduced a 40 day nominal component margin of error into the phasing, with, in our opinion two possible placements for the most recent 80 day component low: 4th October or 27th October. Our bias is currently for the 4th October which implies the most recent move up from 15th November is a low of 40 day magnitude.
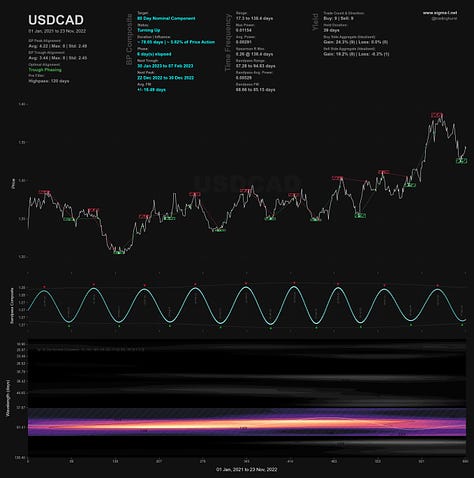
We can step back and step forward in these situations. More precisely in this case step back to the 20 week component and step forward to the 40 day component, both of which are fair signals. The most notable of which is the 20 week wave at around 160 days, shown clearly in the time frequency analysis below and due to trough at the end of 2022.
Longer term we assessed the peak of the 18 month component fairly accurately and it is likely the next trough of this component will come at 18 month FLD support around the 1.3 area:
From 27th September Report:
At this point we are very likely peaking from the latest 80 day component, so the analysis is fairly straightforward at this point. It is likely the peak forming is also the peak of the 18 month component, is right translated (bullish) and is due to trough mid-late December, assuming a continuation of the 20 week component average wavelength.
Phasing Analysis
Sentient Trader
Utilising a pattern recognition algorithm and Hurst’s diamond notation
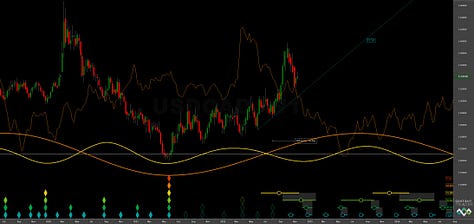
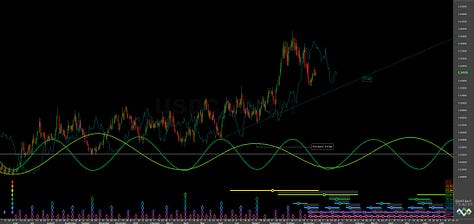
Time Frequency Analysis
Wavelet convolution targeting 40, 80 day and 20 week components


Trading Strategy
Interaction Status
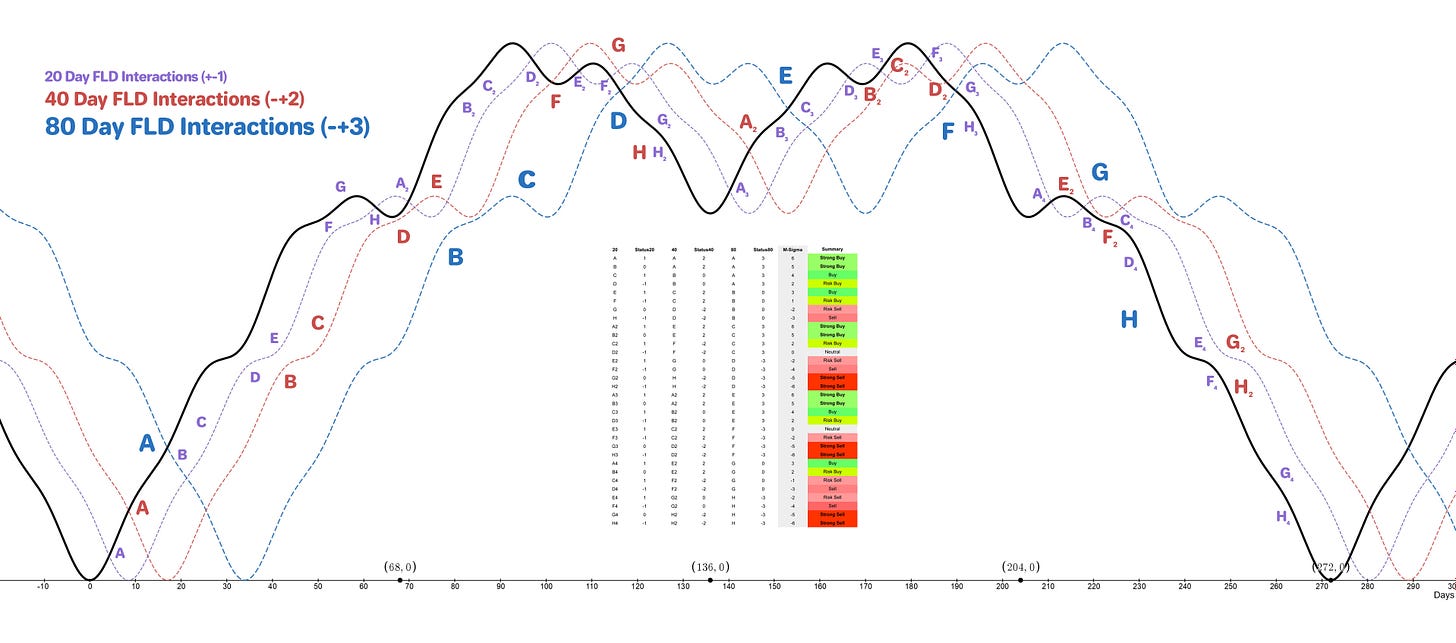
Interactions and price in the FLD Trading Strategy (Advanced). This looks at an idealised 40 week cycle and an array of 3 FLD signal cycles. We apply the instrument’s phasing to the model and arrive at an overall summary for the interactions with the 20 day FLD, current and forthcoming.
Sigma-L recommendation: Sell
Entry: 80 day FLD resistance
Stop: Above formed 40 day nominal peak
Target: 1.3
Reference 20 Day FLD Interaction: F4
Underlying 40 Day FLD Status: H2
Underlying 80 Day FLD Status: H
Given that we think the latest rise if from a trough of only 40 day magnitude (not 80 day as the time frequency / ST analysis suggests), resistance at the 80 day FLD might be a wise place for a short entry. The trough of the 40 day FLD is positioned at the start of December and, if the underlying trend is down, should mark the peak of the 40 day component, if not slightly before.
The 20 day FLD component cross target is up at 1.356, around the 80 day FLD. Expect this to perhaps be undershot.
FLD Settings
If you do not have the use of Sentient Trader use these settings to plot common FLDs in your trading software (daily scale) to more easily follow trading signals and strategy from Sigma-L.
Make sure to account for non-trading days if your broker omits them in the data feed (weekends, for example). The below offsets are given with no added calculation for non-trading days.
80 day nominal: 70.3 days | 35 day FLD offset
40 day nominal: 35.2 days | 18 day FLD offset
20 day nominal: 17.2 days | 9 day FLD offset
10 day nominal: 8.7 days | 4 day FLD offset


