USDCAD: Hurst Cycles - 27th September 2022
The 9 year component low finally exerts some bullish pressure on price as targets up at 1.3 are easily surpassed. Will the excellent signal at the 80 day component be retained as we moved forward?
Tools required: Nominal Model | FLD | FLD Trading Strategy | FLD Trading Strategy (Advanced) | Principle of Nominality | Underlying Trend
Analysis Summary
In our last report into the wonderfully cyclical USDCAD we mentioned that a more bullish move above 1.30-1.31 would signal the first indications of the underlying trend (sigma-l) pushing up:
From 12th August Report:
At this stage of the 18 month component we should expect some resistance to price at the 80 day FLD in due course, at around 1.285-1.29. A move above the 80 day FLD to a cross target will suggest the underlying influence from the larger components is starting to influence price action more.
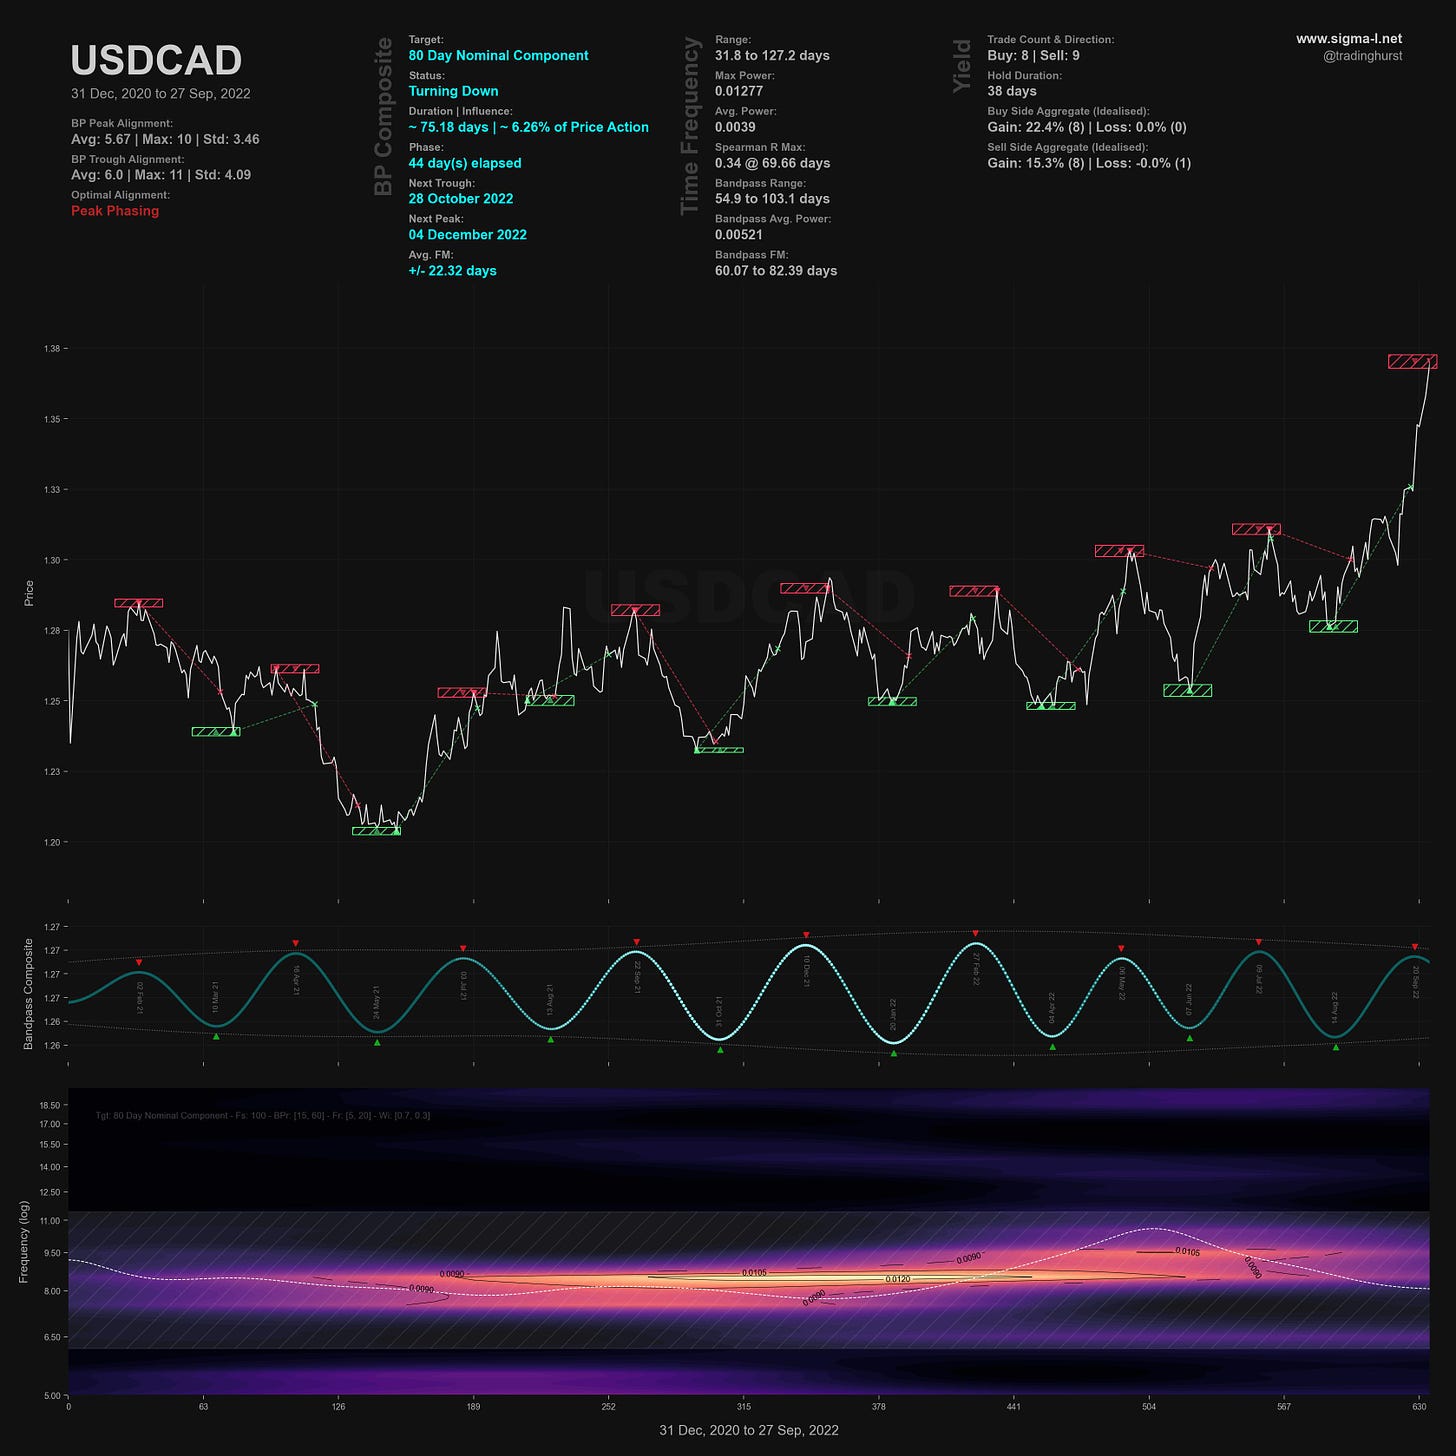
We saw that influence in the latest iteration of the 80 day component subsequent to the 40 day low forming on the 13th September. Clearly this pair is correlated with the USD market in general but it is only recently price has started to accelerate markedly. Indeed it is the relatively neutral influence of larger periodic components that has revealed the exemplary 80 day component signal (@ ~ 75 days) shown on the time frequency analysis below.
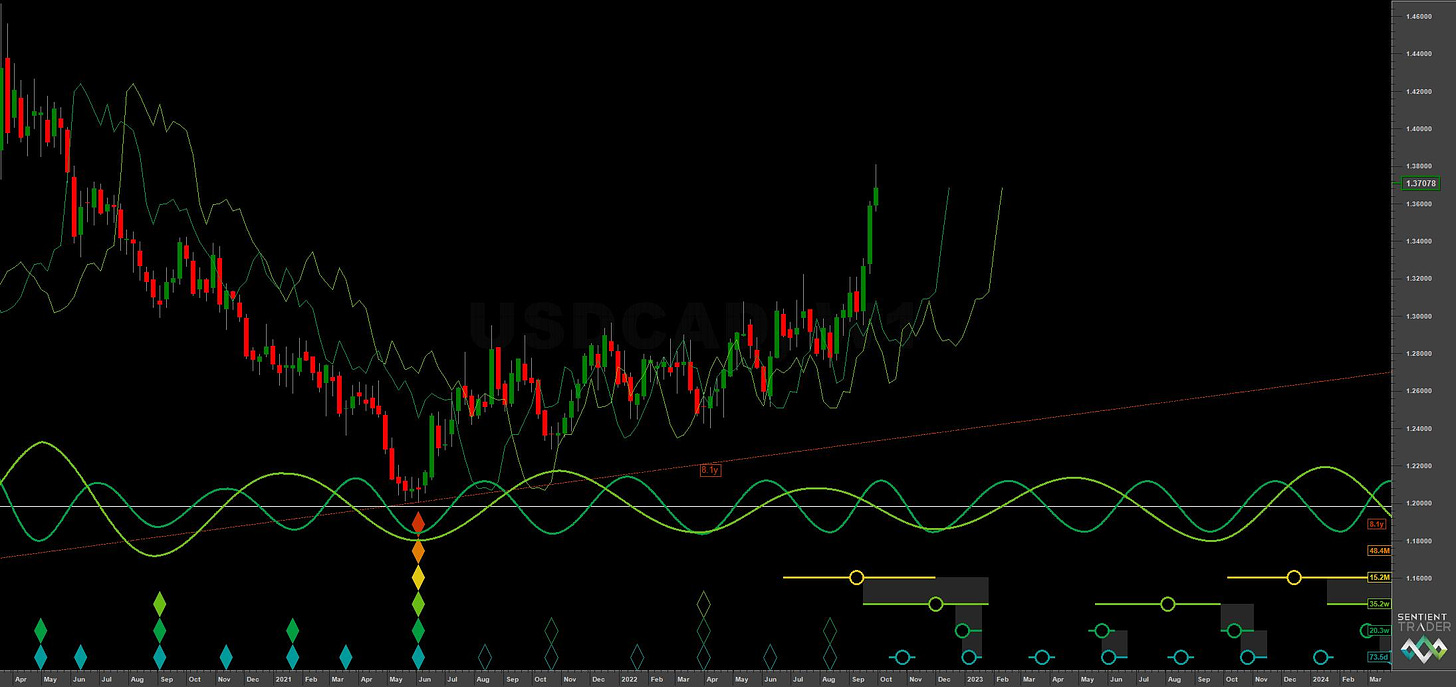
At this point we are very likely peaking from the latest 80 day component, so the analysis is fairly straightforward at this point. It is likely the peak forming is also the peak of the 18 month component, is right translated (bullish) and is due to trough mid-late December, assuming a continuation of the 20 week component average wavelength. The previous 20 week component, shown on medium/short term charts, troughed on 11th August and is currently at 47 days into it’s phase (average wavelength of 20.3 weeks).
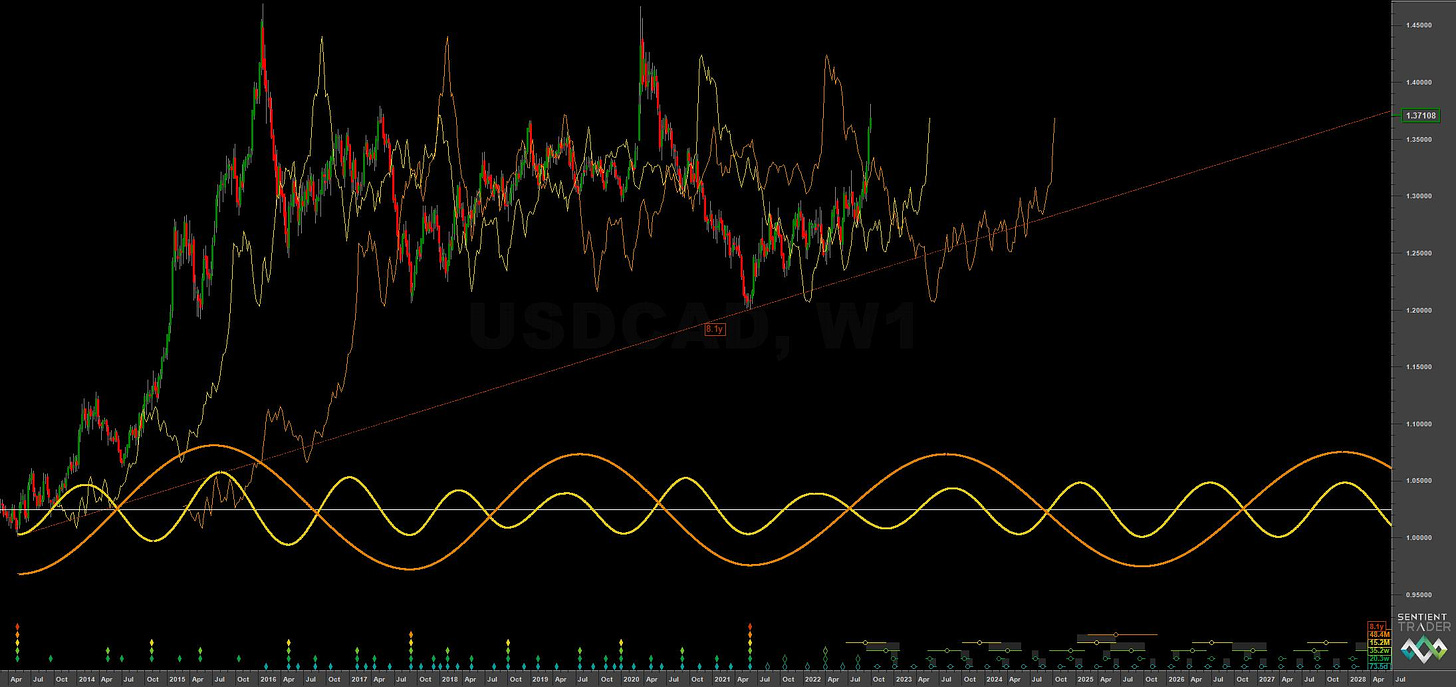
The 80 day component continues to be one of the best signals in all markets that we cover and there is no reason to expect it to modulate any more than the average frequency modulation shown for the sample period (around 22 days). What we might have to expect is some level of amplitude modulation as larger components attenuate the smaller ones. This would be the case here subsequent to the 18 month component low forming and price being expected to further push higher in 2024. On that note the recently crossed 54 month FLD (orange on long term chart) has a FLD projection target of 1.4582 over the next 12 months. Looking at the trough of the 54 month FLD we can expect a time of May 2023 at least for the peak to form of this larger component. A peak occurring exactly around this time period indicating, as it does, a neutral underlying trend.
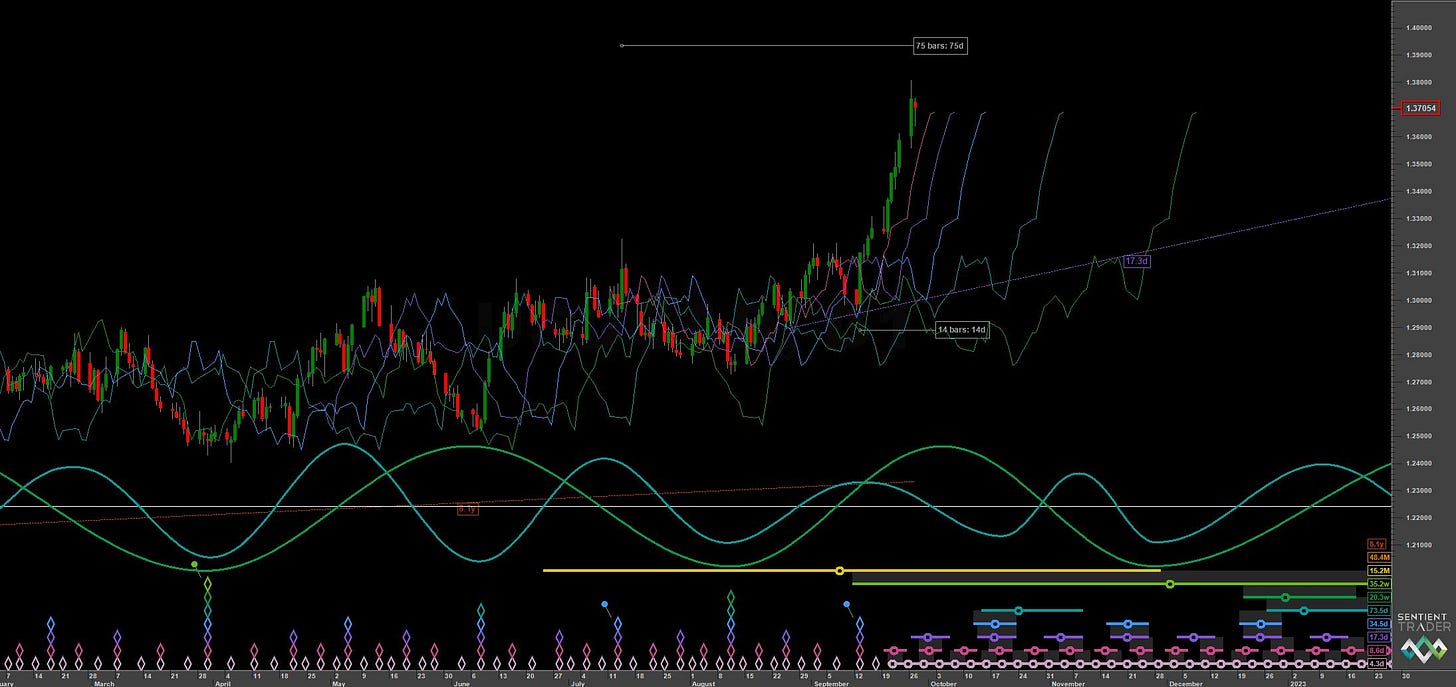
A bearish FLD cascade is currently under price and invites a short position, more on that below in the trading strategy. Expect the next trough of the 80 day component to occur mid-late October. There should then be one final iteration of this component before the 18 month nominal low in December.
Phasing Analysis
Long Term
Components greater than and including the 18 month nominal cycle
Medium Term
Components less than and including the 18 month nominal cycle
Short Term
Components around the 80 day nominal cycle
Time Frequency
Wavelet convolution output targeting 80 day nominal component
Trading Strategy
Interaction Status
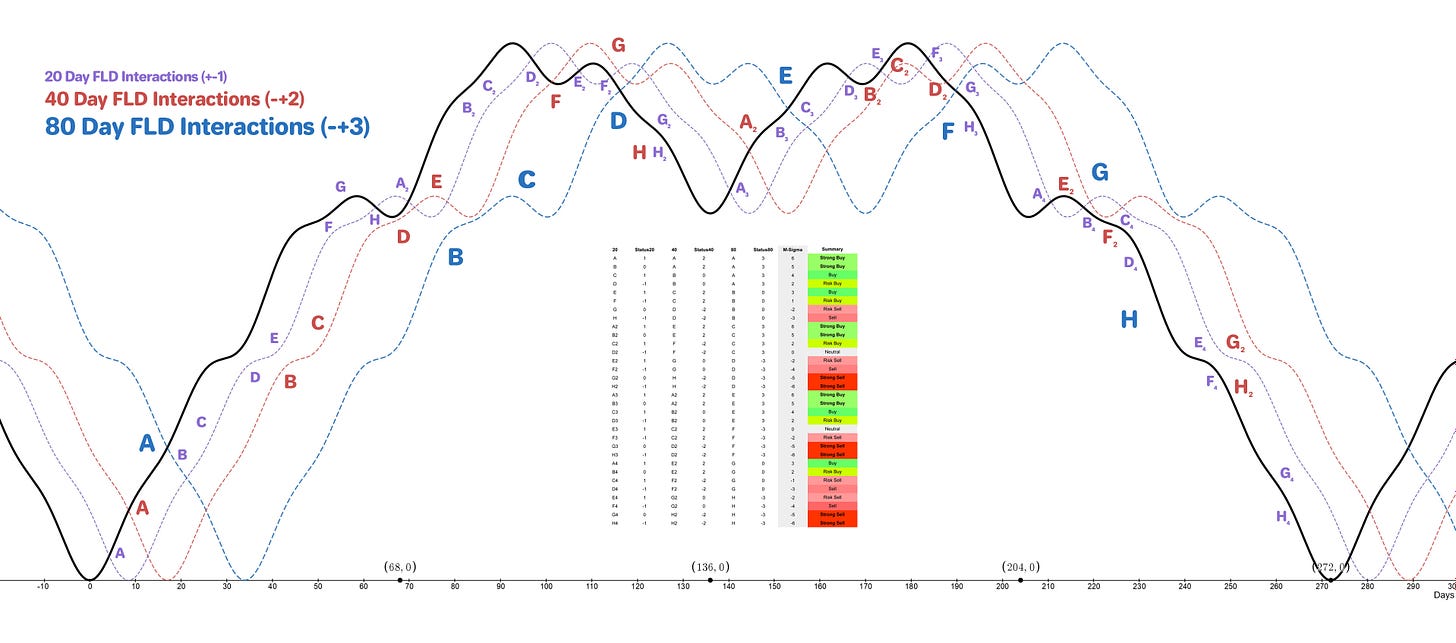
Interactions and price in the FLD Trading Strategy (Advanced). This looks at an idealised 40 week cycle and an array of 3 FLD signal cycles. We apply the instrument’s phasing to the model and arrive at an overall summary for the interactions with the 20 day FLD, current and forthcoming.
Sigma-L recommendation: Sell
Entry: 10 Day FLD / 20 Day FLD
Stop: Above forming 80 day nominal peak
Target: 1.30-1.32
Reference 20 Day FLD Interaction: F3
Underlying 40 Day FLD Status: D2
Underlying 80 Day FLD Status: F
The rapid ‘blow off’ rise from the 40 day nominal low on 13th September has setup a bearish FLD cascade from the 10 day FLD down to the 80 day FLD support around 1.30-1.32. This area may well not be approached comprehensively until the 18 month nominal low in December (as phased) but traders should be aware that the 18 month component is likely peaking here.
We can likely expect the excellent signal at the 80 day component to continue (see time frequency chart), although it will possibly begin to be attenuated as larger components start to influence price action.
FLD Settings
If you do not have the use of Sentient Trader use these settings to plot FLDs in your trading software (daily scale) to more easily follow trading signals and strategy from Sigma-L.
Make sure to account for non-trading days if your broker omits them in the data feed (weekends, for example). The below offsets are given with no added calculation for non-trading days.
80 day nominal: 73.5 days | 37 day FLD offset
40 day nominal: 34.5 days | 17 day FLD offset
20 day nominal: 17.3 days | 9 day FLD offset
10 day nominal: 8.6 days | 4 day FLD offset


