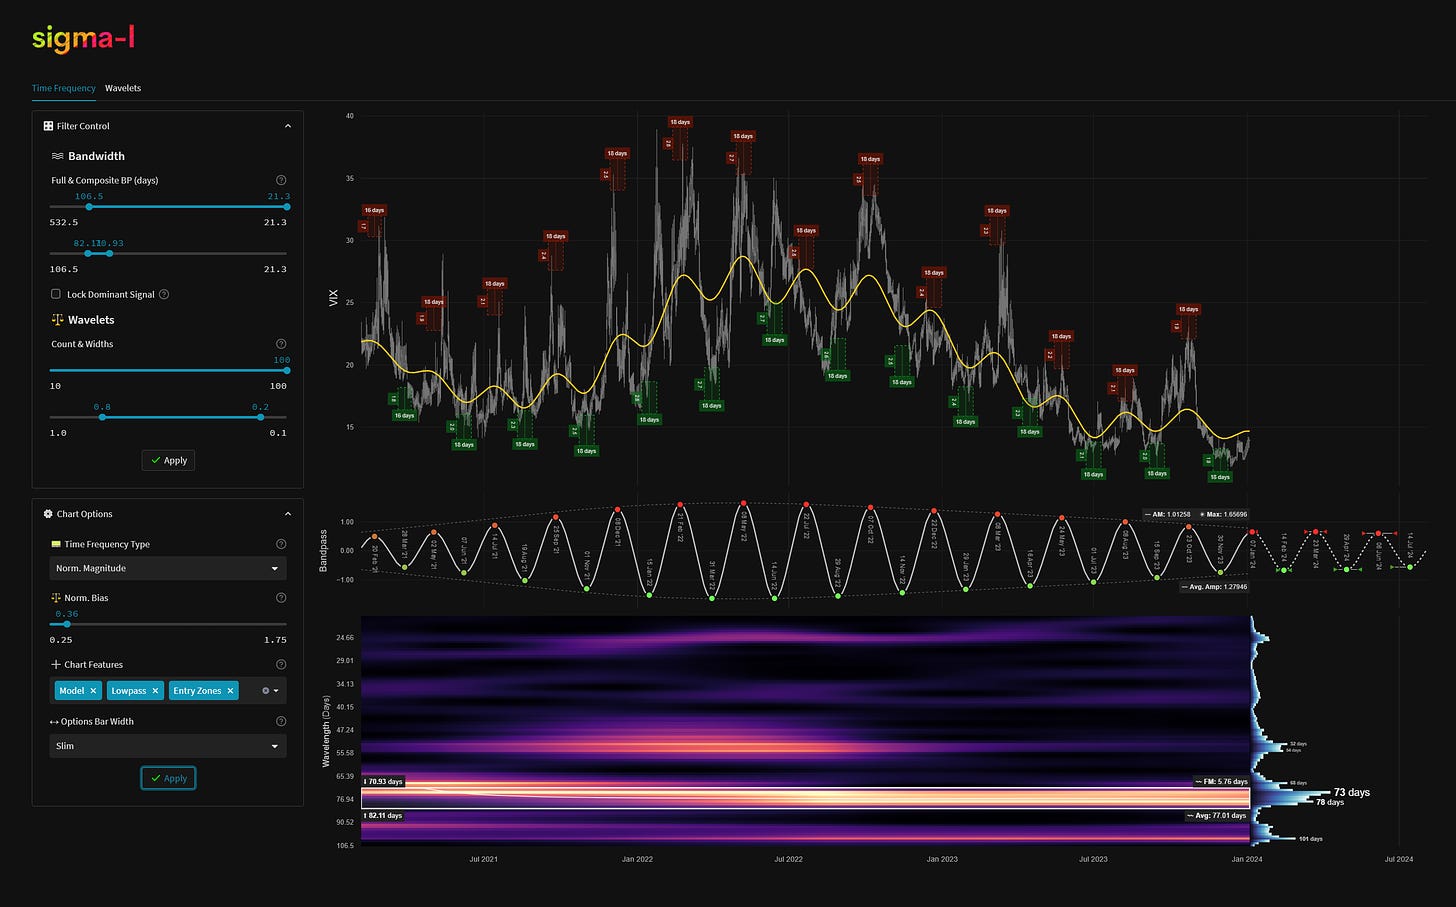
CBOE Volatility Index (VIX) - 13th February 2024 | @ 77 Days | - 0.28%
Last trade: - 0.28% | 'A' class signal detected in CBOE Volatility Index (VIX). Running at an average wavelength of 77 days over 15 iterations since February 2021. Currently troughing.
ΣL Cycle Summary
A continuation of the largely flat progress in this wave for the VIX has been apparent in the down leg since early January. A higher frequency component, notionally the 20 day nominal wave, has made a rare appearance as the dominant periodic component, such was the neutral power exerted by underlying trend throughout this current cycle. The time is now right for the next move up in this excellent wave around 75 days average wavelength. Bulls will be hoping for an explosion in amplitude to accompany the forthcoming up leg. This should also co-incide with a peak of the similar and inverted 80 day nominal wave in stock markets globally.
Trade Update
See also: Live ΣL Portfolio & History
Summary of the most recent trade enacted with this signal and according to the time prediction detailed in the previous report for this instrument, linked below.
Type: Sell - CBOE Volatility Index 3rd January 2024
Entry: 3rd January 2024 @ 14.04
Exit: 13th February 2024 @ 14.08
Gain: - 0.28%
Before and After
Signal comparison between our last report and the current time, in chart format.


