SPDR S&P Metals & Mining ETF (XME) - 29th February 2024 | @ 78 Days
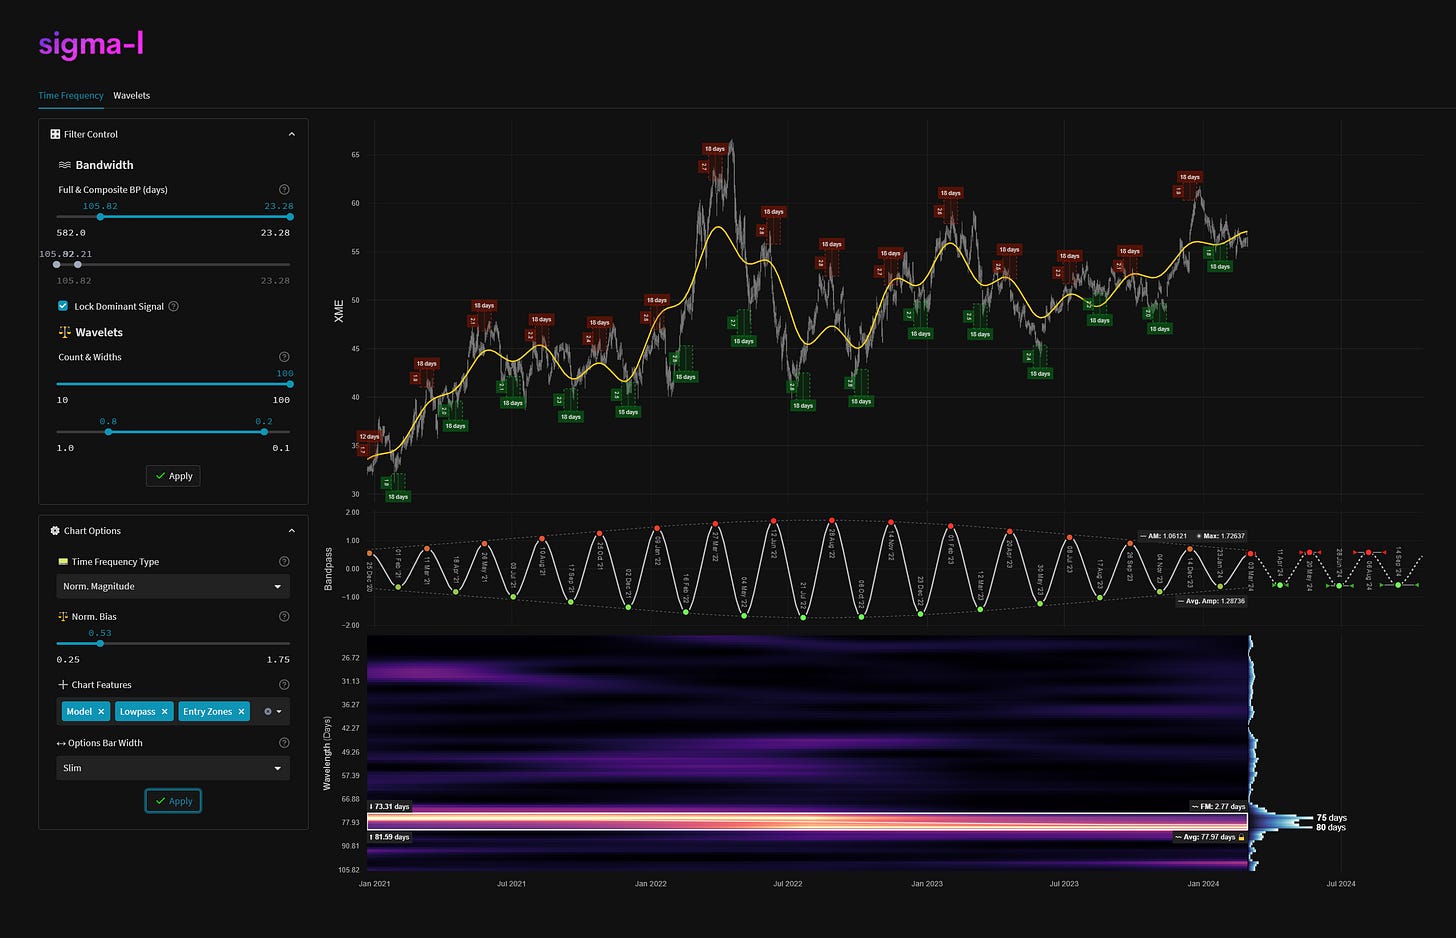
'A' class signal detected in SPDR S&P Metals & Mining ETF (XME). Running at an average wavelength of 78 days over 15 iterations since December 2020. Currently peaking.
Instrument Summary
The SPDR S&P Metals & Mining ETF (XME) is an exchange-traded fund that focuses on companies in the metals and mining industry. It provides diversified exposure to this sector. Holdings of XME include Nucor Corporation, Freeport-McMoRan Inc., Cleveland-Cliffs Inc., United States Steel Corporation, and Alcoa Corporation.
ΣL Cycle Summary
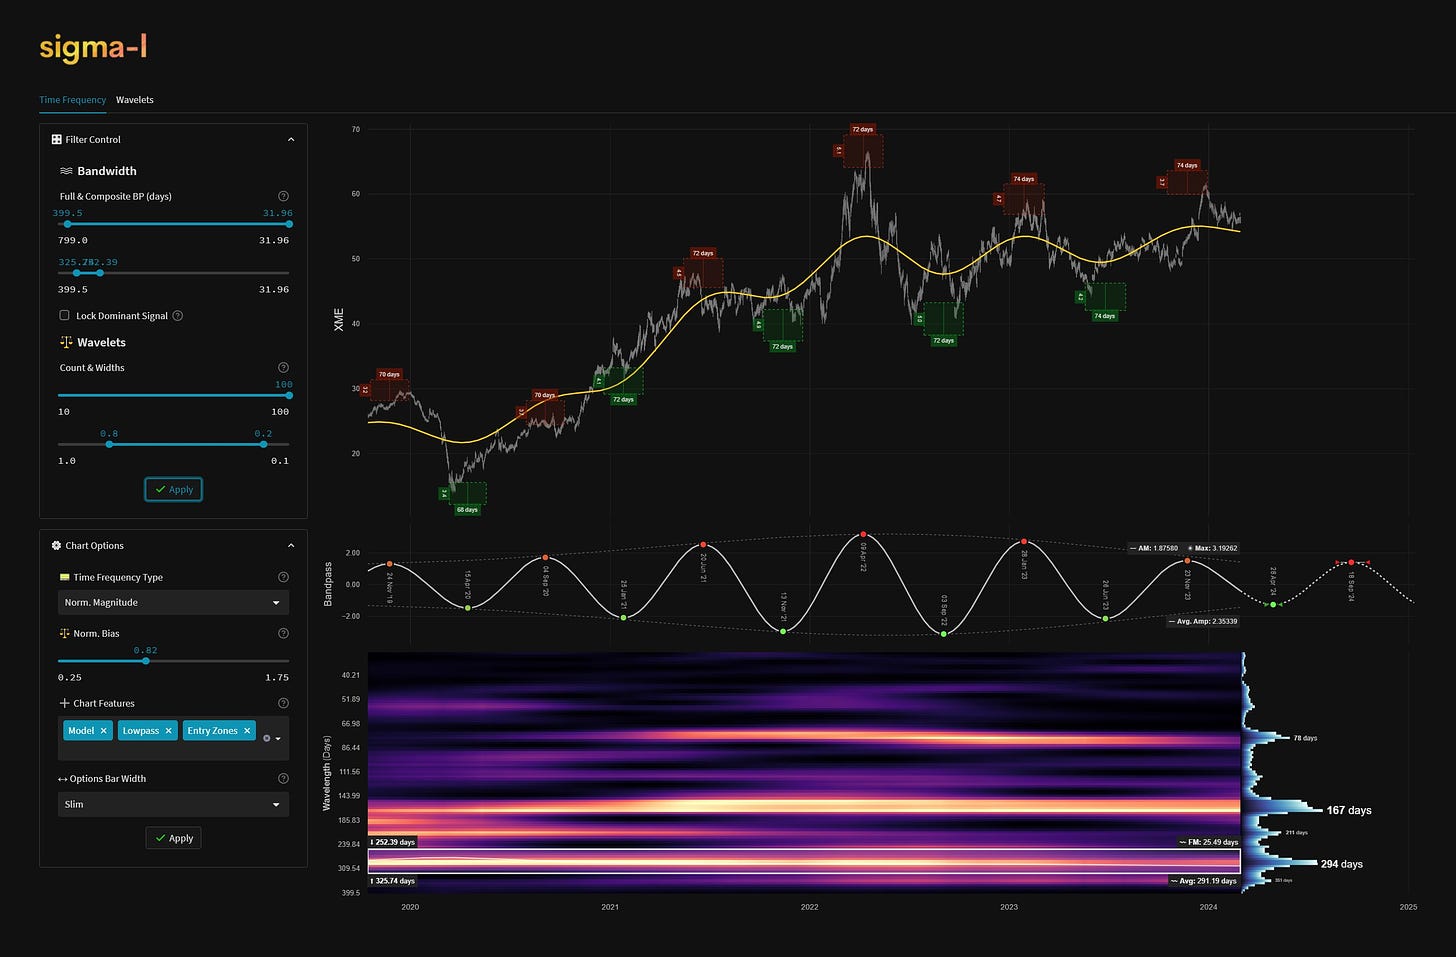
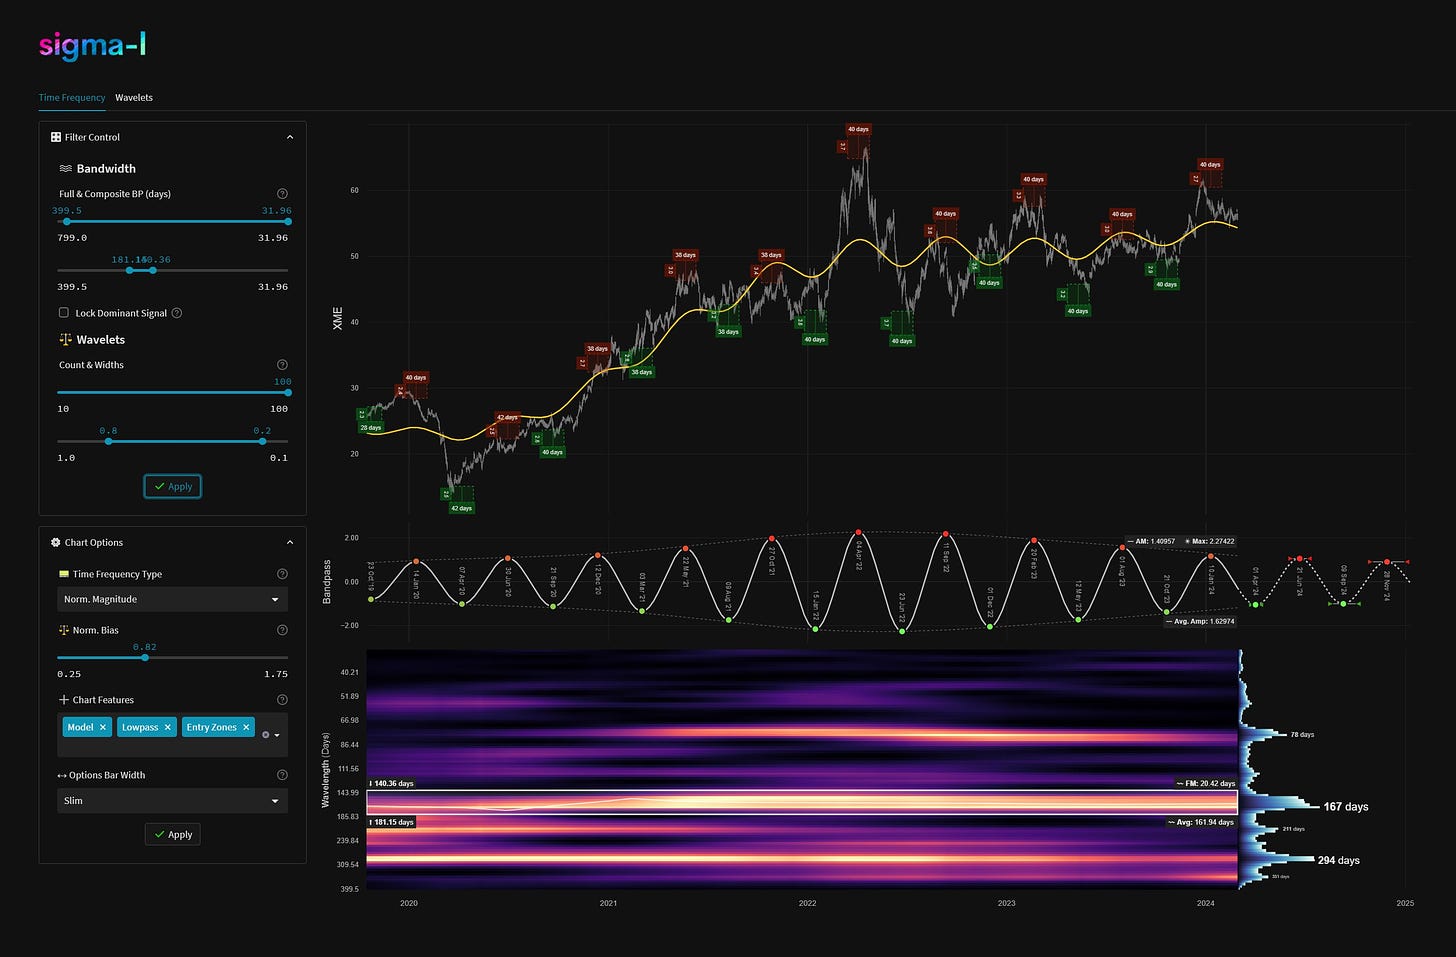
This superb signal, sampled from December 2020, is one of three outstanding periodic components in XME below 400 days. Whilst the two others, around 160 and 300 days are both phased as hard down, this wave is likely peaking prior to completing the move to mid April and a large, phase clustered low with the aforementioned longer waves (also shown below). What makes this signal so coherent is the spectral spacing in the frequency domain. This can be seen on the time frequency plot below with a well defined area of bright colour and surrounding regions seeing a sharp drop off in signal strength. That implies this component is dominant in the region below 100 days and suffers very little frequency or amplitude modulation over a long period, 15 iterations in this case.
Time Frequency Analysis
Time frequency charts (learn more) below will typically show the cycle of interest against price, the bandpass output alone and the bandwidth of the component in the time frequency heatmap, framed in white. If a second chart is displayed it will usually show high-passed price with the extracted signal overlaid for visual clarity.

Current Signal Detail & Targets
Here we give more detail on the signal relative to speculative price, given the detected attributes of the component. In most cases the time target to hold a trade for is more important, given we focus on cycles in financial markets. Forthcoming trough and peak ranges are based upon the frequency modulation in the sample (learn more).
Detected Signal Class: A - learn more
Average Wavelength: 77.97 Days
Completed Iterations: 15
Component Yield Over Sample: {GPF} - learn morePhase: Peaking / Peaked
FM: +- 3 Days
AM: 1.06121
Next Trough Range: 8th - 14th April, 2024
Next Peak Range: 17th - 23rd May, 2024
Sigma-L Recommendation: Sell
Time Target: ~ 11th April, 2024
Current Signal Phase
This is ‘how far along’ the cycle is in it’s period at now time and is related to the predicted price action direction.
Current Signal Frequency Modulation (FM)
This is how much, on average, the signal detected varies in frequency (or wavelength) over the whole sample. A lower variance is better and implies better profitability for the component. Frequency usually modulates relatively slowly and over several iterations.
Current Signal Amplitude Modulation (AM)
This is how much the component gains or loses power (price influence) across the sample, on average. Amplitude modulation can happen quite quickly and certainly is more evident than frequency modulation in financial markets. The more stable the modulation the better.


